Upward ChannelExpecting to complete wave 5. Watching closely at the very top if will break out or Sell opportunity will be the next move.
Trade ideas

Why USD is a forex King !USD continues to show why it’s considered the king of the forex market—its strength sets the tone across major pairs. I’m watching how its momentum influences broader market structure

Gold's Final PushGold is clearly bullish, but the liquidity accumulation phase is not yet complete.
In my view, Gold is preparing to break the current Daily High Swing, but this high looks weak because of the recent sweep from the bottom.
The High-Probability Scenario:
Expect the price to sweep the high (a liquidity grab).
Immediate rejection back down to collect continuation Demand that is waiting.
Final structural break to the upside.
My ultimate target is the extreme high at 4300++. I view this as the final wave of this leg, which will likely involve a final, deep sweep down to the absolute swing bottom demand before the most powerful, structurally perfect breakout occurs.
Caveat: If extreme FOMO takes over, this controlled liquidity accumulation phase will be completely invalidated.
If you appreciate detailed, phase-by-phase SMC analysis, hit Like and Follow to track this roadmap with me!

GOLD Is Bullish! Buy!
Take a look at our analysis for GOLD.
Time Frame: 4h
Current Trend: Bullish
Sentiment: Oversold (based on 7-period RSI)
Forecast: Bullish
The market is approaching a significant support area 4,188.16.
The underlined horizontal cluster clearly indicates a highly probable bullish movement with target 4,233.29 level.
P.S
Overbought describes a period of time where there has been a significant and consistent upward move in price over a period of time without much pullback.
Like and subscribe and comment my ideas if you enjoy them!

Gold H1 - Can Gold reject 4167 and fall to 4133 today?🟡 XAUUSD – Intraday Smart Money Plan | by Ryan_TitanTrader (27/11)
📈 Market Context
Gold is trading inside an intraday consolidation after a strong H1 displacement. The session is now primed for liquidity engineering before the next leg.
Key narrative drivers traders must respect today:
• Stronger USD expectations continue to shape risk sentiment
• Institutional desks frequently exploit sweep zones during consolidation
• Range-bound conditions favor fakeouts → displacement → expansion mechanics
• Headlines around U.S. monetary tone amplify intraday volatility
The current chart highlights balanced liquidity both above and below structure, supporting a two-way SMC playbook.
🔎 Technical Framework – Smart Money Structure (H1)
Market is holding a rising channel, but internally ranging — a typical liquidity map scenario:
• Buy-side liquidity pocket: 4180 → 4182 (premium extreme)
• Sell-side liquidity pool: 4110 → 4133 (discount extreme / origin zone)
• Internal equilibrium zone: 4150–4170 chop region (no-trade area)
We expect this sequence:
Sweep → CHoCH/BOS → Displacement → Retest → Expansion.
🎯 Trade Plans for Today
🔴SELL GOLD 4180–4182 | SL 4190
Thesis: Premium liquidity sweep above local highs before downside displacement.
Activation rules:
• Price sweeps 4182 liquidity
• Bearish CHoCH/MSS + BOS down on M5–M15
• Imbalance retest / FVG entry after structure break
Targets:
• 4167 (nearest reaction)
• 4150 (equilibrium raid)
• 4135–4133 (discount retest)
🟢 BUY GOLD 4135–4133 | SL 4125
Thesis: Sell-side liquidity sweep into the origin zone before upside impulse.
Activation rules:
• Price taps 4133 pool (sweep below structure)
• Bullish CHoCH/MSS + BOS up on M5–M15
• FVG fill / bullish rejection wick confirmation
Targets:
• 4155+
• 4167 (reclaim zone)
• 4180+ (premium raid target)
⚠️ Risk Management
• Do NOT trade inside 4150–4170 without clear displacement
• Wait for CHoCH + BOS before execution
• Treat the upper and lower zones as liquidity traps, not trend entries
• Reduce size during news spikes unless structure confirms
• SL = wave invalidation, no averaging in chop
📝 Summary
Gold is in accumulation/redistribution mode. Desks may:
• Run buy-side liquidity at 4182, then displace down → retest discount
or
• Sweep sell-side liquidity at 4133, confirm CHoCH up → expand with impulse
Today is a liquidity session, not early trend chasing. Execute only after confirmation.
📍 Follow @Ryan_TitanTrader for daily Smart Money updates.

Gold Bullish Consolidation Continues momentumGold Gold rises after U.S Data rein forces rate cuts bets price rise in early trading on growing expectations that the federal reserve will lower and weaker dollar and growth expectations
Today, the market’s attention is on U.S. jobless claims and durable goods orders. A combination of softer monetary policy expectations, ongoing geopolitical risks, and strong structural demand from central banks continues to create a favourable environment for gold.
From a technical perspective, gold maintains upward momentum within the current range. If buyers hold control and price sustains above key support levels, the next upside targets are seen at 4195 and 4220.
You may find more details in the chart,
Trade wisely best of luck buddies.
Ps; Support with like and comments for better analysis Thanks for supporting.

Hellena | GOLD (4H): LONG to resistance area of 4298.I suggest to consider the lower timeframe (1H), which has some peculiarities.
I see here an upward impulse in the red wave “3”, which is not over yet.
I believe that we should expect the price in the resistance area of 4298.33.
A small correction in the form of continuation of wave "4" to the area of 4174.78 is also possible. But in general, I am set for long positions.
Manage your capital correctly and competently! Only enter trades based on reliable patterns!

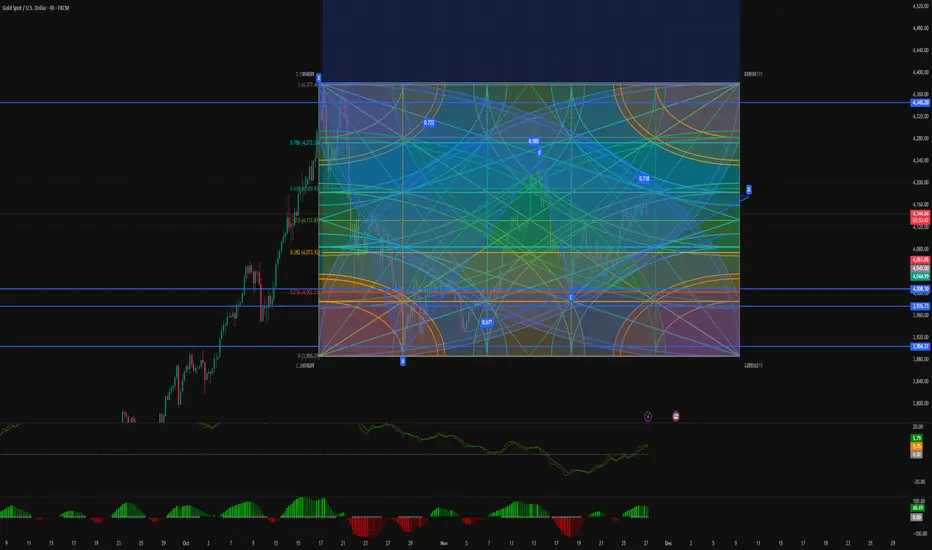
Gold (XAUUSD) – Key Time Pivot Ahead, Potential Upside MoveGold is approaching one of the most important time pivot zones of the week.
Based on a combination of Gann analysis, Harmonic patterns (ABCD), Time Cycles, and momentum structure, the market is showing signs of a potential bullish reversal.
✅ Why a Bullish Move Is Likely
Several major signals are aligning:
1️⃣ Time Cycle Confluence – Strong Pivot at 9 PM UTC+2:00
Multiple time cycles, Gann angles, and the hexagonal time-star all converge around the same time window.
This type of confluence is rare — and usually marks the beginning of a new directional wave.
2️⃣ Corrective Structure Into Point D
The recent move into the D-point shows corrective behavior, not impulsive selling.
This indicates the market is preparing for a shift in direction.
3️⃣ Momentum Divergence
RSI and MACD are showing clear bullish divergence, confirming loss of bearish strength.
4️⃣ Accumulation Instead of Distribution
The last candles show:
Smaller bodies
Lower volume on the downside
Long wicks
This is typical accumulation behavior, not continuation selling.
🎯 Bullish Scenario (Primary Expectation)
If the time pivot triggers as expected, gold may start a new upward wave with potential targets:
4170
4215
4270
Extension target: 4340 if strong momentum develops.
A strong close above the micro-resistance confirms the bullish wave.
Gold 30-Min — Volume Buy & Sell Reversal Triggered⚡Base : Hanzo Trading Alpha Algorithm
The algorithm calculates volatility displacement vs liquidity recovery, identifying where probability meets imbalance.
It trades only where precision, volume, and manipulation intersect —only logic.
✈️ Technical Reasons
/ Direction — LONG / Reversal 4218 Area
☄️Bullish momentum confirmed through strong candle body.
☄️Structure shifted with higher-low near key demand base.
☄️Volume expanding confirms order-flow alignment upward.
☄️Buyers reclaimed imbalance with sustained clean break.
☄️Algorithm detects rising momentum under low liquidity.
✈️ Technical Reasons
/ Direction — SHORT / Reversal 4325 Area
☄️Bearish rejection confirmed through sharp candle body.
☄️Lower-high forming beneath resistance supply region.
☄️Volume decreasing confirms exhaustion in price rally.
☄️Sellers regained imbalance with heavy top rejection.
☄️Algorithm detects fading demand and shift to control.
⚙️ Hanzo Alpha Trading Protocol
The Alpha Candle defines the day’s real control zone — the first battle of momentum.
From this origin, the Volume Window reveals where the next precision strike begins.
⚙️ Hanzo Volume Window / Map
Window tracked from 10:30 — mapping true market behavior.
POC alignment exposes institutional bias and breakout potential zones.
⚙️ Hanzo Delta Window / Pulse
Delta window monitors real buying vs. selling power behind each move.
Tracks volume aggression to expose who controls the candle — buyers or sellers.
When Delta aligns with Volume Map, momentum becomes undeniable.

Gold Price Poised for Breakout as Bullish Channel StrengthensHi!
Market Structure Overview
Price is moving within a clearly defined ascending channel, forming higher highs and higher lows. The recent pullback corrected only about 35% of the previous bullish leg, indicating that buyers are still in control and momentum remains positive.
Key Support Zone (Green Area 4,150–4,175)
This zone represents a former supply that has now flipped into a potential demand area. Price is currently pushing into it from below, and the reaction here will determine the next major move. A clean break and hold above this zone would signal strength and open the path toward higher targets.
Breakout Scenario
If price breaks above the green resistance block, the chart suggests a bullish continuation toward the major supply zone highlighted in red (4,220). The drawn arrow implies that momentum could accelerate once the breakout confirms, aligning with the channel’s upper boundary.
Upside Target (Red Zone 4,220)
This red area represents a strong supply where sellers previously stepped in aggressively. Should price reach this level again, some form of reaction or correction is likely.
Downside Risk
If the breakout fails and price rejects the green zone, a retracement back toward the mid-channel dashed line or even the lower channel boundary would be the next logical move.
Disclaimer: As part of ThinkMarkets’ Influencer Program, I am sponsored to share and publish their charts in my analysis.

GOLD : Bullish ContinuationThere is a strong likelihood that Gold will continue to appreciate following a confirmed breakout above a significant intraday/daily resistance cluster.
We anticipate a move upwards to at least 4300.

XAUUSD: Imminent reversal, don't miss outThe price of gold continues to rise steadily, driven by strong demand that’s pushing the market higher. However, the price is now facing a significant resistance zone, where sellers have previously intervened with conviction. This zone is critical: if buyers lose momentum here and sellers successfully defend the resistance level, we are likely to see a price decline, triggering a correction.
If this rejection is confirmed, it will be a clear signal that sellers will take control and push prices lower. I expect the price could drop to around 4,130.

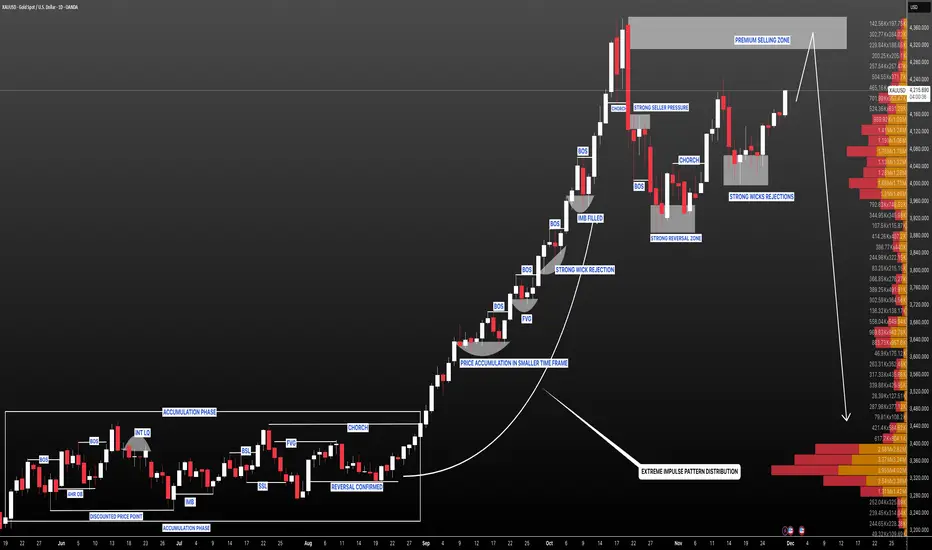
XAUUSD(GOLD): Reaching Our Premium Selling Zone! Get Ready ! Gold is approaching a critical level and we believe this will be a significant move. The $4350-$4400 region has a high volume of sellers, which will be decisive for traders. A price reversal could lead to a substantial decline.
Good luck and trade safe!
Team Setupsfx_
XAUUSD Update Breakout Triangle PatternAfter approximately 1 month of consolidation and forming a triangle pattern, the gold price finally broke through the upper area.
It have a big possibility that gold movement have a target to make a new ATH around 4400-4500 level.
Becarefull with a resistance area at 4244 level and 4272 level.
Jump in when the price make a correction ( pullback ).
Have a blessing week ahead !

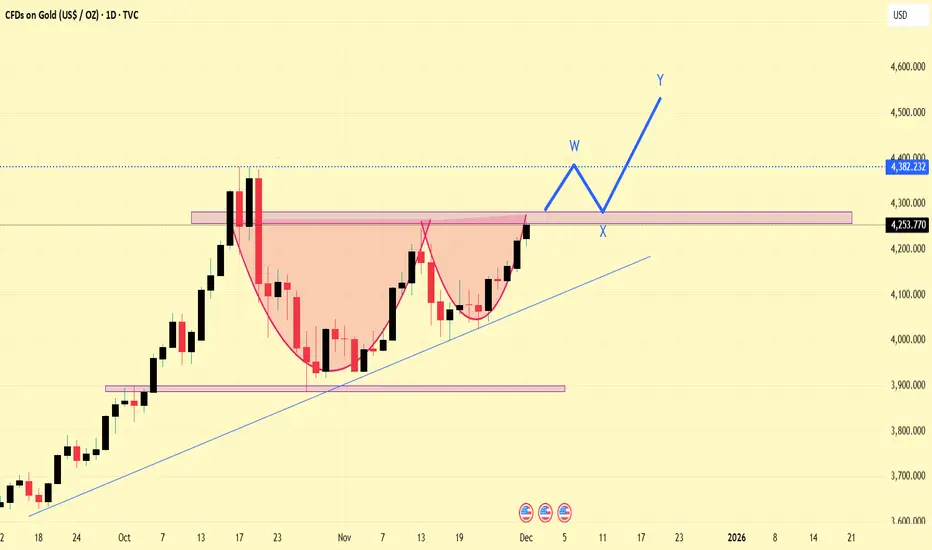
Gold is set to once again reach new highs!As we see there is trndline support and cup and handle pattern also form so bull are back in game but we have to see confirmation breakout for upmove because there is ATH of gold nearly
But overall movement is looking bullish with some of the selling pressure so wait for breakout and retest pattern
XAU/USD | Gold Holds Strong and Targets Higher Levels!By analyzing the 4 hour chart for TVC:GOLD , we can see that after the bullish move earlier today, price dipped to $4040 but immediately bounced as demand stepped in. Gold is now trading around $4091.
If this momentum continues, I expect a push toward $4100, $4110, and $4130. After that, we’ll monitor the reaction around the levels mentioned in the previous analysis. The overall structure remains bullish as long as demand stays active.
Please support me with your likes and comments to motivate me to share more analysis with you and share your opinion about the possible trend of this chart with me !
Best Regards , Arman Shaban

Most Realistic (Yet Profitable) Trading Strategy Signals in 2026CRAZY RESULTS. Setting up and checking the performance reports of one of the most realistic strategy signals on TradingView.
This is what I personally use on all my trades, newly upgraded and refined with new features.


Gold H1 – Will 4212 Hold and Drop to 4160 Today?🟡 XAUUSD – Intraday Smart Money Plan | by Ryan_TitanTrader (27/11)
📈 Market Context
Gold is currently trading within a rising institutional channel after strong H1 displacement. The market is compressing into a liquidity-rich consolidation phase — a classic Smart Money trap environment before engineered expansion.
What Smart Money desks are targeting today:
• Expectation of USD strength shaping bearish bias
• Liquidity sweeps above internal range highs
• Consolidation fakeouts to induce retail mis-positioning
• CHoCH/BOS confirmation required before real directional move
The chart shows equal liquidity zones positioned at premium (sell opportunity) and discount (re-entry buy region).
🔎 Technical Framework – Smart Money Structure (H1)
Current state = Accumulation / Redistribution phase
Liquidity map highlighted zones:
• Premium liquidity zone: 4212 – 4214 (target for short trap)
• Discount liquidity origin zone: 4165 – 4163 (higher timeframe demand re-entry)
• Equilibrium / Chop zone: 4180 – 4195 (no trade unless displaced)
• Trendline support: ~4173 region (must break for downside continuation)
Expected sequence:
Sweep → CHoCH/MSS → BOS → Displacement → Retest (FVG/OB) → Expansion
🎯 Trade Plans for Today
🔴 SELL GOLD 4212 – 4214 | SL 4222
Thesis: Liquidity sweep at premium highs before bearish displacement
Entry activation rules (must wait):
• Price taps 4214 liquidity pocket
• Bearish CHoCH/MSS + BOS down on M5–M15
• Entry taken at FVG fill or order block retest after BOS
Targets:
1. 4200 (first reaction)
2. 4187 – 4185 (BOS retest zone)
3. 4170 (channel mid-equilibrium)
4. 4165 – 4163 (H1 demand retest / profit core)
🟢 BUY GOLD 4165 – 4163 | SL 4143
Thesis: Discount origin tap for impulse continuation buy
Entry activation rules (must wait):
• Price sweeps into 4163 pool
• Bullish CHoCH/MSS + BOS up on M5–M15
• Strong bullish rejection wick + FVG fill confirmation
Targets:
1. 4185 – 4187 reclaim zone
2. 4200+ institutional expansion target
3. 4212+ premium revisit
⚠️ Risk Management
• Avoid trading inside 4180 – 4195 unless displaced
• Do NOT interpret sweeps as trend entries — they are traps
• SL = structure invalidation, no averaging in consolidation
• Reduce size during monetary headlines unless MSS confirms
📝 Summary
Gold is currently in engineered liquidity mode. Expect either:
• Sweep 4214 → MSS/BOS down → drop into 4163 discount retest,
or
• Tap 4163 → bullish MSS/BOS up → expand toward 4200 – 4212+
Today = confirmation-based execution only, not trend chasing.
📍 Follow @Ryan_TitanTrader for daily Smart Money updates.

Gold prices fluctuated, experiencing repeated oscillations.
Gold prices retreated during Thursday's Asian session, primarily reflecting improved market risk appetite and reduced safe-haven demand amid thin holiday trading. As market expectations for another Fed rate cut in December intensified, coupled with rising hopes for regional peace negotiations, global market sentiment turned optimistic, prompting some funds to flow from gold to risk assets. This week's US economic data was mixed, but overall did not change the market's assessment of the Fed's policy path. Data from the US Commerce Department showed that durable goods orders rose 0.5% in September, a significant slowdown from the previous 3.0%, but still higher than the market forecast of 0.3%. Excluding transportation, orders rose 0.6%, indicating continued resilience within the manufacturing sector. Gold prices retreated slightly after previous gains, mainly influenced by improved market risk appetite and rising expectations for peace negotiations. However, strong expectations of a Fed rate cut in December put pressure on the dollar, continuing to support gold. While various US economic data showed mixed results, they did not shake the market's judgment on a rate cut.
Recent speeches by several Federal Reserve officials have clearly shifted towards a dovish stance. John Williams of the New York Fed stated that if the economy remains as it is, interest rate cuts would not affect the inflation target; while Fed Governor Waller pointed out that the weakness in the labor market is sufficient to support another rate cut. Against this backdrop, the dollar index fell to a one-week low, continuing to be a significant supporting factor for gold. On the other hand, signs of improvement in the atmosphere surrounding regional peace negotiations have further boosted risk appetite. Multiple statements indicate that while negotiations remain far off, external sentiment has improved, thus weakening gold's safe-haven appeal. Overall, gold's fundamentals present a mixed structure of "cooling safe-haven demand + support from interest rate expectations." Short-term fluctuations in gold are more driven by sentiment than by trend reversal signals. From the combined perspective of interest rate expectations, dollar performance, and technical structure, this round of correction is more like a natural adjustment within an upward trend. If subsequent economic data continues to support expectations of rate cuts, then gold still has the potential to resume its upward trend after retracing to key support levels. However, it should be noted that fluctuations in peace negotiation expectations could bring additional volatility. There are no key data releases or events to watch today. The gold market will close two hours early due to Thanksgiving in the US, but this can be disregarded.
Gold Price Analysis:
Gold touched around 4173 in the US session yesterday before falling back. We identified the 4170-75 resistance level yesterday, a key resistance point we've emphasized in the past two days. If this level continues to act as resistance today, the downward momentum may persist. This morning, gold saw a slight pullback to around 4140 before consolidating in a narrow range. This morning's pullback is likely a tentative move; we will continue to monitor the resistance level to see how much further it may fall.
Looking at the four-hour chart, the triangle consolidation pattern for gold remains unchanged. The downward trendline resistance is at 4173-75. Only a decisive break above this trendline will allow for further upward movement and a new opportunity. Otherwise, it will remain in consolidation at the end of the consolidation phase. On the one-hour chart, the price has started to break below the short-term support zone and is now under pressure from the short-term moving averages. There may be some room for adjustment in the short term; we will monitor the short-term correction. Today, continue to focus on the resistance level of the upper trendline of the triangle pattern, which is also the watershed between bulls and bears. If the resistance holds, expect a pullback. Therefore, we still need to try to establish short positions today. If there is a rebound to around 4168-73, we can short. In summary, the short-term trading strategy for gold today is to focus on selling on rallies. The key resistance level to watch in the short term is 4173-4175, and the key support level is 4110-4100. Please keep up with the pace.

Selena | XAUUSD – 4H | Bullish Continuation Setup 4400$ WaitingFOREXCOM:XAUUSD
Gold continues to build bullish structure after forming accumulation in the previous range zone. The market broke out, retested demand, and maintained higher-lows inside the ascending channel. Current pullback into the Entry Zone (4122–4140) aligns with channel support + demand, suggesting potential continuation toward the upper boundary and major resistance around 4380–4410.
Key Scenarios
✅ Bullish Case 🚀
Hold above demand zone + channel support:
🎯 Target 1: 4320
🎯 Target 2: 4380
🎯 Target 3: 4410 (final top channel line)
Trigger: bullish rejection or bullish engulfing from 4122–4140.
❌ Bearish Case 📉 (Invalidation)
Break and 4H close below 4052 (Invalid zone):
🎯 Downside Target: 3990 → 3920 strong support
Current Levels to Watch
Resistance 🔴: 4320 / 4380 / 4410
Support 🟢: 4140 / 4122 (Entry Zone)
Invalidation: 4052
⚠️ Disclaimer: This analysis is for educational purposes only. Not financial advice.

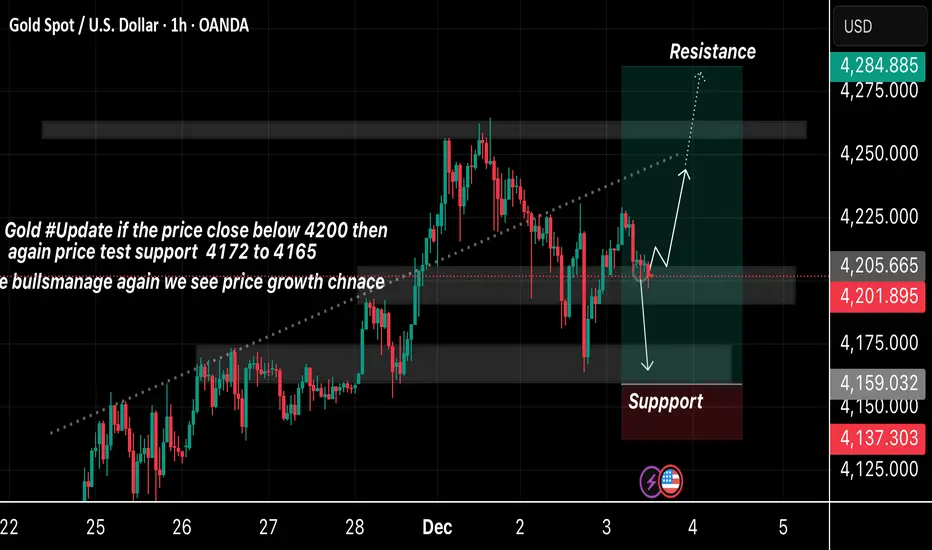
Gold Price Update – Clean & Clear ExplanationGold the market is trading around the 4200 zone, which is an important level.
✅ If the price closes below 4200, it may fall toward the support area between 4172 and 4165.
✅ This zone is highlighted as a strong support, where buyers have previously stepped in
✅ If the support holds and buyers regain control, the price may bounce upward again, giving a new chance for bullish growth
✅ On the upside, the next major resistance area is marked near 4242–4284 where the price could face selling pressure.
Overall, the chart outlines both possible scenarios a drop toward support if 4200 breaks, or a bullish move toward resistance if buyers maintain strength.
If you find it helpful please like and comments for this post and share thanks.
Selena | XAUUSD 2H — Bullish Continuation SetupFOREXCOM:XAUUSD
Market Overview
Price has built liquidity through multiple sweeps and consolidations, suggesting a possible continuation phase. If price retests the demand zone and holds, buyers may step in to push toward upper structure resistance levels.
Key Scenarios
✅ Bullish Case 🚀
If price holds above 4,157 zone
→ 🎯 Target 1: 4,300
→ 🎯 Target 2: 4,375–4,400 (major resistance / channel top)
❌ Bearish Case 📉
Break and close below 4,052 invalidation zone
→ 🎯 Downside Target: 4,000–3,950 support range
Current Levels to Watch
Resistance 🔴: 4,300 | 4,375–4,400
Support 🟢: 4,157 | 4,122 (demand zone)
Invalidation ⚠️: 4,052
⚠️ Disclaimer: This analysis is for educational purposes only — not financial advice.
