Strong bullish movement leading up to the inducement area.Analysis & Key Zones:
1. Inducement High & Bearish Zone:
• The top level is marked as the “zone for Bearish” around 4256.45.
• This is where price might reverse or face selling pressure.
2. Inducement Low & Bullish Zone:
• The bottom level is marked as the “zone for Bullish” around 4206.78.
• This is where buying interest may appear.
3. Inducement Concept:
• The chart highlights a short-term push (inducement) to trap traders.
• The note says: “As long as this inducement doesn’t take the low’s liquidity and doesn’t make a new high, we will wait. Once it takes the liquidity, then we will buy from its low.”
• This indicates a liquidity-based trading strategy, waiting for price to sweep lows before entering a bullish trade.
Trend:
• Potential for either continuation (if liquidity is taken) or a bearish reversal near the top zone.
Overall Summary:
This chart shows a liquidity sweep strategy where traders monitor inducement highs/lows to determine optimal entries. The key action points are:
• Buy from the low after liquidity sweep.
• Watch the top zone for potential bearish reversal.
Trade ideas

Gold 30M – Liquidity Grab and Bullish Continuation SETUPChart Analysis (Gold – 30m)
Trend Structure:
Price is currently in a corrective down-move inside a rising channel, but overall structure still respects higher-timeframe bullish momentum.
🔵 Key Zones
Bullish POI (Demand Zone): Lower blue zone – strong reaction point from previous impulsive move.
Bullish Order Block: Upper blue zone – price is retesting this area for liquidity collection.
📈 Indicators Used
EMA 70 & EMA 200:
Price is oscillating between both EMAs.
EMA 70 above EMA 200 → bullish bias still intact.
Liquidity Sweep:
Wick rejections below structure indicate liquidity grab before bullish reaction.
📌 Market Behavior
Price is expected to dip into POI to collect liquidity.
From POI, a bullish reversal is projected toward target zone 4,264.57.
🎯 Target
4,264.57 (Highlighted target level; aligns with channel top + liquidity zone)
📊 Summary Signal
Price likely retraces into the Bullish POI, then forms a strong bullish impulse toward the target. CME_MINI:MNQ1! CME_MINI:MES1! CME_MINI:ES1! NYMEX:CL1! COMEX_MINI:MGC1! CME_MINI:NQ1! NSE:BANKNIFTY1! CBOT_MINI:YM1! COMEX:SI1!

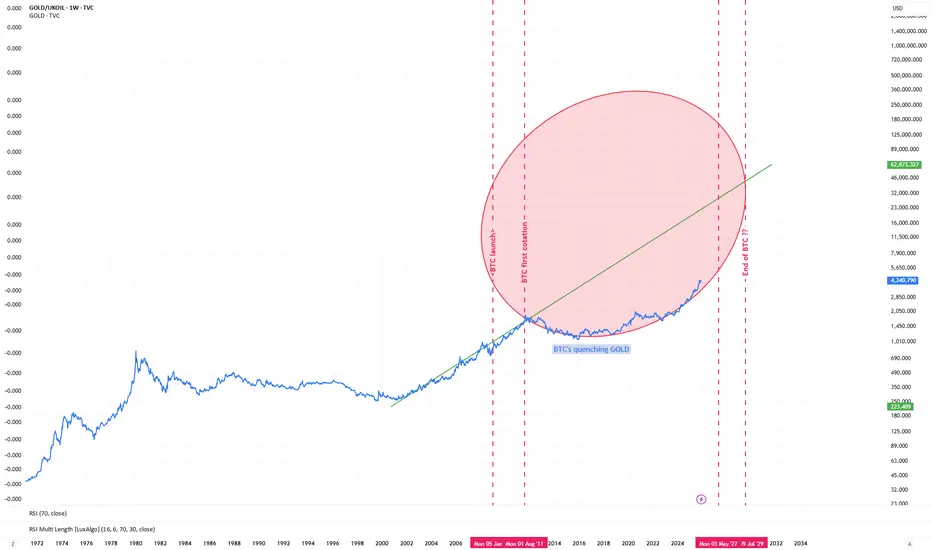
BTC has been lauched just to quench GOLD. After years of fight, GOLD finally won a few months ago.
Paper gold/silver and (real) privacy cryptos are going to pop the banking system.
Gold 4H Outlook – Trendline Structure AnalysisGold is testing a key confluence area where the descending red trendline (bearish structure) intersects with the ascending green trendline (short-term support).
Despite the recent push higher, price action still shows rejection wicks near 4,220–4,230, indicating exhaustion and a possible return toward structural support.
As long as gold remains below the red trendline, bearish pressure remains active. A clean rejection here may trigger a short-term pullback toward the 4,160–4,150 region, followed by a deeper retest of the horizontal support around 4,128 — a major liquidity zone that aligns with the trendline intersection.
A confirmed candle close above the red trendline invalidates this scenario and reopens the path toward 4,253.
Structure Summary:
Below red trendline → bearish reaction likely
First target zone → 4,160–4,150
Major support / key test → 4,128
Break & close above red trendline → bullish continuation
This scenario remains valid as long as price respects the red trendline.
— Avo.Trades

Gold completes its corrective phase and heads toward $4,250OANDA:XAUUSD is moving within a remarkably well-structured ascending channel, and the overall market structure clearly highlights the strength of the buying momentum. Each swing produces higher highs and higher lows, confirming that the bullish dynamic remains intact despite a few natural pauses along the way. The recent pullback looks more like a healthy technical breather than a sign of weakness, often the kind of pause that sets the stage for a new upward acceleration.
The price is now approaching a key support zone, where the lower boundary of the channel aligns with a previously proven demand area. If the market reacts here, buyers could find a highly favorable re-entry opportunity that aligns perfectly with both the channel structure and the logic of the current trend. In that scenario, the natural upside target is around 4,250 dollars, a level that combines the channel’s midline with a historical resistance, giving even more weight to this objective.
The bullish outlook remains valid as long as the price holds above the support zone and the ascending trendline. A decisive break below these levels would redefine the market context and open the door to a deeper correction, but for now, market conditions continue to favor long positions.
Stay disciplined in your market reading, validate your setups carefully, and protect your capital with strict risk management. Good luck.

XAU/USD (Gold/US Dollar) 15-Minute Technical Analysis.This chart displays the trading activity for the XAU/USD (Gold Spot/US Dollar) pair on the 15-minute interval, focusing on the movement around the start of December 1, 2025.
Key Pattern: The chart shows a clear Uptrend, indicated by the dashed green trendline running diagonally up across the price action.
Support and Resistance: Significant Support lines (red horizontal lines) are marked at the $4,210 and $4,170 levels, emerging from previous consolidation zones. The current high resistance is near $4,260 (top green horizontal line).
Potential Future Movement: The price recently peaked near the $4,250 - $4,260 level. The blue arrows illustrate two potential Bullish Continuation scenarios: either a direct breakout from the current level or a slight retracement towards the recent support before pushing higher, targeting new highs.
Volume: The increased volume (shown as bars at the bottom) confirms the buying pressure (green volume bars coinciding with bullish candles), particularly after 12:00 UTC.
Conclusion: The technical analysis suggests a strong Bullish Sentiment, with traders looking for a breakout above the recent high.

GOLD 1H GOLD 1H
A structured approach to market analysis combining Fibonacci retracement levels with key Support & Resistance zones.
Price action is monitored to identify reaction points, liquidity zones, and potential reversal or continuation setups.
The analysis focuses on high-probability confluence areas where Fibonacci ratios align with historical structure levels, helping traders spot optimal entry points, stop-loss zones, and profit-taking targets.

xauusdGold (XAUUSD) often reacts strongly at major tops and bottoms, especially when political tensions increase. At the current price levels, the market is waiting for potential political catalysts. With rising global uncertainty, the situation between Trump and Maduro could create a new wave of volatility. The question is: Are we standing at the beginning of another major market event? I will be monitoring price action closely for any strong reaction or reversal signal at this zone.

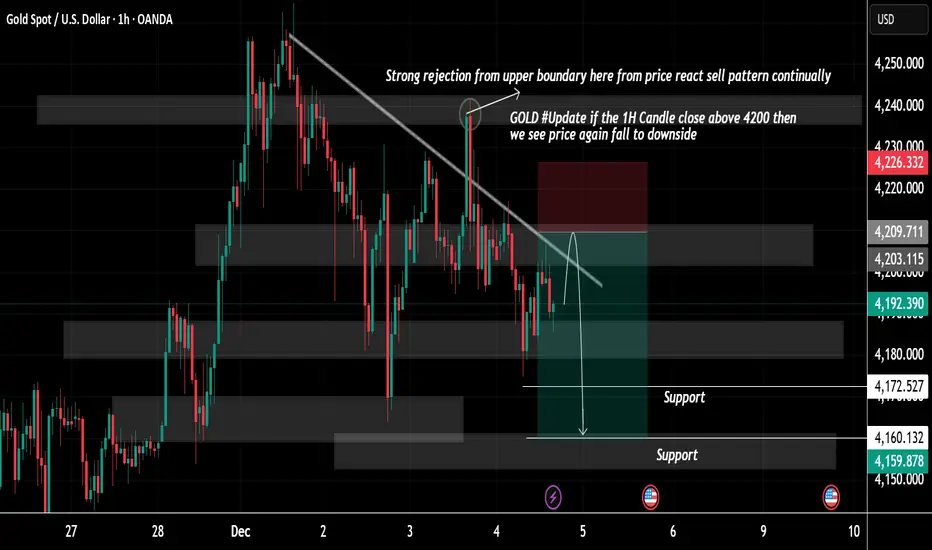
GOLD Price Update Clean and clear ExplanationGold price action on the 1-hour timeframe. The analysis highlights how price has been reacting to a key descending trendline and important support/resistance zones.
1️⃣ Downtrend Structure & Trendline Rejection
The chart shows a clearly defined descending trendline drawn from previous highs.
Every time the price has approached this upper boundary, it has shown strong rejection, confirming continuous selling pressure you highlighted one major rejection point where the price tried to push above the trendline but was aggressively pushed back down. This reinforces the idea that sellers are still respecting this trendline and defending it consistently.
2️⃣ Current Market Behaviour
Price is currently trading just below this trendline chart indicates that unless the 1H candle closes above the 4200 zone, the market is likely to resume its downward movement this suggests a bearish structure remains intact as long as price stays under the 4200 resistance level.
3️⃣ Key Support Zones
Two major support areas are marked:
• First Support Zone around 4172
• Second Support Zone near 4160
These areas are likely to act as targets if the price continues to fall, offering potential take-profit levels for sellers. They also represent regions where buyers might step in, so traders will be watching how price reacts there.
4️⃣ Trade Concept Illustrated
You have visually outlined a short (sell) trade idea:
• Price is expected to retest the descending trendline.
• If the rejection continues, price is projected to drop downward toward the lower support zones.
• The green zone represents the potential profit area, while the red zone shows the risk if price breaks above resistance.
This visually communicates a trend continuation setup, where traders follow the prevailing downtrend instead of counter-trading.
5️⃣ Overall Interpretation
Your chart analysis suggests:
• Gold is still respecting the downtrend.
• Sellers are active around the trendline.
• Continued bearish movement is expected unless price breaks above the 4200 level with a strong candle close.
• The support zones below provide clear levels where price may slow down or reverse.
If you Find it helpful please and comments for this post and share thanks.
Bullish Breakout & Golden Zone Reversal AnalysisChart Analysis (Gold – 15m)
1. Trend Structure
Price has been moving inside a descending channel, showing short-term bearish pressure.
Now price is attempting a breakout from the channel, signaling a potential bullish reversal.
2. Key Support Zones (Demand Areas)
4,187.08 → First support where buyers reacted.
4,178.10 → Deep liquidity zone (strong demand).
These levels align with Fibonacci retracement clusters:
0.618 (4,186.98)
0.705 (4,184.22)
0.79 (4,181.51)
This confirms a high-probability reversal zone.
3. Fibonacci Strategy
Price touched the 0.618–0.79 golden pocket and bounced.
This supports a long setup targeting the 1:1 impulse projection.
4. Moving Averages (EMA Strategy)
EMA 70 and EMA 200 are above price during correction.
A breakout + retest above EMAs would confirm further bullish momentum.
5. Breakout Strategy
A clear breakout above the descending channel suggests the beginning of a new bullish leg.
6. Target Projection
The measured move indicates:
Target Point: 4,240.21
Expected gain: ≈ +1.25% (≈ 52.5 points)
7. Signal Summary
✔️ Support respected
✔️ Breakout forming
✔️ EMA alignment improving
✔️ Fibonacci golden zone bounce
✔️ Bullish target activated
📌 Final Signal
Bullish Bias (Long) above 4,187
🎯 Target: 4,240
🛡 Stop-loss: Below 4,178 CBOT_MINI:YM1! CME_MINI:MES1! CME_MINI:ES1! COMEX_MINI:MGC1! NSE:BANKNIFTY1! CME_MINI:NQ1! NSEIX:NIFTY1! NSE:NIFTY1! CME_MINI:MNQ1! NYMEX:CL1! COMEX:SI1!

Gold set to fire today Gold looking bullish on 60 min timeframe .
Forming big triangle and inside breakout out from falling wedge..
Levels to keep in mind
Breakout above 4197
Support 4175
Upside levels - 4220-4240-4260

Going Short On Gold After price wiped out everyone on the sell side, it went on to break the high of the day. From there, price dropped back into the same resistance zone, slipped below it, and formed a clear M-pattern (double top). It then retested the neckline perfectly, confirming the setup. With this structure in place, I’m expecting a strong sell-side move from here.

XAUUSD and EURUSD Analysis todayHello traders, this is a complete multiple timeframe analysis of this pair. We see could find significant trading opportunities as per analysis upon price action confirmation we may take this trade. Smash the like button if you find value in this analysis and drop a comment if you have any questions or let me know which pair to cover in my next analysis.

XAUUSD – Fibo H4 supports the upward trend, prioritize buying...XAUUSD – Fibo H4 supports the upward trend, prioritize buying at POC for next week
Gold closed Friday's session around 4,215 after a strong rise since the CME error report.
On the H4 chart, the upward structure is clearly forming and relatively stable, with the price just breaking out of a multi-day accumulation zone and entering Fibonacci extension levels. Given the current context, I continue to prioritize medium-term buying when the price adjusts to POC, rather than chasing at new highs.
🎯 Main trading plan – BUY THE DIP ACCORDING TO FIBONACCI & POC
Buy entry: around 4,187
SL: 4,175
TP reference: 4,225 – 4,240 – 4,290 – 4,300
The above profit-taking targets are referenced from the H4 Fibonacci extension cluster, with the area around 1.618 – 2.618 being levels where strong market profit-taking is likely to occur.
For each position, I only accept risk within the 1–2% account range, prioritizing long-term market survival over trying to catch the top and bottom of a wave.
Key level:
4,160 is currently a strong support and the "lifeline" of the H4 upward trend.
If the price breaks down and closes the H4 candle below 4,160, the current upward structure is considered broken, I will temporarily halt the BUY scenario and will rebuild the plan, possibly considering a deep correction SELL scenario in the next article.
1. Basic context
The recent strong recovery momentum of gold temporarily slowed down after an unsuccessful attempt to rise above the 4,160 area.
However, the recent upward momentum occurred in the context of the USD weakening again, despite US bond yields trying to recover across the curve.
On a larger timeframe, gold is heading for the fourth consecutive monthly increase, following the breakout in October when prices made the market look towards the 4,400 area.
Prolonged geopolitical concerns along with expectations that the Fed will continue to cut interest rates provide enough reasons for buyers to maintain a medium-term position, despite short-term fluctuations.
Overall, the fundamental foundation still supports the upward trend, unless there is a major change in interest rate expectations or systemic risk.
2. H4 Technical Analysis – Fibonacci Perspective
The previous accumulation area around 4,160–4,185 has been broken up by a series of consecutive bullish candles, confirming the higher high – higher low structure on H4.
The volume POC has shifted up around the 4,187 area, indicating this is a dense trading area before the breakout – suitable for waiting for a price retest and then continuing to buy.
Fibonacci extension levels from the most recent upward wave show important resistance clusters above around:
1.618: area 4.24x – first profit-taking target, likely to experience fluctuations.
2.618: area 4.35x–4.36x – expansion level for a very strong continuation trend scenario.
With this structure, any adjustment around 4,187 but holding 4,160 is considered an opportunity to increase the medium-term BUY position, not a reversal signal.
3. Market sentiment & action plan
After a strong rise, the market is in a FOMO mindset chasing prices at high levels. This is usually a stage where unexpected adjustments are likely to occur to "shake off" late positions.
I do not participate in that chasing game. Instead, I wait for the price to return to the POC area 4,187, where a large volume has accumulated, to trade with a better R:R and tighter SL.
If the buyers are truly strong, they will protect the 4,160–4,187 area; if not, observing from the sidelines after the structure is broken is safer than holding onto a viewpoint.
Plan for next week:
Prioritize buying around 4,187, SL 4,175, TP according to Fibo cluster 4,225–4,240–4,290–4,300.
If the price breaks strongly below 4,160 and closes the H4 candle below, stop the entire BUY scenario, wait for a new structure, and then consider a correction SELL scenario.
Do not chase buying when the price is close to high Fibo extension levels, unless there is a specific intraday setup with a very clear SL.
If you find this perspective useful for next week's gold trading plan, please follow the TradingView account and leave a comment about the price area you are waiting to enter orders. I always read feedback to optimize sharing in future analyses.

XAU/USD – Intraday AnalysisXAU/USD – Intraday Analysis: Sideways Structure and High-Probability Trade Levels
Gold continues to move inside a clear range-bound structure, respecting both the upper supply zone and the lower demand zone on the H1 timeframe. The chart shows repeated swing rejections at the top of the range, suggesting that buyers are losing momentum while liquidity continues to build above the equal highs.
The market is forming a harmonic zig-zag pattern with lower-timeframe exhaustion signals, and price remains below the 9-EMA, indicating short-term bearish pressure. Until price breaks out convincingly, intraday traders should continue focusing on trading the edges of the range.
Key Technical Levels
Resistance Zone (Sell Zone)
4235 – 4242
This zone has been tapped multiple times with strong rejection wicks.
Liquidity rests above the equal highs, making this area ideal for short setups if price sweeps liquidity and fails to break structure.
Support Zone (Buy Zone)
4168 – 4175
Strong reaction area where buyers defended the range low multiple times.
Watch for liquidity sweep followed by bullish reversal confirmation.
Technical Confluence
1. Trendline Reaction
Price is respecting the descending internal trendline, suggesting continuation of the bearish leg if 4205–4210 fails to break.
2. Fibonacci Confluence
The upper resistance aligns with 0.786 – 0.886 Fibonacci retracement of the previous downswing.
The lower support aligns with the 1.0 – 1.272 Fibonacci extension of the corrective leg.
3. EMA Structure
Price is trading below the 9-EMA, confirming the short-term bearish bias.
EMA acts as dynamic resistance inside the range.
4. RSI Behavior
RSI repeatedly rejects the 60–70 zone, indicating a weakening bullish attempt.
Neutral RSI at mid-range supports the sideways scenario.
Intraday Trading Strategy
Scenario 1 – Sell the Range High (High Probability)
Plan:
Wait for liquidity sweep above 4235–4242
Look for bearish engulfing or BOS (Break of Structure) on M15
Enter short targeting:
TP1: 4205
TP2: 4188
TP3: 4170 (range bottom)
This aligns with the projected pattern on the chart.
Scenario 2 – Buy the Range Low
Plan:
Wait for price to sweep 4168–4175
Enter only if bullish confirmation shows (pin bar, BOS, or bullish FVG fill)
Targets:
TP1: 4200
TP2: 4220
Scenario 3 – Bearish Breakout
If price rejects the upper zone and breaks below 4170, momentum may accelerate downward.
Targets below 4170:
4150
4135
Market Outlook
Gold continues to consolidate, and this phase typically leads to an explosive move. Until a breakout occurs, trading inside the range edges provides the best risk-to-reward setups.
If you find this analysis helpful, save it and follow for more daily strategies and updated market structure insights.

XAUUUSD AFTER BIG FALL TAKING SAME SUPPORTXAUUSD after big fall taking same support of weekly candle 4213
Entry on 4213
Stop reference 4192
Upside target point 4260
Running still bullish channel 4040 to 4264 so gold still on near to high point of weekly candle
this is not financial advice , Chart is for educational analysis only

“Gold Perfect Rejection → 61.8% Demand Bounce Setup (1:4.5+ R:R)XAU/USD – Quick Precision Setup Price rejected perfectly from the overhead supply (4200–4210 pink zone) and broke the range low as expected.
Now sitting exactly on the major weekly demand 4168–4188 (cyan) + 61.8% Fib of the entire leg up. Bias: Strong bounce expected
Entry zone: 4168 – 4185
Stop: 4158 (below demand)
Targets: 4200 ➜ 4220 ➜ 4250+
R:R = 1:4.5+ High-probability long setup active #XAUUSD #Gold #GoldTrading #ForexSignals #TechnicalAnalysis #SwingTrade #BuyGold #TradingView #Forex #Comex #XAU #BullishSetup #PriceAction #DayTrading #FYP

gold on best selling level we can short gold only below 4200 its perfect sell setup
for more conformation entry we can wait for fvg on small time frame for fine tune our entry level expected fall from the level next sell liquidity

Selena | XAUUSD 30M – Trend Support + Liquidity Hunt ScenarioFOREXCOM:XAUUSD OANDA:XAUUSD PEPPERSTONE:XAUUSD
4H candle chart thought
Structure remains bullish as long as the trendline + holding zones hold. Smart-money liquidity sits above previous highs — a break may initiate continuation to extended targets.
📈 Bullish Scenario (Primary Bias)
If price holds above 4,200 and reclaims the entry block:
🎯 TP1 – 4,240–4,245
🎯 TP2 – 4,258–4,260 (Buy-Side Liquidity)
🎯 Final Target – 4,270+
📉 Bearish Invalidations
Break & close below: 4,176
Stronger confirmed reversal below: 4,125
Current Levels To Watch
Resistance 🔴: 4,245 / 4,260 / 4,275
Support 🟢: 4,200 / 4,176 / 4,120
⚠️ Disclaimer: For educational purposes only — not financial advice.

Why Bearish? • 4H CRT rejection • Premium zone reaction 4H Timeframe:
Gold tapped into a clean 4H Bearish Order Block (OB) and showed a strong rejection wick from the premium zone. The previous bullish impulse got absorbed, and the latest candle has confirmed a Change of Character (ChoCH) on the higher timeframe.
This indicates that the upside may be capped and sellers are entering the market from a higher timeframe supply.
5M Timeframe Confirmation:
On the 5-minute chart, price reacted precisely inside the intraday OB.
We can clearly see:
• Liquidity sweep above the short-term high
• A small consolidation
• Followed by a strong bearish displacement candle
This confirms intraday bearish flow and aligns perfectly with the 4H structure.
Key Levels:
• 4H OB Zone: 4218 – 4224
• Intraday Sell Trigger: 4215
• Targets:
→ 4208
→ 4201
→ 4194
→ 4188 (major liquidity pool
Why Bearish?
• 4H Order Block rejection
• Premium zone reaction
• 5M OB + displacement
• BOS on lower timeframe
• HTF + LTF confluence

XAU/USD – Long on pullback in structural uptrendW1 uptrend very strong, dovish Fed, clear D1 supports; estimated WR ~60%, R:R ≈ 2:1
Direction: Long
Time Horizon: 3–8 weeks
Setup Type (Scenario): Return to key support + trend continuation
Main Motivation (Macro/Fundamental)
Gold near all-time highs, ~+60% Y/Y, with 2025–26 targets from various investment banks revised upwards (4,500–5,000 area).
Implied probabilities of a Fed rate cut in December >80% compress US real yields and weaken the dollar → structurally bullish context for gold.
Relatively more "hawkish" ECB (on hold) and widespread geopolitical risks maintain demand for safe-haven assets.
Technical (D1/W1 + H4)
W1 Trend: clean upward channel, higher highs/higher lows; 4,000 has become psychological support.
D1: breakout and hold above old resistance at ~4,180; the 4,120–4,180 area has acted several times as a consolidation/buffer zone.
Next resistance in the 4,350–4,380 area (52W peak 4,381).
Operational Setup (indicative prices)
Entry Detail
Entry Setup (H4) Wait for a return to 4,180–4,120 $/oz. Ideal entry ~4,170 after a bullish reaction H4 candle (pin/engulfing) that closes back above 4,180.
Stop Loss (SL) 4,030 $/oz, below the cluster of recent lows and below the "4,050–4,060" threshold: if the price closes D1 below there, short-term structure broken.
Take Profit 1 (TP1) 4,450 $/oz, just below a realistic extension above recent highs (4,350–4,380) and below the psychological area of 4,500.
Risk/Reward Ratio (indicative)
Entry: 4,170
Risk: 4,170 – 4,030 = 140
Reward: 4,450 – 4,170 = 280
R:R ≈ 2.0 : 1
Operational Trigger (H4)
Setup valid only if:
XAU/USD enters 4,180–4,120;
Prints H4 rejection candle (long spike below, closing above 4,180);
In parallel, the DXY retreats and the probabilities of a Fed rate cut remain >80%.
Risk Validation (Otherwise)
Setup invalidated by a solid D1 close below 4,000 (full body, not just spike), which would open space for correction towards 3,700–3,800.
Disclaimer!!! The content of this article is for informational, educational, and entertainment purposes only. It does not constitute financial advice, investment advice, or a recommendation to buy or sell securities, cryptocurrencies, or other financial instruments. The author is not a professional financial advisor. Investing in the financial markets involves high risks, including the possible loss of all capital. Before making any investment decisions, you are strongly advised to do your own research (DYOR) and, if necessary, consult a qualified professional. The author assumes no liability for any loss or damage arising from the use of the information contained in this article.

XAUUSD ANALYSIS 📉 XAUUSD (GOLD) H1 ANALYSIS & LEVEL FORECAST 📈
Gold has been moving downward on the H1 timeframe, showing clear rejection from the 4220 resistance zone. Price is currently moving inside a parallel channel, respecting both upper and lower boundaries.
After completing its downward move toward the 4180 support level for a potential retracement, the structure suggests that buyers may step in.
🔑 Key Levels to Watch
Resistance: 4220 (strong rejection zone)
Support: 4180 (retracement zone)
Upside Targets:
🎯 4260
🎯 4265
📌 Technical Outlook
If price holds above 4180, a bullish bounce toward 4260/4265 becomes highly probable. Break below 4180 would invalidate the bullish setup.

GOLD (1H) – Bullish Continuation Above Support | Premium Market GOLD (1H) – Bullish Continuation Above Support | Premium Market Structure
Gold delivered a strong impulsive rally and is now holding elegantly above a clean support zone. Price behaviour suggests controlled accumulation, with buyers defending structure after the expansion.
Key Zones
Support Zone 1: 4210–4220
Support Zone 2: 4175–4185
Resistance: 4335–4340
Market Structure
The current retracement remains shallow, maintaining higher-low structure. Price has reacted exactly at the first support zone, signalling strength. A sustained break above 4240 may open room for a continuation into the 4330+ resistance band.
Bias
📈 Bullish as long as 4210 holds.
Liquidity is still intact and orderflow favours another leg higher.
Potential Setup (Not Financial Advice)
Entry Zone: 4215–4230
Targets: 4310 / 4335
Invalidation: Below 4175
Summary
Gold retains a premium bullish structure. Support is respected, liquidity protected, and continuation potential remains high unless deeper displacement occurs.
Disclaimer: Educational analysis only.
