Gold. October 26-31, 2025🟡 Technical Analysis
Gold maintains an overall bullish structure, although it is currently undergoing an active correction from the highs around 4,380–4,400 USD.
The general pattern suggests a consolidation phase resembling a flag or triangle, with a clear formation of higher lows.
Key technical levels:
• Major support between 4,050 and 4,000 USD, where institutional demand may concentrate.
• Immediate resistance between 4,160 and 4,200 USD, which has capped several breakout attempts.
• On the 1-hour chart, lateral volatility can be observed between 4,080 and 4,150 USD — typical of a pre-breakout stage.
• On the 15-minute chart, long lower wicks indicate selling absorption at support zones.
👉 In summary: Gold is in a reaccumulation phase after the correction, and a breakout with volume above 4,160 USD would confirm bullish continuation.
⸻
🧭 Fundamental Analysis
1. Monetary Policy (Fed):
The Federal Reserve maintains high interest rates, but the latest inflation data (CPI and PPI) came in lower, reinforcing expectations of a rate cut by December or January. This weakens the dollar and supports gold.
2. Domestic Policy:
The federal shutdown risk and lack of budget consensus in Congress create uncertainty, driving investors toward safe-haven assets like gold.
3. Geopolitics:
Ongoing tensions in the Middle East and trade talks between China and the U.S. sustain demand for safe havens.
4. Upcoming Data:
The PCE index will be the week’s main catalyst, along with Powell’s statements and GDP revisions.
⸻
📈 Probable Scenarios
Scenario 1 – Moderate Bullish
Gold holds support between 4,050 and 4,080 USD and manages to break the 4,160–4,200 USD resistance with strength and volume.
Upside targets: 4,250–4,300 USD initially, with potential extension toward 4,350–4,400 USD.
This scenario would be favored by weak dollar data, rate-cut expectations, or political progress reducing shutdown risk.
⸻
Scenario 2 – Corrective Bearish
If gold fails to hold above 4,050 USD and drops below 4,000 USD, a technical correction could activate toward 3,950–3,850 USD.
This move is more likely if PCE prints higher, the Fed maintains a hawkish tone, or the DXY strengthens.
⸻
Scenario 3 – Sideways
Price remains within the 4,080–4,160 USD range without clear direction, awaiting the PCE release.
This reflects a typical indecision phase before a key macroeconomic event.
⸻
🎯 Recommended Technical Levels
Bullish scenario:
• Ideal buy zones: 4,050–4,080 USD
• Targets: 4,250 USD (TP1), 4,300 USD (TP2), 4,400 USD (TP3)
• Suggested stop loss: 3,980 USD
• A close below 3,980 would confirm bearish reversal.
Bearish scenario:
• Ideal sell zones: 4,160–4,180 USD
• Targets: 4,000 USD (TP1), 3,950 USD (TP2)
• Stop loss: 4,220 USD, invalidating the setup if price breaks above 4,200 USD.
Sideways scenario:
• Buy near support (4,050 USD) and sell near resistance (4,160 USD), aiming for 40–60 USD range profits.
• Stop loss: ~30 USD outside the range.
• Reversal confirmation if price breaks beyond range limits.
⸻
📋 Final Summary
• The primary trend in gold remains bullish as long as price holds above 4,000 USD.
• Key catalysts this week: the federal shutdown situation, PCE data, Powell’s remarks, and geopolitical tensions.
• General recommendation: look for buy setups on pullbacks to support zones, apply active risk management, and take partial profits at resistance levels.
Trade ideas

XAUUSD- Amazing low risk high reward trade!Based on our deep analysis we can see that XAU/USD (gold) will head to the upside. Great time to BUY - it has broken all major resistance levels and has nowhere else to go except upwards. It is also struggling to break past powerful support levels.

Double Fakeout on GoldHi traders and investors!
This analysis is based on the Initiative Analysis (IA) concept.
Gold has corrected by 6.5% from its peak and so far shows no signs of recovery.
On the 1-hour timeframe, the market is in a sideways range.
First, there was a false breakout below the lower boundary, and then a false breakout above the upper boundary of the range.
Now the seller has broken through the lower boundary of the sideways range, and the price has dropped below the 50% level of the daily buyer initiative.
At the base of the last buyer initiative on the daily timeframe, there is a buyer zone between 4058 and 3944 — a good area to look for potential trade setups.
Wishing you profitable trades!

XAUUSD M30 23Okt2025Analysis:
The structure still shows lower highs and lower lows, meaning momentum remains bearish.
The previous resistance area lies between 4,120–4,175, likely zone for sellers to re-enter.
Wait for price to reach 4,120–4,150 area.
Look for a bearish engulfing or pin-bar rejection on M30.
Enter short near rejection confirmation.
Place SL above 4,180.
Secure partial profits near 4,060 (TP1) and let rest run toward 4,000 (TP2).


Gold the safe haven Good morning fams, Gold is showing some sign of not going down further in the triangle respecting the trend line hopeful if it doesn't break and stay below 4055 we may see more bullish movements back to 4158 - 4160 but if it breaks 3954 is the next target... let keep observing as will sit on our and wait patiently ( Remember the market takes from the inpatient and give to the patient.)

XAUUSD focuses on the insidebar breakthrough directionOn the daily chart, XAUUSD closed with an inside bar yesterday. Short-term focus is on the breakout direction. Currently, support is focused around 4066. A break below will test support near 4004, and further declines will target the 3820-3900 area. If the price breaks through resistance near 4162, an upward move will begin, with the upside target at 4245-4300. For now, it's advisable to patiently wait for market signals before making any moves.

Gold Analysis and Trading Strategy | October 22-23✅ Gold Analysis from 4-Hour Chart:
Gold reached a high of 4381.40, then pulled back and broke through several support levels, forming a downtrend. The current price is near 4050, which is a key support zone. If gold remains around this level, a rebound may occur.
Moving Averages: MA5 has crossed below MA10, and both MA20 and MA50 show a downtrend, indicating that gold may continue to pull back in the short term. The price is between MA20 and MA50. If gold continues to decline and breaks below the 4050 support, it may further test 4004.38 or 3945 support zones.
✅ Gold Analysis from 1-Hour Chart:
After forming a double-top pattern, gold quickly pulled back, signaling that gold has entered a correction phase. Currently, gold is oscillating near the support zone, and if the support holds, a rebound could happen.
The price is near the middle band of the Bollinger Bands at 4082.44 and close to the lower band at 3998, suggesting that gold is in a consolidation range and has not broken through key support or resistance levels. If gold breaks below the lower band, it may continue to decline.
🔴 Resistance Levels: 4072 / 4094 / 4117
🟢 Support Levels: 4050 / 4004 / 3995
✅ Trading Strategy Reference:
🔰 If gold fails to break 4072 and falls below 4052, consider going short, targeting 4004-3995.
🔰 If gold breaks 4072 and holds above it, consider going long, targeting 4094-4117.
🌐 Gold is currently consolidating in the support zone. If the 4050 support holds, a rebound may occur. However, if the support breaks, it may continue to decline to lower support zones. Monitor the breakout of resistance levels and adjust your strategy accordingly.

Gold Price Analysis – October 21, 2025Gold Price Analysis – October 21, 2025 | Key Zones & Potential Reversal Setup
Gold (XAU/USD) remains in a dominant bullish trend but is currently undergoing a corrective phase within its uptrend channel. On the H1 timeframe, the market has recently formed a double-bottom pattern, signaling potential exhaustion from sellers and a possible short-term reversal.
Technical Overview
Trend Direction: Bullish (still above the long-term ascending trendline)
Immediate Support Zone: 4,260 – 4,270
Demand Zone: 4,185 – 4,200 (confluence with previous base structure)
Resistance Levels: 4,300 – 4,320 and 4,340 – 4,360
Market Context: After a sharp correction from the recent high, gold is now retesting a key support area where a bounce could trigger a new bullish leg.
Pattern Insight
The “W” reversal structure (double bottom) on the chart suggests that buying pressure may be returning. A confirmed breakout above 4,304 could validate a bullish continuation, targeting the 4,340 – 4,360 region.
Trading Plan
Primary Scenario – Buy on Confirmation:
Wait for price to reclaim 4,300–4,304 with bullish candle confirmation.
Entry: 4,304
Target: 4,340 → 4,360
Stop Loss: Below 4,185
Alternative Scenario – Deeper Pullback:
If price fails to hold 4,260, a deeper retracement toward 4,185 could occur before the next impulse wave resumes.
Outlook
Overall momentum remains bullish as long as gold stays above the long-term trendline. The correction phase could soon give way to another upward expansion, provided the market maintains structure above 4,185.
Stay alert for confirmation signals before entering new long positions.
Follow for more daily gold insights and high-probability setups.

xauusd long to sweep liquidity above previous sessionslooking for a long off of this 15 minute fvg up into the 4 hour bearish area sweeping liquidity if it does that a further refinement of price movement will be made at that point


XAUUSD-GOLD 1H Chart—SELL Setup with 3 Profit TargetsHello Guys,
Here’s my 1-hour XAUUSD-GOLD analysis for you.
These are the exact SELL levels I’ll be watching:
🔵SELL level: 4285.9
🔴 Stop level:4335.3 (or adjust based on your own margin)
🟢 TP1: 4264.8
🟢 TP2: 4232.1
🟢 TP3: 4185.0
Risk-to-reward ratio on this setup: 2.05
If XAUUSD-GOLD reaches these levels, I’ll definitely take a SELL position.
Every like is my biggest motivation to keep sharing these analyses.
Thanks to everyone supporting me!

Gold Bulls Still in ControlTVC:GOLD price recently swept the previous swing high around the $4,380 level, triggering a rejection as buy-side liquidity was taken. After this liquidity grab, the market attempted to extend its upward momentum but failed to break decisively above that level, resulting in the formation of a bearish order block between $4,367 and $4,372. This area has since acted as a short-term supply zone, driving price lower and guiding it back toward the bullish order block at $4,341 – $4,346 highlighted in green.
Upon retesting this demand zone, gold swept the sell-side liquidity resting beneath recent lows; however, the candle body managed to close above the zone, implying that bullish pressure remains intact despite the temporary downward movement. This reaction suggests that institutional participants may still be defending long positions within this zone, potentially accumulating orders before initiating the next upward leg.
Considering this overall market structure, price action continues to favour a bullish outlook. If the green order block holds as support, there is a strong likelihood of another impulsive move to the upside, targeting liquidity above the $4,380 – $4,400 region.

GOLD USDHI GUYS,
We are in London session sells to price action pattern H1, H2 TAKE profit will be 4087.117

GOLD (XAU/USD): Bullish Move from SupportIt appears that there is a possibility of a continued bullish movement on 📈GOLD price, potentially originating from an underlined blue support cluster.
Furthermore, a brief liquidity sweep below that level, followed by a bullish breakout above a minor resistance on an hourly timeframe, seems to be observed.
The anticipated target for this bullish movement is 4300.

Gold - The most obvious top!🪙Gold ( TVC:GOLD ) will reverse soon:
🔎Analysis summary:
After we witnessed a major breakout back in 2024, Gold has been rallying about +120% ever since. However, Gold is now approaching a monster resistance trendline of the long term rising channel. It is really just a matter of time until Gold will create its official top.
📝Levels to watch:
$4,500
SwingTraderPhil
SwingTrading.Simplified. | Investing.Simplified. | #LONGTERMVISION

Gold weekly chart with both buy and sell entriesLast week both buy and sell levels hit for over 1000 pips each.
This will probably be my last chart for awhile as i dont think theres much intrest in this
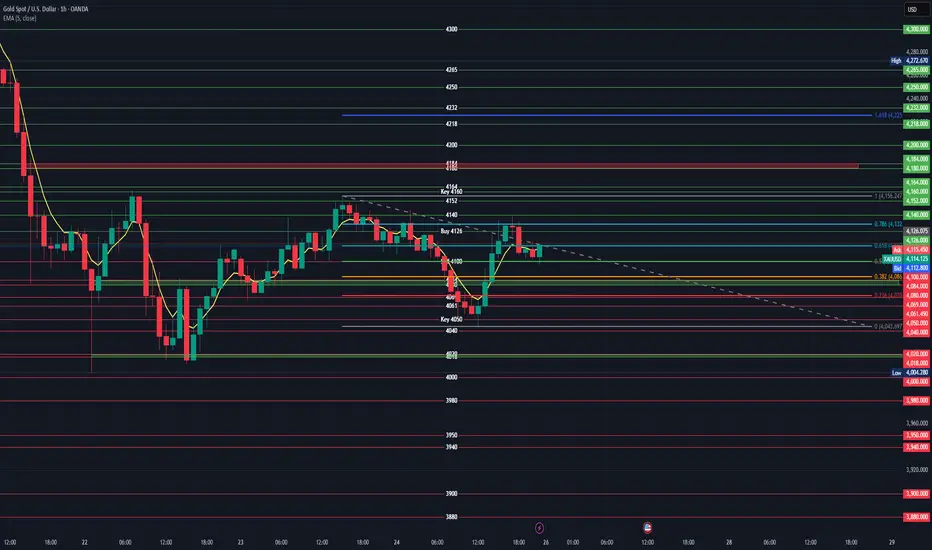
### XAUUSD 4-Hour Chart Analysis
#### **Key Levels Identified**
The chart shows critical **support/resistance zones** based on Fibonacci retracements, historical price action, and labeled key levels. Below is a breakdown of actionable buy/sell levels:
---
### **1. Buy Levels (Long Entry)**
These levels represent potential support where price may reverse upward:
- **Primary Buy Zone**: `4,126` (labeled "Buy 4126" on the chart)
- **Why?** This level aligns with the **0.236 Fibonacci retracement** of the recent swing high (4,164) to swing low (4,004). Historically, price has bounced here.
- **Entry Trigger**: Wait for bullish reversal signals (e.g., bullish engulfing candle, RSI divergence, or price closing above the 5-period EMA).
- **Stop Loss**: `4,095` (below the "Sell 4100" resistance level).
- **Take Profit**: Target `4,160` (Key 4160 resistance), then `4,180` and `4,184`.
- **Secondary Buy Zone**: `4,110–4,115` (near the 0.618 Fibonacci retracement at `4,113.253`)
- **Why?** The price is consolidating here after a dip. A hold above `4,100` (Sell 4100 level) suggests bullish momentum.
- **Stop Loss**: `4,095` (as above).
- **Take Profit**: Same as primary zone (`4,160` and beyond).
---
### **2. Sell Levels (Short Entry)**
These levels represent potential resistance where price may reverse downward:
- **Primary Sell Zone**: `4,132` (0.786 Fibonacci retracement of the swing high/low)
- **Why?** This level is a strong resistance zone where the price often reverses after a rally.
- **Entry Trigger**: Wait for bearish reversal signals (e.g., bearish pin bar, RSI divergence, or price rejecting the level).
- **Stop Loss**: `4,135` (above the resistance level).
- **Take Profit**: Target `4,099` (0.5 Fib), then `4,086` (0.382 Fib), and `4,050` (Key 4050 support).
- **Secondary Sell Zone**: `4,160` (labeled "Key 4160")
- **Why?** This is the **major swing high** (4,164) and a key psychological resistance level. A rejection here confirms a bearish trend.
- **Entry Trigger**: Price must break above `4,160` and then fail to hold (e.g., a bearish candlestick pattern at the level).
- **Stop Loss**: `4,165` (above the resistance level).
- **Take Profit**: Same as primary sell zone (`4,099` and below).
---
### **Critical Context**
- **Current Price**: `4,111.797` (EMA 5 close). This is **above support (`4,100`)** and **below resistance (`4,132`)**.
- **Trend**: Short-term downward momentum after the 4,164 high, but price is recovering from a low. Wait for confirmation of reversal.
- **Fibonacci Retracement**:
- `0.786` (4,132) and `0.618` (4,113) act as key resistance/support.
- `0.5` (4,099) and `0.382` (4,086) are stronger support levels.
- **Risk Management**:
- Always use a stop loss to limit downside risk.
- Target levels should align with the broader trend (e.g., if the trend is bearish, prioritize sell setups).
---
### **Summary of Actionable Levels**
| **Trade Type** | **Entry Level** | **Stop Loss** | **Take Profit** | **Confirmation Signal** |
|----------------|-----------------|---------------|-----------------|-------------------------|
| **Buy** | 4,126 (primary)4,110–4,115 (secondary) | 4,095 | 4,160 → 4,180 → 4,184 | Bullish reversal candle, RSI divergence |
| **Sell** | 4,132 (primary)4,160 (secondary) | 4,135 → 4,165 | 4,099 → 4,086 → 4,050 | Bearish reversal candle, RSI divergence |
> **Note**: Always validate entries with additional indicators (e.g., RSI, volume) and avoid trading during low-volume periods. The 4-hour timeframe favors medium-term trades (1–3 days), so patience is key.
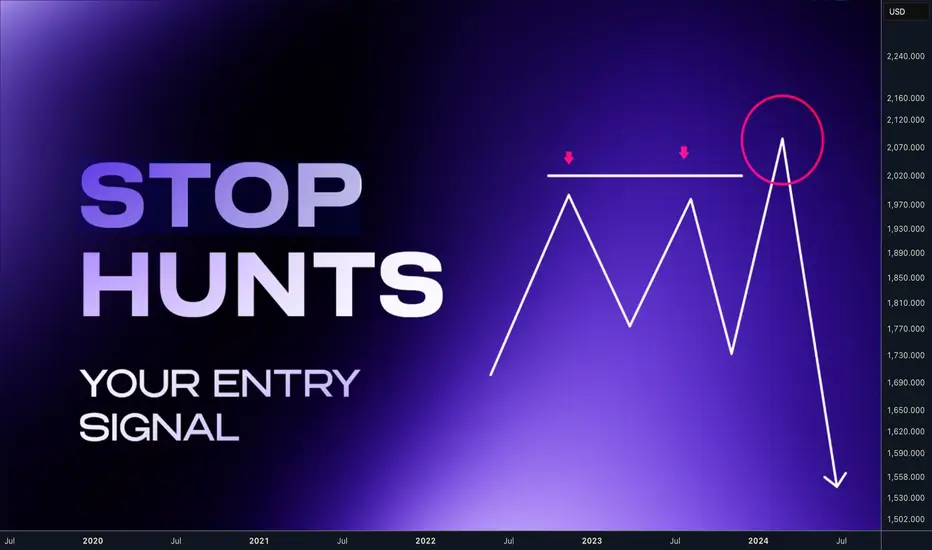
The Art of the Stop Hunt Trading. Hey traders In this post, you’ll learn how to the liquidity is engendered and how to avoid being stop hunted and actually use stop hunts to your advantage
📌If you placing your stop loss below the level before it was visited to grab the liquidity, you will become the liquidity. In the fact market makers doesn't care about your or mine stop loss, its too small money. But they come there because they have to in order to move the market. 📌 Every trader has seen it happen: you take a position at the “obvious” level, only to get stopped out by a quick wick — and then the market runs exactly where you expected. That wasn’t bad luck. That was stop hunt in other words liquidity grab ‼️ Don't be a liquidity
Price doesn’t move randomly inside ranges. It hunts liquidity at the edges.
• Retail trap: Traders pile orders right at the Double top / bottoms and ranges
• Smart money: Hunt's double top / bottoms and ranges starting the move.
📌 Double Top / Double bottom
sometimes price leave this formation, sometime even triple top / Bottom. It's on purpose and its telling us price will go there again, Im using these as the targets. Traders still think that if price rejected somewhere for few times that its strong level and its safe to put stop loss above or below and thats the problem. As many traders thinks this way its create a huge stop loss cluster = Liquidity zone which is attractive for the market makers.
‼️ If you see a double top / bottom then never enter before price dip in to it. Not even when there is clear trend line break its trap. Wait , you will get much sharper and better risk reward trade. If a pivot level gets tapped multiple times, it's on purpose. Smart money are creating illusion of strong support / Resistance so they cant manipulate price above / bellow where they grab the liquidity and reverse the market.
🧪 Example 1 - Triple top stop hunt, if you enter before you would serve as liqudity 🧪 Example 2 - Triple top stop hunt, even if you are right with the direction, not eating for the stop hunt first will ruin your trade 🧪 Example 3 - Double top stop hunt - he was nice trend line break which attracted more sellers and as you can see they been right with the direction but setting your stop loss just right above double top is not working 🧪 Example 4 - market makers used triple top used to offload positions above this liquidity level. 💊 Les informed traders trades patterns like : Double bottom, Double top and they put the stop losses above the range - This creates a Liquidity cluster which smart money needs to execute their orders. They will come for it before the real move happen. 🧩 How to use this information for your advantage
train your eyes and focus on the double tops / bottoms thats where the liquidity mostly will be resting. Always wait for the stop hunt after that is your time enter the market. Im looking for the trades always after the stop hunt in other words range manipulation. Let's check few ideas bellow.
🧪 EURUSD - after double top liquidity manipulated Im targeting opposing double bottom liquidity. 🔗 Click the picture to see price action development 👇https://www.tradingview.com/chart/EURUSD/OI08qVGB-EURUSD-I-Weekly-Range-I-Manipulation-Time-for-pullback/ 🧪 DOLLAR - Weekly Range Low liquidity was taken - now targeting double top liquidity as easy target. 🔗 Click the picture to see price action development 👇 🧪 USDCHF - Double bottom liquidity taken, targeting opposing side 🔗 Click the picture to see price action development 👇https://www.tradingview.com/chart/USDCHF/2AbnD2TR-USDCHF-I-Daily-CLS-range-I-Key-Level-FVG-I-HTF-CLS/ 🧪 DOGE - Liquidity take and targeting opposing range. 🔗 Click the picture to see price action development This is happening over and over again across all assets
👉Once you see it you cant unsee it. Focus on the stop hunts and you will see the market structure differently. Not like higher highs, higher lows and vice versa but rather something like this.
📌 Uptrend
Price is in a bullish move and is consistently breaking abovehighs and rejecting below lows. (Sweeping liquidity) - heading to HTF liqudity 📌 Downtrend
Price is in a bearish move and is consistently breaking below lows and rejecting above highs.(Sweeping liquidity) - heading to HTF range liquidity whole new world will open for you. You will be entering only after stop hunts.
⭐ I have whole strategy build on that click the picture below for more inspiration and the most powerful thing is that price is fractal what you just learned in the post above is possible to scale down. So for example you analyze Monthly range manipulation and you have opposing target. Its target for the next few weeks until the price reaches the monthly target and if you scale down to Daily then you trade Daily ranges in the Monthly range sequence.
📌 Bullish LTF Range within HTF Range
Analyze HTF range and define models, then drop it to your TF and trade your ranges with the HTF range. Always follow the same process only on the LTF - Lower timeframe. 📌BearishLTF Range within HTF Range
Analyze HTF range and define models, then drop it to your TF and trade your ranges with the HTF range. Always follow the same process only on the LTF - Lower timeframe. Shift from being the exit liquidity to being the trader who patiently waits, confirms, and executes with precision.
🩸 Spot the Liquidity. 🩸 Wait for stop hunt. 🩸 Trade with intention.
Don't trust me and check this on your chart find the true.
David Perk aka Dave FX Hunter
Gold : good RR opportunity for shortClassic breakout pullback on H4. The price is currently at my entry area. If the next H4 candle closes as bearish, consider it as a confirmation to go down. trade safe.

How to Short Gold as a Stock Trader and Profit on the DropGold is at historically high levels due to several key factors
Geopolitical Tensions: Trade disputes, regional conflicts, and global uncertainty are pushing investors toward safe-haven assets like gold
Monetary Policy Expectations: Anticipated interest rate cuts reduce the opportunity cost of holding gold, making it more attractive compared to bonds or cash
Weakening U.S. Dollar: A softer dollar makes gold cheaper for international buyers, boosting demand
Central Bank and Institutional Demand: Many central banks are increasing gold reserves, and institutional investors are allocating more to gold as a hedge against economic instability
Market Sentiment and Speculation: Bullish sentiment and speculative positioning are adding upward pressure on prices
If these factors start to ease, such as trade tensions reducing (highly likely with the next Trump Tweet), interest rates staying the same or even rising (less likely), or the dollar strengthening (likely), gold could start to pull back and given how aggressive its run has been, it could be a significant pull back.
For investors looking to profit from declines, inverse gold ETFs provide a way to benefit when prices fall, offering a strategic tool for hedging or directional trading.
They are a MUCH riskier type of trade - especially leverage ETFs so please do your research beforehand and definitely do not invest any money you can't do without if it all goes horribly wrong and Gold does indeed continue to head up past $5k.
Crazy times - hence probably why Gold is doing so well.
Buyer / bear - beware :)

When Everyone Was Hyped, We Warned We called the bearish turn on gold right on time:
After we posted the analysis, gold printed one of its sharpest daily drops in years—momentum the market hadn’t seen in a long time. The core view stands: after brief, counter-trend bounces, the primary path remains down. Revisit the previous analysis; the expectation is continued downside after in-trend corrections.
---------------------------------------------------------------------------------------------
🚀 Who am I?
I'm Mahdi, a prop firm trader with 7+ years of experience in technical analysis, mainly focusing on Smart Money Concepts and Elliott Wave theory.
I specialize in delivering high-quality trading signals, market insights, and educational content tailored for serious traders and investors.
📊 My Tools: SMC, Elliott Wave, Fibonacci, Liquidity Grabs, Order Blocks
💼 Prop Challenge Passed: Yes | Funded Account: In Progress
🔗 Follow for consistent updates and trading insights.

The bottom of gold price is still under construction
News:
On Thursday (October 23rd), gold prices regained safe-haven support after a recent pullback, primarily driven by escalating geopolitical tensions and expectations of new US export restrictions.
Risk aversion reignited, while investors awaited Friday's US CPI data to assess the Federal Reserve's policy path. After hitting a record high of $4,381.21, gold prices recently came under short-term pressure, entering a technical correction.
Gold prices found renewed support this week amid heightened geopolitical uncertainty and rising US policy risks.
Specifically:
Gold daily chart: Yesterday, the price stabilized at the middle line, closing with a long lower shadow candlestick. This suggests the 4000 low has temporarily stabilized. Whether it effectively serves as the bottom of a short-term correction will require further confirmation.
On the 4-hour chart, gold prices broke below the neckline of the double top pattern, strengthening bearish momentum. The neckline area (4225-4220) will now become new resistance, and bears may be positioned there with a stop-loss placed above resistance, aiming for a further break below the trendline.
Trading strategy:
Buy: 4190-4185, SL: 4205, TP: 4120-4090

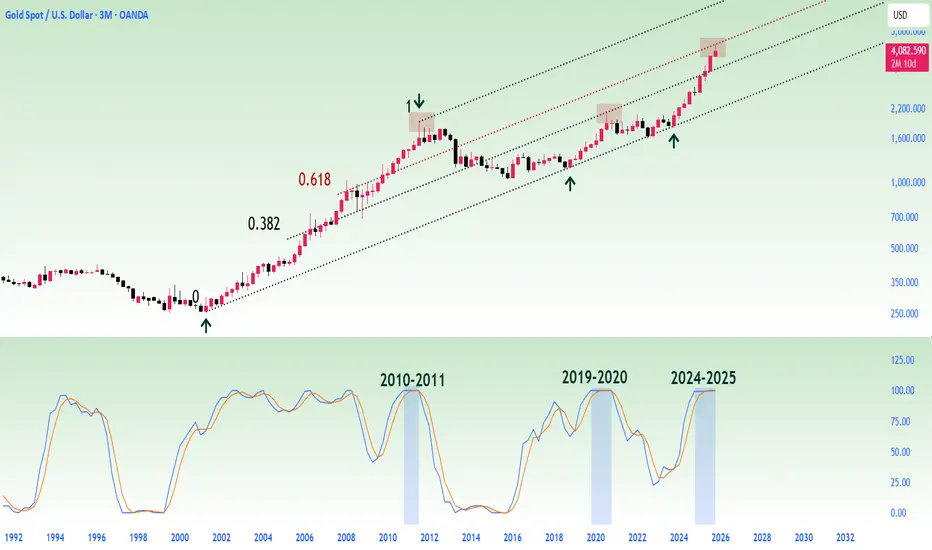
Gold has reached its peak and is about to undergo a reversal?Gold has been rejected at the 0.618 level of the Fibonacci channel on the 3M chart.
The Stoch RSI demonstrates a striking similarity to past cycles:
The bullish structure, which continued in the overbought region in October 2010, peaked 273 days later in July 2011.
Momentum, which continued in the overbought region again in October 2019, reached its peak 365 days later in October 2020.
Today, history paints a similar picture once again.
The bullish structure, which began in the overbought region in October 2024, may have reached its peak approximately one year later, in October 2025, just as in previous cycles.
Gold appears to be completing its historical rhythm once again.