XAUUSDHello Traders! 👋
What are your thoughts on GOLD?
Gold remains in a strong long-term bullish trend. After establishing a new All-Time High (ATH), the price has entered a corrective phase and is currently trading below a key resistance zone. This justifies the selling pressure in the short term.
We anticipate the correction to extend further until the price reaches the optimal support area. This zone represents a significant Confluence of two technical factors:
* The long-term ascending trendline.
* The 0.5 (50%) Fibonacci retracement level.
The marked area (Green Box) serves as the ideal pivot point for the correction to end and the next bullish Impulse Wave to begin. Upon reaching this level, we expect renewed demand to drive the price toward new record highs.
This analysis is based on the Weekly Timeframe. Therefore, the realization of this scenario requires patience and time; it is not intended for short-term intraday trading.
Don’t forget to like and share your thoughts in the comments! ❤️
Trade ideas

GOLD BEARS WILL DOMINATE THE MARKET|SHORT
GOLD SIGNAL
Trade Direction: short
Entry Level: 4,338.48
Target Level: 4,270.79
Stop Loss: 4,383.65
RISK PROFILE
Risk level: medium
Suggested risk: 1%
Timeframe: 1h
Disclosure: I am part of Trade Nation's Influencer program and receive a monthly fee for using their TradingView charts in my analysis.
✅LIKE AND COMMENT MY IDEAS✅

Gold 30-Min — Volume Sell Reversal Triggered⚡Base : Hanzo Trading Alpha Algorithm
The algorithm calculates volatility displacement vs liquidity recovery, identifying where probability meets imbalance.
It trades only where precision, volume, and manipulation intersect —only logic.
✈️ Technical Reasons
/ Direction — SHORT / Reversal 4222 Area
☄️Bearish rejection confirmed through sharp candle body.
☄️Lower-high forming beneath resistance supply region.
☄️Volume decreasing confirms exhaustion in price rally.
☄️Sellers regained imbalance with heavy top rejection.
☄️Algorithm detects fading demand and shift to control.
⚙️ Hanzo Alpha Trading Protocol
The Alpha Candle defines the day’s real control zone — the first battle of momentum.
From this origin, the Volume Window reveals where the next precision strike begins.
⚙️ Hanzo Volume Window / Map
Window tracked from 10:30 — mapping true market behavior.
POC alignment exposes institutional bias and breakout potential zones.
⚙️ Hanzo Delta Window / Pulse
Delta window monitors real buying vs. selling power behind each move.
Tracks volume aggression to expose who controls the candle — buyers or sellers.
When Delta aligns with Volume Map, momentum becomes undeniable.

Don't sell XAUUSD on any stageXAUUSD moving in consolidation zone from 4180-4220 and to much cranky .
I'm still on bullish Bias and buy in every Dips although my 1st buying still remains same from 4190-4180 zone .
Secondly if H4 closed below 4175 then market will retest 4145-4135 structural demand zone where I will start buying again .
Target remain same 4245 then 4275 on intraday

Gold weekly chart with Buy and sell areas last week we smashed it with both the weekly chart and the 1 off chart lets hope we are going to do the same this week
### 1H XAUUSD In-Depth Chart Analysis
#### Market Structure Overview
- **Overall Trend**: Short-term bearish correction within a larger bullish impulse (higher highs/lows on 4H/Daily). Price in descending channel post-recent high (~4280), testing multi-timeframe supports.
- **Key Levels**:
| Type | Level | Significance |
|------|--------|--------------|
| Support | 4213 | 200 EMA + 61.8% Fib retrace (from 4280-4100 swing) + prior 1H swing low. |
| Resistance | 4236-4250 | 50 EMA cluster + channel midline + 38.2% Fib retrace. |
| Support (Deeper) | 4192 | Channel lower bound + 100 EMA + prior session low. |
- **Volume Profile**: Declining volume on downside suggests exhaustion; spikes on bounces indicate accumulation.
- **Volatility**: ATR(14) ~25 pips; Bollinger Bands contracting, signaling potential expansion.
#### Buy Entry @ 4213 (Green Lines) - Bullish Reversal Setup
- **Primary Confluence**:
- **EMA Alignment**: Triple-touch on 200 EMA (dynamic support, slope +0.15%/hr). Price held above rising 100/200 EMA "golden cross" zone.
- **Fibonacci**: Exact 61.8% retracement of rally from 4100 low to 4280 high ($x = 4213$). Aligns with 50% of broader uptrend from 4000.
- **Candlestick & Momentum**:
- Bullish engulfing + hammer doji sequence (3-candle reversal).
- RSI(14): Oversold divergence (dipped to 25, diverged vs. price lows → climbed to 50). Stochastic(14,3,3) crossover from <20.
- **Other Confirmations**:
- MACD: Histogram flip positive + signal line cross above zero.
- Volume: 1.5x average on green candles, confirming buyer conviction.
- Structure: Higher low (HL) formation breaking minor downtrendline from 4260.
- **Invalidation**: SL below 4205 (recent wick low, R:R 1:2+).
#### Sell Entry @ 4192 (Red Lines) - Bearish Breakdown Setup
- **Primary Confluence**:
- **Channel Break**: Close below ascending channel (drawn from 4100-4213 lows) + prior 1H low cluster.
- **EMA Rejection**: 100 EMA acting as failed support (price pierced and rejected).
- **Fibonacci**: 38.2% extension of recent bounce (4213-4265) projecting to 4192; aligns with 161.8% of minor pullback.
- **Candlestick & Momentum**:
- Bearish pinbar + engulfing on high volume (rejection wick > body).
- RSI(14): Bearish divergence at 60 (price higher high, RSI lower) → momentum fade.
- MACD: Bearish crossover (fast line below signal) + expanding negative histogram.
- **Other Confirmations**:
- Stochastic: Overbought rejection (>80) with failure to hold.
- Ichimoku: Price below cloud base (Tenkan cross Kijun bearish).
- Structure: Lower low (LL) confirming breakdown; volume spike 2x avg on red candles.
- **Invalidation**: SL above 4200 (channel retest, R:R 1:2+).
#### Suggested Take Profits & Risk Management
| Trade | Entry | SL | TP1 (1:2 R:R) | TP2 (1:3 R:R) | TP3 (Swing) |
|-------|--------|----|---------------|---------------|-------------|
| **Buy** | 4213 | 4205 (-8 pts) | 4240 (+27 pts) | 4265 (+52 pts) | 4280 (prior high) |
| **Sell** | 4192 | 4200 (+8 pts) | 4175 (-17 pts) | 4155 (-37 pts) | 4140 (200 SMA daily) |
- **Position Sizing**: Risk 0.5-1% per trade (e.g., 1 lot = ~$8 risk on 8-pip SL).
- **Trailing**: Move to BE after TP1; trail using 20 EMA.
#### Multi-Timeframe Confluence & Bias
- **Higher TF (4H)**: Bullish above 4213 (200 EMA hold); aligns with daily uptrend from 4000.
- **Lower TF (15M)**: Micro bounces at 4213 suggest continuation if holds.
- **Overall Bias**: **Mildly Bullish** – Favor buys on 4213 retest if RSI >45 & volume holds. Bearish only on 4192 close (targets 4140). Watch USDX for macro (inverse correlation). Avoid trades during low-volume Asia session.
- **Probability Edge**: Buy ~65% (stronger support confluence); monitor for news (FOMC, NFP).
**Trade Only with Confirmation Candle Close. Backtest R:R >1:2 for 60%+ Win Rate.**

GOLD (XAUUSD): High Chance for a Pullback
Gold may go up after a test of a key intraday/daily support
and a little trap below that.
Expect a rise at least to 4216
❤️Please, support my work with like, thank you!❤️
I am part of Trade Nation's Influencer program and receive a monthly fee for using their TradingView charts in my analysis.

GOLD → The battle for zone 4200. Bullish trend FX:XAUUSD is forming a local trading range of 4180-4230, trying to stay above 4200 after yesterday's correction ahead of important US employment and services data.
The dollar is weakening amid expectations of a Fed rate cut on December 11. News concerning Powell, namely Fed chair candidate Kevin Hassett (a well-known “dove”), is supporting gold. Geopolitical risks (stagnation in Russia-Ukraine negotiations) are increasing demand for safe-haven assets.
• In focus today: ADP employment data and ISM Services PMI.
• Weak indicators will strengthen bets on Fed policy easing and support gold.
Gold retains its upside potential. The release of US data could either accelerate growth to $4300 or trigger a correction in the event of strong indicators.
Resistance levels: 4230, 4260
Support levels: 4185, 4175
Gold is testing 4200 for strong support. Local trading range 4180 - 4230. A false breakout of support amid a bullish trend and a weak dollar could support gold's growth.
Best regards, R. Linda!

XAUUSD – The Golden Wave Awaits the Next U.S. TriggerIf there is one asset being favored by the current macro environment , it is undoubtedly gold. The U.S. dollar is weakening due to expectations that the Fed will soon shift toward policy easing, while global investors await key U.S. data such as ADP, ISM, and the Fed meeting next week. This “waiting mode,” combined with the dollar dropping to its lowest level since mid-November , is creating a highly supportive backdrop for XAUUSD to continue its bullish momentum.
Looking at the chart, gold continues to move smoothly within its ascending channel . Price repeatedly rebounds from the lower boundary, rides along the Ichimoku cloud, and forms higher lows — all signatures of a healthy bullish market with real buying pressure . Every small pullback is absorbed almost immediately, showing that buyers remain firmly in control.
My preferred scenario: XAUUSD may fluctuate slightly around 4,180–4,200 to collect liquidity, then continue climbing toward 4,280 — an area aligning with the upper channel boundary and a level where the market has reacted strongly in the past. If ADP and ISM come out weaker than expected , a clean breakout above 4,280 becomes highly likely.
Overall, gold currently has macro momentum, technical alignment, and market sentiment all on its side . As long as you avoid FOMO and wait for minor pullbacks, you’ll find it much easier to ride along with the major flow of capital as the market prepares for the next wave of volatility.

Gold 1H – 4262 Sweep Drop or 4188 Hold the Floor?🟡 XAUUSD – Intraday Smart Money Plan | by Ryan_TitanTrader (03/12)
📈 Market Context
Gold is trading into policy-driven liquidity engineering as former White House adviser Kevin Hassett gains renewed spotlight after public commentary from former U.S. President Donald Trump referencing potential Federal Reserve leadership influence. Expect sharp liquidity sweeps both sides before institutions commit.
Technically, H1 price coils between premium and discount extremes, and the next leg unlocks only after MSS (CHoCH) + BOS + displacement validation.
🔎 Technical Framework – Smart Money Structure (1H)
Current phase = liquidity-rich compression at H1 extremes
Liquidity zones & key triggers
• 🔴 SELL GOLD 4265 – 4267 | SL 4275
Institutional idea: sweep above premium → bearish MSS + valid BOS down → FVG/OB retest → delivery into discount.
• 🟢 BUY GOLD 4186 – 4184 | SL 4176
Institutional idea: sweep below discount → bullish MSS + BOS up → FVG/OB retest → demand expansion.
• 🟡 Equilibrium / Chop: no trading unless structure proves intent.
Expected sequence = Sweep → MSS/CHoCH → BOS → Displacement → Retest → Expansion
🎯 Execution Rules (unchanged methodology, matching your zones)
🔴 SELL GOLD 4265 – 4267 | SL 4275
Rules:
✔ Price taps 4266 zone → bearish MSS/CHoCH (M5–M15)
✔ Confirm clean bearish BOS down with displacement
✔ Enter on FVG fill or OB retest after displacement
Targets:
1. 4245 – 4240
2. 4225 – 4215
3. 4186 – 4184
🟢 BUY GOLD 4186 – 4184 | SL 4176
Rules:
✔ Price sweeps 4185 → bullish MSS/CHoCH + BOS up
✔ Confirm displacement away from discount
✔ Enter on wick rejection + FVG fill or OB retest confirmation
Targets:
1. 4215
2. 4240
3. 4265+
⚠️ Risk Notes
• Both sweeps = traps until BOS + displacement proves intent.
• No averaging inside compression.
• SL = structure invalidation only.
• Reduce lot size during volatility spikes from headline risk.
📍 Summary
Two institutional routes today:
• 4266 sweep → bearish MSS/BOS → retest → delivery into 4185
or
• 4185 sweep → bullish MSS/BOS → retest → expansion into new 4266+
Trade the structure. Let price narrate intent. Patience = edge.
📌 Follow @Ryan_TitanTrader for daily Smart Money breakdowns.

GOLD Is Very Bearish! Sell!
Please, check our technical outlook for GOLD.
Time Frame: 9h
Current Trend: Bearish
Sentiment: Overbought (based on 7-period RSI)
Forecast: Bearish
The market is approaching a key horizontal level 4,198.77.
Considering the today's price action, probabilities will be high to see a movement to 4,117.75.
P.S
Please, note that an oversold/overbought condition can last for a long time, and therefore being oversold/overbought doesn't mean a price rally will come soon, or at all.
Like and subscribe and comment my ideas if you enjoy them!

Gold H1 – Will 4278–4280 Trigger a Drop Into 4170 Today?🟡 XAUUSD – Intraday Smart Money Plan | by Ryan_TitanTrader (01/12)
📈 Market Context
Gold continues its impressive rally as markets price in a potential rate cut by the Federal Reserve (Fed) in December. Spot gold recently surged past $4,230/oz — hitting a multi-week high — as the US Dollar Index (DXY) weakened.
The backdrop is increasingly dovish: fading USD strength, soft U.S. macro data, and dovish comments from Fed officials have fueled speculative buying in gold.
Technically, gold remains elevated, hovering inside a rising channel — similar to what’s shown on your chart. Price compression following strong displacement suggests a consolidation before the next institutional move.
🔎 Technical Framework – Smart Money Structure (H1)
Current state = Accumulation / Distribution within rising channel
Liquidity zones & key triggers
• Premium liquidity zone (sell-opportunity): ~ 4278–4280 (near upper channel resistance) — aligns with your SELL zone.
• Discount liquidity zone (buy-origin / re-entry zone): ~ 4172–4170 (near lower channel support / trendline) — aligns with your BUY zone.
• Equilibrium / chop zone: mid-channel / recent consolidation zone — avoid trading blindly here unless structure breaks.
Expected Smart Money sequence
Sweep → CHoCH/MSS → BOS → Displacement → Retest (FVG/OB) → Expansion
Given the macro tailwinds (weak USD, rate-cut odds), gold remains primed for a directional move once structure confirms.
🎯 Trade Plans for Today
🔴 SELL GOLD 4278 – 4280 | SL 4288
• Thesis: A liquidity sweep at channel top / premium zone followed by engineered bearish displacement — capturing liquidity before a reversal.
• Entry rules (must wait for confirmation):
• Price touches 4280 zone
• Bearish CHoCH / MSS + BOS down on M5–M15
• Entry ideally on FVG fill or after order-block retest post-BOS
• Targets:
1. 4245 – 4240 area (first reaction)
2. 4225 – 4215 (mid-channel retest)
3. 4175 – 4172 (lower channel + buy zone)
🟢 BUY GOLD 4172 – 4170 | SL 4162
• Thesis: Discount-origin tap near lower channel support / trendline — smart money likely to accumulate for next leg up, especially amid dovish Fed sentiment.
• Entry rules (must wait for confirmation):
• Price dips into 4170 zone
• Bullish CHoCH / MSS + BOS up on M5–M15
• Strong bullish wick + FVG fill or OB retest confirmation
• Targets:
1. 4225 – 4230 (first reaction / mid-channel)
2. 4255 – 4265 (upper mid-channel)
3. 4278 – 4280+ (premium liquidity retest)
⚠️ Risk Management & Notes
• Avoid trading inside the mid-channel chop zone without structural confirmation — no “blind” entries.
• Do not treat sweeps (top or bottom) as trend entries — these are often traps.
• Use tight SL (structure invalidation), avoid averaging in consolidation.
• Given potential volatility from macro headlines or a USD bounce, consider reducing lot size.
Summary
Gold is currently riding macro tailwinds — weak USD + Fed rate-cut odds — but from a technical perspective, it’s compressed inside a rising channel. The day’s price action may be a classic Smart Money liquidity hunt: either a sweep at 4278–4280 leading to a sharp drop toward 4170, or a retracement to 4170 that sets up a fresh bull leg.
Only trade after structural confirmation (CHoCH / BOS + retest) — avoid “trend-hop” entries.
📍 Follow @Ryan_TitanTrader for daily Smart Money updates.

Gold - This is the bullrun top!⚰️Gold ( OANDA:XAUUSD ) is slowly reversing now:
🔎Analysis summary:
Starting back in the end of 2015, Gold established another major bullish cycle. Ever since the rounding bottom breakout, Gold has been rallying higher and higher. But at this exact moment, Gold retests major resistance and is slowly starting to create a reversal.
📝Levels to watch:
$4,000
SwingTraderPhil
SwingTrading.Simplified. | Investing.Simplified. | #LONGTERMVISION

Gold Is Preparing for a Reversal — Only Smart Money Will 📌 1. Market Structure
Gold is currently forming a bullish market structure on higher timeframes, with clear sequences of:
- HH (Higher Highs)
- HL (Higher Lows)
The recent drop created a series of LL & LH patterns, but this occurs inside a falling wedge, which typically appears as a bullish correction phase before a strong continuation upward.
The wedge + liquidity sweep + key HL zone indicates a potential trend continuation.
📌 2. Key Zones
Major Support Zone: 4163 – 4170
This is the large liquidity zone where price previously formed HL + BOS.
Price is now dipping back into this zone — ideal for liquidity collection.
Upper Resistance Target: 4230 – 4265
This is where previous HH formed and where price may extend after breaking the wedge.
📌 3. Price Action
- Price broke structure (ChoCh) during the drop, but this move is corrective, not reversal.
- The wedge is compressing with lower volatility and higher rejection wicks.
- Sellers are losing strength; buyers are absorbing entries near the HL liquidity zone.
- Current projection shows a possible V-shaped reversal or a slower corrective retest bounce, both converging to bullish continuation.
This matches your yellow & green projection lines.
📌 4. Technical Confirmation
-Falling Wedge: A classic bullish reversal pattern.
-Liquidity Sweep: Price wicked below the previous LL, grabbing liquidity for buyers.
-BOS signals: Multiple Break-of-Structure points confirm prior bullish intent.
-Rejection at Support: Strong wick rejections inside the wedge base show institutional buying.
-Fib Confluence (if applied): 0.618–0.705 zone aligns perfectly with the current rebound.
All technicals suggest a bullish reversal is highly probable.
📌 5. Trading Plan
🎯 BUY Setup
Entry Zone: 4165 – 4175 (at wedge bottom / liquidity zone)
Stop-Loss: 4148 (below liquidity sweep & wedge invalidation)
Take Profit 1: 4210 (first structure break)
Take Profit 2: 4235
Final Target: 4260 – 4265 (previous HH)
Why this setup works:
You’re entering at the end of a liquidity sweep, inside a falling wedge, at a major HL zone, with BOS support behind you.
This is exactly where institutions enter not retail traders.

XAUUSD Daily Trade SetupIn this update we review the recent price action in Gold and identify the next high-probability trading opportunity and price objectives to target. To review today's video analysis clcik here!

qwdahsigdnuasijdhasoiuhdasuyhfnjmaiskom,,pco.imahnc,ihosa,cajuewad,abshdjagbsdhas
asdawdasd
gfvsgnbvdav
vasdvasvdavw

Gold Forming a Double Top Pattern?Last week, Gold( OANDA:XAUUSD ) exhibited sharp movements, both upward and downward, making trading quite challenging.
The key question is whether gold will continue its bullish trend.
Currently, gold is positioned near a resistance zone($4,231 – $4,215) and is moving close to significant support lines. Last week, gold created a bull trap above the resistance zone($4,231 – $4,215).
From an Elliott Wave perspective, it appears that gold has completed wave 5 with an expanding ending diagonal and is now undergoing a pullback towards the lower line of this pattern.
Looking at the classic technical analysis on the 4-hour chart, there’s a potential double top formation, and the momentum from the second top is quite strong, suggesting that gold may break through the support lines and confirm the double top pattern.
On the other hand, factors like the DXY Index ( TVC:DXY ) and the US 10-Year Government Bond Yield ( TVC:US10 ), which are currently bullish, could exert downward pressure on gold.
Considering all these points, I expect that gold will break through the support lines and potentially move down to $4,167.
Note: If gold breaks through the support zone($4,185 – $4,133), we can expect further declines.
First Target: $4,167
Second Target: $4,127
Stop Loss(SL): $4,247(Worst)
Points may shift as the market evolves
------------------------------------------------
We should also keep in mind that several important US economic indicators will be released this week, which could significantly impact market direction. So be extra cautious with your positions, especially during data releases:
JOLTS Job Openings➡️09 December
Federal Funds Rate➡️10 December
FOMC Statement➡️10 December
FOMC Press Conference➡️10 December
Unemployment Claims➡️11 December
------------------------------------------------
💡 Please respect each other's opinions and express agreement or disagreement politely.
📌 Gold Analyze (XAUUSD), 4-hour time frame.
🛑 Always set a Stop Loss(SL) for every position you open.
✅ This is just my idea; I’d love to see your thoughts too!
🔥 If you find it helpful, please BOOST this post and share it with your friends.

XAUUSD Gold Trade Plan: Friday Counter Trend Into The CloseGold has been pushing aggressively this week with strong bullish momentum ⚡️📈. As we head into Friday, I’m watching for a potential counter-trend move — ideally a push into the weekly highs gives us a pullback back into the weekly close 🎯📉.
Of course, this is not financial advice — just my current outlook based on market behavior, structure and momentum 📊🤝.

XAU / USD 1 Hour ChartHello traders. Just looking at the hourly. The one lone red candle is where I am watching. Will we form / hold support for a breakout and retest, or keep pushing down?? Let's see how the overnight sessions play out. Big G gets a shout out. Be well and trade the trend.

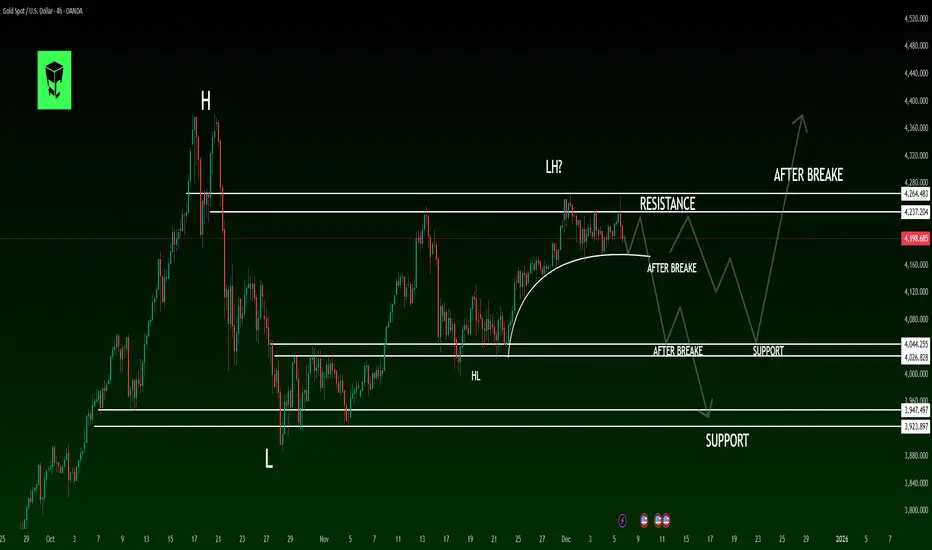
GOLD Technical Analysis: Multi-Layer Structure & Key Scenarios 4H Timeframe Analysis ⏰
Gold has entered a structural corrective phase after a strong bullish trend that formed a Higher High (HH). This correction is visible in momentum, volume, and market structure with a confirmed Lower High (LH) formation. The combination signals a powerful Decision Point that will determine gold's medium-term direction. 🔄
🔶 Market Structure Breakdown
◼️ 1. Main Bullish Wave 🚀
After breaking October resistance, price formed a HH
HH showed buyer strength, but first weakness appeared:
Sharp rejection from top → Declining bullish momentum 📉
◼️ 2. Correction Phase ⬇️
Initial correction formed a Higher Low (HL)
Price failed to break previous high → Valid LH formed
Market entered neutral-to-bearish structure
◼️ 3. Current Status 🎯
Price is trapped between two key zones:
Resistance:4270
Support: 4022
Key Levels:
🔸 Resistance Zone: LH formation area, multiple rejections
Breakout = Correction end + New bullish wave 🟢
🔸 Mid Support: Trend anchor level
Break = First confirmation of bearish structure 🔴
🔸 Major Support:4170
Break = Medium-term correction activation 📉
🔶 Probable Scenarios
🟢 BULLISH SCENARIO (Resistance Break)
Break & close above LH zone
R→S conversion
New bullish wave with volume increase
Targets:4440
🔴 BEARISH SCENARIO (Support Break)
Failure at resistance + Mid support break
Deep correction wave + New LL formation
Targets: 3950
🔶 Market Psychology 🧠
Current price action shows:
Buyer caution ⚠️
Gradual sell orders accumulation at resistance
Limited seller power in corrections
High sensitivity to fundamental news 📰
Typical pre-breakout/breakdown consolidation
📢 Your Thoughts?
Comment below with your analysis! 👇
⚠️ RISK DISCLAIMER:
Trading carries high risk. Always educate yourself and use proper risk management. Not financial advice. 📚
Gold Shows Cracks: Is the 4180 Support About to Give In?Yesterday, Gold stayed between the boundaries of the 4180–4250 range.
Although the session started with a bullish tone, buyers failed twice: first, to push price toward the upper resistance, and later, after touching support, to reclaim the 4200 zone overnight.
This inability to regain control is a clear sign of weakness.
Key Question
Has Gold finished its consolidation?
Why a continuation lower is likely?
- The market has been distributing for more than a week inside this 4180–4250 corridor.
- Failed bullish attempts reveal vanishing demand.
- Support at 4180 has become increasingly vulnerable.
If support breaks with momentum, we could see downside acceleration toward the 4100 zone.
Trading Plan
For now, the bias is bearish as long as the price stays below 4220.
Only:
- A move above 4220 would shift Gold back into a range-trading environment.
- And stabilization above 4250 would bring bulls back into the game.

Wait for the price to drop before buying.Gold surged to 4118 yesterday, fluctuated during the European session, and then fell rapidly during the US session. Today, the Asian and European sessions continued the bearish trend from yesterday's US session, but after falling to a low of 4170, it rebounded quickly. Currently, both bullish and bearish trends exist. Tonight, consider shorting at higher levels and going long at lower levels. Watch the support level at 4185. If it rises directly tonight, consider shorting at higher levels, as gold still has a short-term downward trend.
Gold Recommendation: Go long near 4190 or 4185, stop loss at 10 USD, target 4215-25.

GOLD – Liquidity Compression Before Rate Cut (Dec 10) Buy zoneXAUUSD is trading inside a multi-week compression wedge, building energy for a breakout as the December 10 rate cut approaches.
When price compresses into a macro event, liquidity mapping becomes more important than patterns.
Here’s the current structure in simple terms:
🔍 1. Liquidity Above Price (Buy-Side Liquidity)
Price has formed clean equal highs between 4300–4350, which creates:
breakout buy orders
short stop-loss clusters
unfilled liquidity from the last sweep
This is the ultimate magnet if price chooses upside continuation into the rate decision.
🔍 2. Liquidity Below Price (Sell-Side Liquidity)
There are 3 layers of resting liquidity:
1) 4165–4185 zone (primary liquidity pocket)
This aligns with:
rising trendline support
unmitigated 4H imbalance
multiple swing lows
strong volume node
This zone is the most likely to be tapped before any upside breakout.
2) 4120–4140 zone
Deeper stop-run zone.
Less likely due to timing, but if hit, it typically produces a strong bullish reaction.
3) 4000–4020 extreme flush zone
Requires unexpected macro volatility.
Least likely before Dec 10.
📈 3. Macro Context: Rate Cut Probability on December 10
When a dovish macro event is very close, gold historically:
avoids deep retracements
tends to accumulate shallow dips
front-runs the announcement
often sweeps one side and then trends strongly in the opposite direction
Because time is short, a full breakdown is unlikely.
The market typically chooses either a shallow sweep or a direct breakout.
🎯 Most Likely Path (based on structure + liquidity + macro timing)
Dip into 4165–4185 (sell-side sweep)
Liquidity grab + accumulation
Push toward 4250
Breakout attempt into 4300–4350 (buy-side sweep)
Volatility spike during/after the rate cut
This sequence aligns with both institutional liquidity behavior and typical pre-FOMC price action.
📌 Key Levels to Watch
Buy-Side Liquidity:
4300
4330–4350 (major equal highs)
Sell-Side Liquidity:
4185
4165
4140
4120
🧠 Idea Summary
Gold is compressing into a major macro catalyst while sitting between significant liquidity pools on both sides.
The next 2–3 sessions will likely deliver:
a shallow downside sweep into 4165–4185 OR
a direct upside breakout
Both paths ultimately point toward gold attempting to test higher liquidity into the rate cut.
This idea is not financial advice—it’s a liquidity map to help understand how price may behave heading into a high-impact event.

Elise | XAUUSD 15m Testing Reaction SupplyGold is currently trading inside a Reaction Supply Zone, where previous sell-side aggression originated. Although price bounced from trendline support, the move remains corrective as long as it stays below the 4,238–4,242 breakout region.
A bullish continuation requires a clean break and hold above this level, opening targets at:
🎯 4,256
🎯 4,263
🎯 4,276 (upper channel liquidity)
Failure to break supply may lead to a pullback toward the 4,210–4,200 demand zone.
⚠️ Educational analysis. Not financial advice. OANDA:XAUUSD
