GOLD – Liquidity Compression Before Rate Cut (Dec 10) Buy zoneXAUUSD is trading inside a multi-week compression wedge, building energy for a breakout as the December 10 rate cut approaches.
When price compresses into a macro event, liquidity mapping becomes more important than patterns.
Here’s the current structure in simple terms:
🔍 1. Liquidity Above Price (Buy-Side Liquidity)
Price has formed clean equal highs between 4300–4350, which creates:
breakout buy orders
short stop-loss clusters
unfilled liquidity from the last sweep
This is the ultimate magnet if price chooses upside continuation into the rate decision.
🔍 2. Liquidity Below Price (Sell-Side Liquidity)
There are 3 layers of resting liquidity:
1) 4165–4185 zone (primary liquidity pocket)
This aligns with:
rising trendline support
unmitigated 4H imbalance
multiple swing lows
strong volume node
This zone is the most likely to be tapped before any upside breakout.
2) 4120–4140 zone
Deeper stop-run zone.
Less likely due to timing, but if hit, it typically produces a strong bullish reaction.
3) 4000–4020 extreme flush zone
Requires unexpected macro volatility.
Least likely before Dec 10.
📈 3. Macro Context: Rate Cut Probability on December 10
When a dovish macro event is very close, gold historically:
avoids deep retracements
tends to accumulate shallow dips
front-runs the announcement
often sweeps one side and then trends strongly in the opposite direction
Because time is short, a full breakdown is unlikely.
The market typically chooses either a shallow sweep or a direct breakout.
🎯 Most Likely Path (based on structure + liquidity + macro timing)
Dip into 4165–4185 (sell-side sweep)
Liquidity grab + accumulation
Push toward 4250
Breakout attempt into 4300–4350 (buy-side sweep)
Volatility spike during/after the rate cut
This sequence aligns with both institutional liquidity behavior and typical pre-FOMC price action.
📌 Key Levels to Watch
Buy-Side Liquidity:
4300
4330–4350 (major equal highs)
Sell-Side Liquidity:
4185
4165
4140
4120
🧠 Idea Summary
Gold is compressing into a major macro catalyst while sitting between significant liquidity pools on both sides.
The next 2–3 sessions will likely deliver:
a shallow downside sweep into 4165–4185 OR
a direct upside breakout
Both paths ultimately point toward gold attempting to test higher liquidity into the rate cut.
This idea is not financial advice—it’s a liquidity map to help understand how price may behave heading into a high-impact event.
Trade ideas

Elise | XAUUSD 15m Testing Reaction SupplyGold is currently trading inside a Reaction Supply Zone, where previous sell-side aggression originated. Although price bounced from trendline support, the move remains corrective as long as it stays below the 4,238–4,242 breakout region.
A bullish continuation requires a clean break and hold above this level, opening targets at:
🎯 4,256
🎯 4,263
🎯 4,276 (upper channel liquidity)
Failure to break supply may lead to a pullback toward the 4,210–4,200 demand zone.
⚠️ Educational analysis. Not financial advice. OANDA:XAUUSD

Gold (XAUUSD) Technical & Fundamental Analysis
The recent Federal Reserve decision to cut rates by 25 bps combined with a natural-to-hawkish FOMC statement and Powell’s dovish press conference has created a unique dynamic in the markets. While the statement initially suggested caution, Powell’s tone opened the door for additional cuts in 2026, effectively removing the possibility of near-term hikes. This shift has fueled risk appetite, driving equities higher and simultaneously supporting precious metals as real yields decline.
Gold, traditionally sensitive to interest rate expectations, responded positively to this dovish tilt. Lower rates reduce the opportunity cost of holding non-yielding assets like gold, and Powell’s comments reinforced the bullish outlook for XAUUSD.
On the 4H chart, XAUUSD has broken out of a consolidation zone (highlighted in purple) and is now trading near 4,286, marking a strong bullish continuation. Key observations:
Breakout Confirmation: Price decisively cleared the upper boundary of the prior range, signaling strong momentum.
Trend Structure: The asset is respecting an ascending channel, with the breakout aligning with the channel’s midline trajectory.
All moving averages are sloping upward, confirming bullish bias.
Trading Strategy
Bullish Bias: The breakout and dovish macro backdrop favor long positions.
Entry Options:
Aggressive: On minor pullbacks toward 4,265 (previous resistance turned support).
Conservative: Wait for a confirmed break above 4,300 psychological level.
Targets:
First: 4,330
Second: 4,380–4,400

XAUUSD Holding Support – Expecting Expansion After AccumulationPrice is currently moving within a sideways consolidation zone after a strong impulsive leg up. The candles are repeatedly filling into the 50% midpoint of previous weeks, showing controlled accumulation rather than aggressive selling. This behaviour typically precedes a continuation move, provided support levels remain intact.
📌 Critical support:
$4,164 – $4,180 zone (last week’s lowest candle)
This region aligns with:
50% candle fill area
Previous consolidation base
Retest of downward trendline intersection
As long as this zone holds, buyers remain in control.
🔻 Downward trendline from previous swing highs is still active and acting as dynamic resistance.
It converges with the midpoint of the range → increasing friction near current price.
📈 Below, the ascending channel/rising structure is still intact. The upper boundary is currently containing price.
This creates a compression pattern:
➡️ Price is trapped between upward structure and overhead resistance → breakout highly likely.
Plan A – Bullish Continuation
If price finds strength within the consolidation and breaks above the trendline:
Break & retest above $4,230 – $4,250
Target remains $4,280+
Momentum continuation beyond may extend toward $4,300
Invalidation: breakdown below $4,180.
Plan B – Deeper Liquidity Sweep
If price dips to fill last week’s low:
Sweep below $4,164
Reject from support zone
Strong V-reversal expected if buyers step back
Execution:
Long positions from the liquidity sweep area offer best R:R.
Targets back into range:
$4,220 → $4,250 → $4,280
This aligns with historical pattern of:
✔ wick grab → rally
✔ 50% candle fill during consolidation
✔ trap & reversal

GOLD (XAUUSD): Sticking to The Plan
Gold stuck on a key daily resistance this week.
To buy, we continue waiting for its breakout.
A daily candle close above 4266 will confirm a violation.
A bullish continuation will be expected to 4355 then.
❤️Please, support my work with like, thank you!❤️
I am part of Trade Nation's Influencer program and receive a monthly fee for using their TradingView charts in my analysis.

XAUUSD Intraday Plan | 4285 Hit, Whats Next?Analysis has played out perfectly, with gold reaching our 4285 target.
For any further upside, buyers must break and hold above 4285, which would open the path toward 4322.
If price fails to clear 4285, expect a pullback toward lower support levels. Gold is currently trading at the top of the range, and with it being Friday, volatility tends to increase — meaning we could see sudden sharp spikes and downside whipsaws.
📌Key levels to watch:
Resistance:
4285
4322
Support:
4251
4219
4185

Gold & EURUSD Analysis: Gold Pullback Expected | EUR Bearish GOLD & EURUSD ANALYSIS: Key Levels to Watch
Multi-pair analysis covering current wave structures and critical decision points for XAUUSD and EURUSD.
🥇 GOLD (XAUUSD) - Bullish, But Pullback Needed
Overall Bias: Still bullish
Current Status: Unfinished bearish pullback in progress
Wave Structure Analysis:
We're currently in a corrective phase. For the bullish trend to continue properly, Gold needs to complete Wave 4 (pullback) before forming Wave 5 (bullish momentum high).
Key Level: 4162.50
Price must trade below 2,662.50 to complete Wave Structure 4. This pullback is necessary for the bullish structure to remain valid.
What Happens Next:
Once Wave 4 completes below 4162.50, we can then expect Wave 5 (Bullish Momentum High) to form, continuing the overall uptrend.
Trading Strategy: Wait for the pullback to complete before looking for bullish continuation entries.
💶 EURUSD - Bearish Trend-Changing Pattern Forming
Market Context: Uptrending market showing potential reversal
Current Pattern: Bearish trend-changing pattern developing
The Challenge:
The Euro has been tricky lately—clean directional trends have been hard to identify. However, this morning's price action provided important clarity.
This Morning's Development:
Price formed a potential Lower Momentum High 5 with a strong rally that spiked beyond Tuesday's high. This spike represents a failure to complete the bullish wave structure—buyers pushed higher but couldn't sustain it.
Critical Breakdown Level: 1.1615 (Tuesday's Low)
If price breaks below 1.1615, it will confirm:
Breakdown of the bullish structure
Bearish trend-changing pattern validated
Potential downside continuation
Trading Strategy:
Watch 1.1615 closely. A break below this level signifies structural breakdown and potential short opportunity.
Summary:
GOLD: Bullish overall, waiting for Wave 4 pullback below 4162.50
EURUSD: Potential bearish reversal—watch for break below 1.1615
Both pairs at critical junctures. Let price prove the structure before entering trades.
👍 Boost if you found this analysis helpful
👤 Follow for continued multi-pair updates

GOLD: Short Trading Opportunity
GOLD
- Classic bearish formation
- Our team expects fall
SUGGESTED TRADE:
Swing Trade
Sell GOLD
Entry Level - 4203.5
Sl - 4211.4
Tp - 4191.2
Our Risk - 1%
Start protection of your profits from lower levels
Disclosure: I am part of Trade Nation's Influencer program and receive a monthly fee for using their TradingView charts in my analysis.
❤️ Please, support our work with like & comment! ❤️

Gold Market Makers on the MoveDaily: Hold/Sell
After the initial genuine move higher at the begging of the week, supported by rising volume, something interesting happened on Friday, as the price was going to test the ATH a massive sell came in. Two things to note about this move.
It formed a shooting star on high volume aka volume stopper.
One must thing if that was just profit taking or MM's ( Market Makers) are selling and so we entering in distribution phase.
Either way that's a strong signal to be careful as here the trend might change or pullback, or enter in a strong congestion, one thing is for sure we are not going any higher , we might get closer to the ATH at another foolish attempt to break it but it will need equally high bullish volume to reposition the momentum.
4H: Hold and Observe what the PA is telling you
On this time frame some more clues are coming, note the 4H TF I check is starting at midnight not at 23:00 like on TV, so the patterns are slightly different. So the the reversal came in the shape of Tweezer Top or Two candle reversal on very high volume , what followed next even more interesting a hammer testing the previous resistance 4265 also on high volume . How do I interpret this is after the Tweezer top the price entered in a free fall but the MM's are not ready yet with their new campaign , and probably they haven't sold all their longs yet so they pushed the price back up to stopped from falling. It is very likely that after this we see the price rising a bit again and more positions being liquidated, while they preparing for the next move.
1H:
Some more details about the chart:
We are in a bullish channel (wide)
Resistance 4265 which was holding the price since from going any higher since November, was violated.
Currently trading between the ex-resistance now support and the All Time High.
MM's are very present at this level.
The Plan
Careful at the manipulations and fake outs
Sell at ATH after double top or any reconfirmation.
Buy at second test of 4265
Sell below 4242
More Updates will be given during the week.
Disclaimer: This are notes of what I do for my self every week, but usually I just save them as Private notes so I can keep track on my weekly plan. I decided to start publicly sharing them in the hope that they can be somehow helpful to anyone, and maybe learn something from you in the comments.
About me: I trade Support and Resistance both breakouts and rejections, usually my entries are after Hammers and Shooting stars on above average volume. I use VPA (Volume Prize Analysis) for all my analysis and entries. I do not post my Tick Volume indicator as I use different platform for it.
My Win%:
All time 45.05%
2025 45.51%
Q3 51.39%
Good Luck in your trading
That's the last trading week for me for 2025
Merry Christmas and Happy New Year
Thank you
Don Bob

Monthly Metals Analysis: Gold (XAUUSD), Issue 212 The analyst expects XAUUSD’s price to rise by the specified end time, based on quantitative analysis.
The take-profit level only indicates the potential price range during this period — it’s optional and not a prediction that price will reach it.
You don’t need to go all-in or use leverage to trade wisely.
Allocating just a portion of your funds keeps overall risk minimal.
Our approach follows institutional portfolio principles — not the all-in or blow-up trading style often seen on social media.
Results are measured over the full time window, regardless of whether the take-profit level is hit.
The validity of this analysis is based on a specific time range (until 06 Jan 2025), and after this period, the analysis will be reviewed and updated (once every 28 days).
Next analysis : Monthly Metals Analysis: Silver (XAGUSD), Issue 212

Gold successfully broke above 4245 to 4260-4264 ...but ...Gold Outlook — Monday 08-Dec-2025 & The Week Ahead
GoldRider — Detailed Weekly Update
Last close: $4,197 (week ended with clear fight between bulls & bears).
Note: Price probed above 4220-4230-4245 last Monday and reached $4,264 and did it again last Friday and touched 4260 but failed to secure a clean daily close above that zone — this is the key nuance for next directional bias.
Reminder: Do not trade immediately at open. Let the market settle 30–60 minutes. Holiday gaps and low liquidity create noisy opening swings.
1) Macro & Geopolitical Drivers (what matters this week)
The macro picture is largely similar to last week — this week’s trigger is Fed day (Wednesday).
Wednesday — Fed rate decision & Powell press conference.
The actual rate move is mostly priced in; the market will trade the tone of Powell. Expect fast, high-impact moves (20–30 USD spikes) on the prints and Q&A.
U.S.–Russia/Ukraine talks: ongoing, no realized settlement yet. Any real progress would be strongly bearish for gold (risk-off unwinds).
Venezuela tensions: Trump’s comments + FAA warnings — bullish for gold as geopolitical risk picks up.
U.S. government-shutdown risk: currently paused but remains a tail risk (could re-ignite in January); neutral for now.
Bottom line: Macro mix = large positive + large negative + neutral = market remains balanced — Powell’s words and clean technical breaks will decide the next leg.
2) Technical Readings — Monthly → Weekly → Daily → 4H
Monthly
December week 1 range: 4264 – 4163 (100 USD width).
Current candle body tight: 4221 – 4198; upper wick ~43 USD, lower wick ~35 USD → balance between bulls & bears ahead of Fed.
Key upside cluster: 4220 → 4232 → 4245 → 4260–4265 → then 4300 if broken decisively.
Key downside: 4164 → 4121 → 4086.
Weekly
Recent weekly closes (summary):
10-31: Close 4002 (High 4109 / Low 3886)
11-07: Close 4001 (H 4030 / L 3928)
11-14: Close 4085 (H 4245 / L 4004)
11-21: Close 4065 (H 4132 / L 3997)
11-28: Close 4215 (H 4226 / L 4040)
12-05: Close 4198 (H 4264 / L 4163)
Notes: Price remains above all major weekly EMAs (10/20/50/100/200) — longer-term structure intact bullish.
Weekly MA10 ~ 4037 = first defense.
Weekly MA20 ~ 3850 = deeper support.
Decision band: 4220–4230 = gateway for further upside. Reclaiming 4245 (third-time break in December) would confirm stronger bullish momentum.
Daily
Bulls face a hard resistance at 4210–4212 market failed to close daily above it (three consecutive attempts).
Strong daily supports near 4180, 4144, 4030.
Tactical rules: Buy above 4210; sell below 4190.
4-hour
The 4H shows sellers forcing price under EMA10 (~4211) in the last 3 candles — that’s the technical reason for the “failed close” narrative.
Trade signals: Buy only above 4212; sell only below 4190. Between those levels is “fog” — higher risk for fakeouts.
3) Trade Plan — Monday (preferred: wait 30–60 mins)
Bull Case (Long)
Entry: Above 4206 (risk from 4201). Confirm strength by closing above 4210–4212.
Targets: 4213 → 4218 → 4228 → 4236 → 4244 → 4255 → 4264 → 4274 → 4285 → 4300.
Bear Case (Short)
Entry: Below 4184 (risk from 4188).
Targets: 4176 → 4172 → 4167 → 4160 → 4150 → 4144 → 4136 → 4130 → 4121.
Risk advice: spacing between targets is tight; lock partial profits frequently and respect stop-losses.
4) Final Notes & Conduct
If you find value, a share/comment helps the channel grow.
Disclaimer: This is a personal technical and macro view, not financial advice. Trading carries risk. Decisions are your responsibility.
Wishing everyone a profitable week — GoldRider
#Gold #XAUUSD #GoldRider #GoldAnalysis #TechnicalAnalysis #WeeklyOutlook #Forex #MarketUpdate #GoldTrading


gold BUYSBiases and preconceived notions can lead traders astray. Trust the data and indicators on your screen rather than relying on assumptions or gut feelings.

Sell setupGold is approaching a major supply zone between 4380 and 4405. If price rejects this level, I will consider entering a sell position.

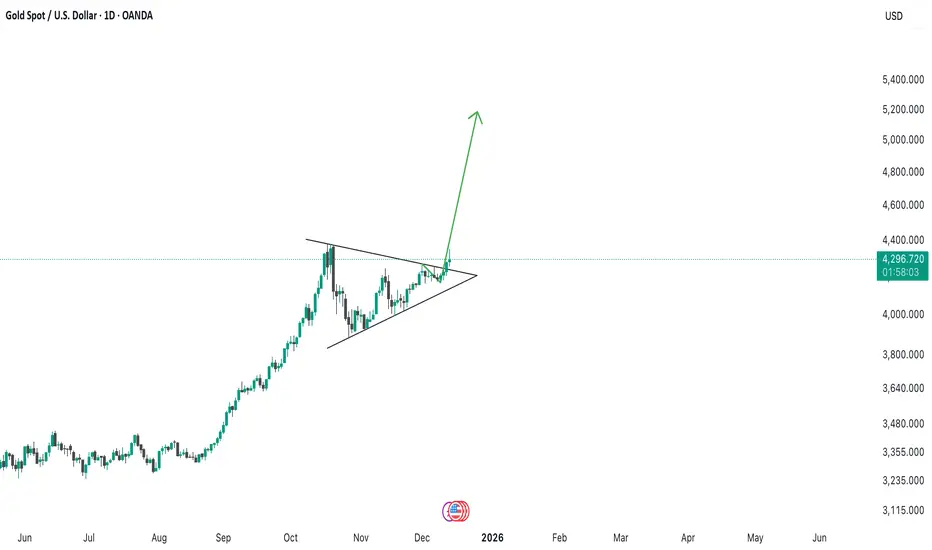
Daily Time Frame AnalysisAs I shared my analysis before another breakout had just done in gold and as seen in the past consequtive 6 week candle will be green so every monday will be entry for market and will be swing trade till 5188 atleast according to me.
Stop trying to be consistent!Hey @TradingView Community,
If you’ve been trying to be consistent in trading, I get it.
I did the same for years.
But here’s the truth, it’s one of the main reasons traders stay stuck.
Let me explain.
Most traders think consistency means winning every trade.
They want a perfect record, no red days, no losses.
But that kind of consistency doesn’t exist.
Even the best traders in the world have losing trades.
The market is not something you can control.
Some days it’s smooth, other days it’s chaos.
When you try to force it, you end up making emotional decisions and breaking your own rules.
What you really want is steady progress, not perfection.
The best traders don’t try to win all the time.
They focus on showing up, following their plan, and protecting their account during the bad days.
That’s how they survive long enough to win big when the opportunity comes.
That’s exactly what our system is built for — survival and growth.
It’s designed to help you trade calmly, stick to your plan, and stop chasing a perfect track record.
You wanna see what our traders were able to achieve? check our website and read the why us page.
And don't forget WTW 4 Golden rules!
1) Do not jump in
2) Do not over risk/trade
3) Do not trade without Stop Loss
4) Never ever add to a losing position!
Take with care,
Alain M(Coach)
WTW Team

Buy, buy, buy!!Buy now or Buy on 4166.0
SL @ 4120.0
TP1 @ 4309.0
TP2 @ 4379.0
TP3 @ 4490.0
What are these signals based on?
Classical Technical Analysis
Price Action Candlesticks Fibonacci
RSI, Moving Average , Ichimoku , Bollinger Bands

Learn This Pattern to Predict the Next Market Move🟩 What Is a Symmetrical Triangle?
A symmetrical triangle pattern is a continuation pattern that typically forms when the market enters a phase of consolidation and price compression.
In this pattern, price moves between two converging trendlines—one descending and one ascending.
Upper trendline: Lower Highs
Lower trendline: Higher Lows
These two lines converge toward each other, forming a balanced, center-aligned triangle.
🟨 Key Characteristics of a Symmetrical Triangle
✔️ Two converging trendlines (one sloping down, one sloping up)
✔️ Gradual decrease in trading volume
✔️ Price moves toward the apex of the triangle
✔️ Breakouts usually follow the prior trend
✔️ It is primarily a continuation pattern, though occasional reversals can happen
🟦 How to Identify a Symmetrical Triangle
To confirm a valid symmetrical triangle, check the following:
🔹 1. At least two touches on resistance and two on support
You must see lower highs and higher lows.
🔹 2. Both trendlines must slope inward
Unlike ascending or descending triangles, both lines are angled.
🔹 3. Price must contract toward the apex
Smaller swings = market compression.
🔹 4. Volume should gradually decline
Until the breakout occurs.
🟧 Professional Entry Strategies
📌 Method 1: Entering After the Breakout (Conservative Entry)
Wait for a candle to close outside the triangle
Volume should increase as confirmation
Stop-loss below the last swing or below the trendline
📌 Method 2: Entering After a Pullback (Low-Risk Entry)
Wait for a retest of the broken trendline
Use candlestick triggers (Pin Bar, Engulfing, Break & Retest)
Much smaller stop-loss + a better risk-to-reward ratio
📌 Method 3: Volume + Breakout + Positioning
For advanced traders, Volume Spread Analysis (VSA) is the strongest confirmation tool for breakouts.
🔶 Setting Take-Profit Targets
Standard Method:
📐 Target = Height of the triangle base
(measured from the widest part of the pattern)
Professional methods:
✔️ Target 1: Market Structure
Based on supply/demand zones
✔️ Target 2: Fibonacci Extensions
1.618 is often the most reliable target
✔️ Target 3: Multi-Timeframe Alignment
Check breakout levels in higher timeframes for added confidence
🔶 Fake Breakouts in Symmetrical Triangles
Fake breakouts are extremely common in this pattern.
Signs of a fake breakout:
❌ Low volume
❌ Long-wick candles
❌ Quick rejection back into the triangle
❌ Breakout occurs too close to the apex
❌ Lack of momentum
Fake breakouts often lead to a strong move in the opposite direction.
🔶 Pattern Behavior in Different Market Conditions
🟢 In an uptrend:
80% of the time it breaks upward → continuation
🔴 In a downtrend:
About 65% of the time it breaks downward → continuation
⚪️ In a ranging market:
Direction of breakout is uncertain → extra caution required
🔶 Common Mistakes Traders Make
🚫 Entering before the breakout
🚫 Confusing the pattern with ascending/descending triangles
🚫 Trusting breakouts without volume confirmation
🚫 Setting stops too close
🚫 Ignoring market psychology and momentum
🔷 Final Professional Summary
A symmetrical triangle indicates:
The market is in a compression phase
Lower Highs + Higher Lows
Price is preparing for a strong explosive move
Breakouts usually follow the prior trend
Valid breakouts require volume + candle close outside
Targets follow the triangle height or Fibonacci extensions
Fake breakouts are common → caution is essential
Gold idea Gold (XAU/USD) is respecting the rising support trend line and continues to push upward. Price is holding above 4215, showing bullish momentum. A breakout toward the resistance zone targets the 4300 level, where the next major reaction is expected.

GOLD Consolidation bullish testing the upper momentumGold market has been moving within a broad ascending trend channel, recently break the resistance and could move to upside if the price maintain that range we could expect price growth further.
Recently, price broke out strongly to the upside, creating a bullish momentum shift. After clearing the upper trendline, gold pushed into a higher resistance zone highlighted on the chart. The candles show a steep upward move, followed by a projected pullback and continuation pattern illustrated with white arrows.
Gold has been in consolidation, but the recent breakout signals bullish continuation. If price holds above the 4,305–4,332 region, further growth is possible. However, a drop below 4,260 test the support then again price growth to upside.
Overall, the chart illustrates a bullish breakout, a potential retest of the trendline, and an anticipated continuation toward upper resistance targets.
You may find more details in the chart,
Trade wisely best of luck buddies.
Ps: Support with like and comments for better analysis thanks for supporting.

GOLD | Consolidation Amid Rising Geoeconomics RiskGOLD – Technical Overview
The World Gold Council notes that geoeconomic uncertainty is expected to shape gold’s performance in 2026.
Unexpected events—such as Trump’s Liberation Day tariffs—highlight the growing frequency of tail-risk shocks.
The Council believes that slower economic growth, accommodative monetary policy, and persistent geopolitical risks are more likely to support gold than weaken it, keeping the metal attractive in risk-sensitive environments.
Technical Analysis
Gold is currently expected to test 4198, after which price may attempt a move toward 4218.
This places the market in a consolidation range between 4198 and 4218 until a breakout occurs.
A 1H close below 4198 will trigger a bearish move toward 4181, with an extended decline possible into 4151.
Conversely, a 1H close above 4218 will confirm bullish continuation toward 4237, with stronger upside potential if momentum persists.
Key Levels
Pivot Line: 4198
Resistance: 4218 · 4237 · 4255
Support: 4181 · 4151

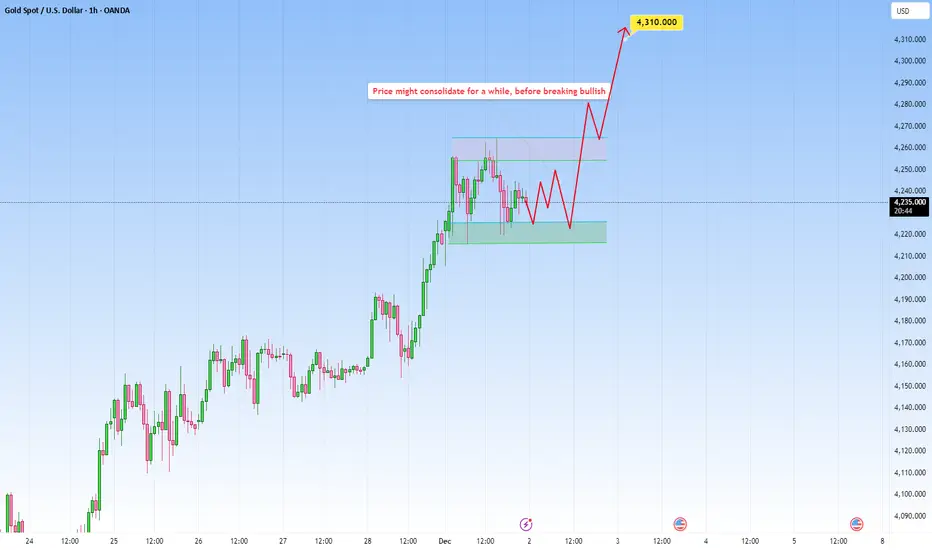
XAUUSD: Waiting for directionPrice recently pushed to the upside, but now the market is slowing down, moving sideways.
This is classic reaction after an impulsive move. Buyers are still in control overall, but taking a breather.
A clean break above the upper range would confirm that buyers are ready to continue the trend and push for new highs.
That’s the scenario I’m watching, a bit of back-and-forth, then a breakout to the upside once the market is done consolidating.
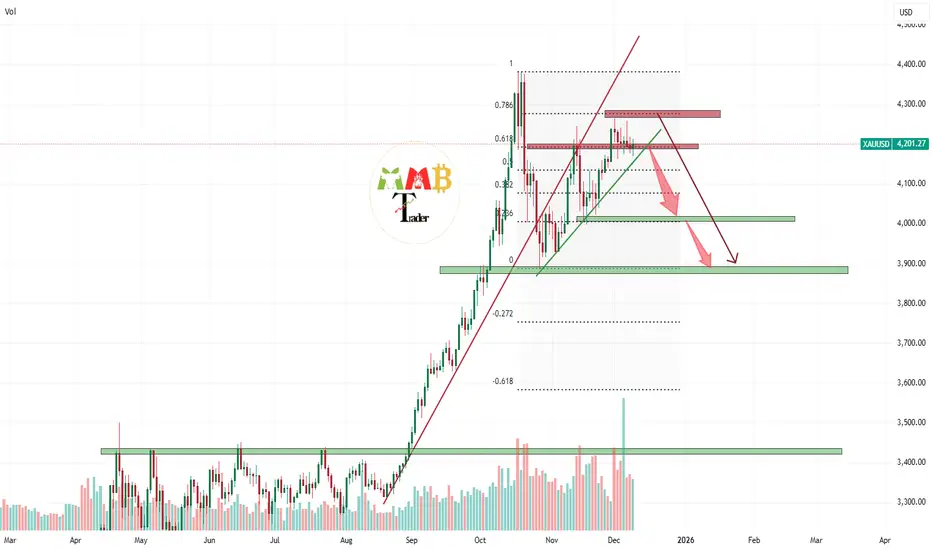
Gold the dump will continue this is just the beginning Gold is currently holding at the 0.786 Fibonacci retracement level, which is acting as a key resistance zone. Should this level continue to cap upward momentum, we anticipate a resumption of the bearish trend. Key resistance zones to monitor are located near $4,200 and, more significantly, $4,300. A rejection from these levels would support further downward movement, with our primary bearish target positioned below the $4,000 psychological threshold.
DISCLAIMER: ((trade based on your own decision))
<<press like👍 if you enjoy💚