Lingrid | GOLD Weekly Analysis: Breakout Confirmed, What’s Next?OANDA:XAUUSD concluded a week by breaking above the key levels and reclaiming the $4,200, signaling a continuation of bullish momentum after a period of compression. This breakout from the consolidation pattern suggests that buyers have regained control and are pushing price toward the November high. The 4H chart shows a clear higher low formation, which is a classic sign of underlying strength in an uptrend. However, this victory is not yet complete; it is now entering a critical phase where it must prove its strength by holding above the broken levels and overcoming the formidable resistance area above.
TVC:GOLD has broken out of a triangle pattern, which is trend continuation pattern. Historically, such patterns lead to a measured move upward, targeting the height of the triangle’s base added to the breakout point. While this offers a bullish target near $4,330, a potential pullback from point C might occur before the final leg higher. This pullback scenario is common and should be viewed as a buying opportunity rather than a reversal signal. The monthly chart confirms the broader bullish bias, with price trading well above the monthly low and approaching the October high, a key psychological and technical hurdle that will require strong conviction to overcome.
Looking ahead, the path forward is not guaranteed. The immediate support is now around $4,160, which must hold firm to validate the breakout. A failure to hold this level could lead to a retest of the $4,100 range, potentially triggering a deeper correction. Additionally, next week’s high-impact economic data such Non-Farm Employment Change, Core PCE, and Unemployment Claims—will be pivotal. Strong US data could pressure gold by strengthening the dollar, while weaker-than-expected numbers could fuel the rally. For now, the bias is bullish, but caution is warranted as the market approaches next major test.
If this idea resonates with you or you have your own opinion, traders, hit the comments. I’m excited to read your thoughts!
Trade ideas

Selena | XAUUSD 30M – Trend Support + Liquidity Hunt ScenarioFOREXCOM:XAUUSD OANDA:XAUUSD PEPPERSTONE:XAUUSD
4H candle chart thought
Structure remains bullish as long as the trendline + holding zones hold. Smart-money liquidity sits above previous highs — a break may initiate continuation to extended targets.
📈 Bullish Scenario (Primary Bias)
If price holds above 4,200 and reclaims the entry block:
🎯 TP1 – 4,240–4,245
🎯 TP2 – 4,258–4,260 (Buy-Side Liquidity)
🎯 Final Target – 4,270+
📉 Bearish Invalidations
Break & close below: 4,176
Stronger confirmed reversal below: 4,125
Current Levels To Watch
Resistance 🔴: 4,245 / 4,260 / 4,275
Support 🟢: 4,200 / 4,176 / 4,120
⚠️ Disclaimer: For educational purposes only — not financial advice.

Gold price around 4200 - market waiting⭐️GOLDEN INFORMATION:
Gold Price (XAU/USD) trades in negative territory around $4,195 during the early Asian session on Tuesday. The precious metal edges lower amid concerns that the US Federal Reserve (Fed) will adopt a hawkish tone in its rhetoric, despite delivering a rate cut on Wednesday.
Markets widely expect a 25 basis points (bps) rate cut at the Fed’s December meeting, with traders seeing a 90% probability, up from about 66% in November, according to the CME FedWatch tool. Traders will closely monitor the press conference and a Summary of Economic Projections, or ‘dot-plot,’ for fresh impetus. If the US central bank delivers a "hawkish cut," this could support the US Dollar (USD) and weigh on the USD-denominated commodity price.
⭐️Personal comments NOVA:
Gold price adjusted down around 4200, market mainly sideways before December interest rate
⭐️SET UP GOLD PRICE:
🔥SELL GOLD zone: 4258 - 4260 SL 4265
TP1: $4245
TP2: $4230
TP3: $4215
🔥BUY GOLD zone: 4162 - 4160 SL 4155
TP1: $4175
TP2: $4190
TP3: $4200
⭐️Technical analysis:
Based on technical indicators EMA 34, EMA89 and support resistance areas to set up a reasonable BUY order.
⭐️NOTE:
Note: Nova wishes traders to manage their capital well
- take the number of lots that match your capital
- Takeprofit equal to 4-6% of capital account
- Stoplose equal to 2-3% of capital account

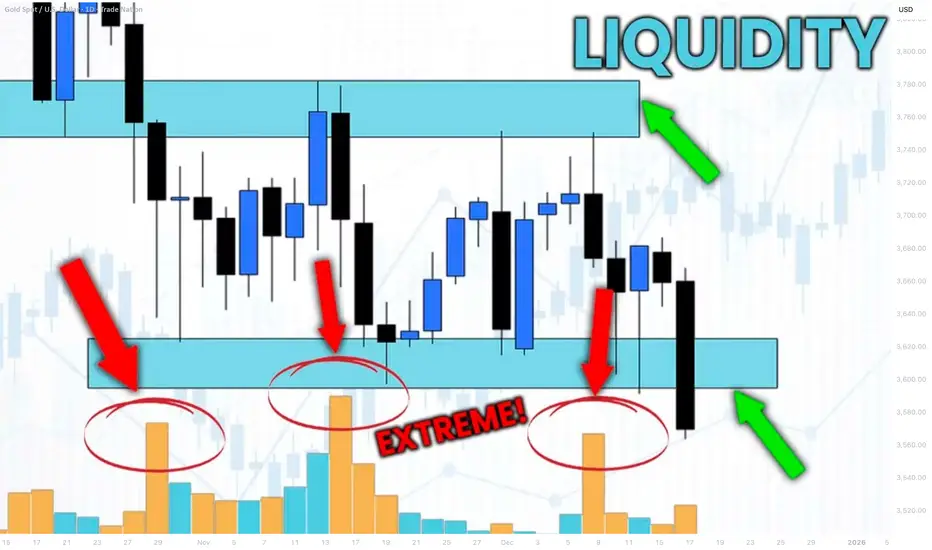
How to Identify Liquidity in Chart with VOLUME Indicator
Smart Money Concept is all about finding the liquidity .
Liquidity analysis is the essential element of profitable trading SMC.
In this article, I will teach you how to use volume indicator to identify liquidity - supply/demand clusters and hidden zones that move the market.
First, let's discuss what exactly we mean by liquidity.
Analysing any forex pair, you should know that orders of the market participants are not equally distributed among all the price levels.
While some levels and the zones will lack the interest of the market players, some will attract huge trading volumes.
We will call such zones - liquidity zones.
To find these zones, you can execute volume analysis.
By using volume indicator, we will look for volume spikes - it will indicate strong buying and selling activity.
Examine NZDUSD chart on a daily time frame with default volume indicator being added.
I highlighted a recent volume spike.
The elevated volume level confirms that there was strong institutional participation in the formation of this candle.
But you can see that this particular candle has quite a wide rage.
So how do we know where exactly and on what levels liquidity concentrates?
We will need to use another indicator to find liquidity zones - a volume profile.
Here is what this indicator does.
Think of the chart as a battlefield. The Volume Profile shows you exactly where the major fighting between buyers and sellers is taking place. It reveals the price levels where the most orders have been executed.
While a classic volume indicator shows when volume occurred, it lights up the specific price levels where the most trading activity is concentrated.
Analyzing Volume Profile on NZDUSD, we can easily find the exact zone where liquidity was concentrated.
We simply take the entire range of a high volume candle and look for a volume profile spike within.
To identify other liquidity zones, continue searching for volume spikes in Volume indicator.
By the way, adding a Simple Moving Average on your Volume indicator will help you find these spikes easier.
Here are 4 significant liquidity zones that I found using this method.
Please, note that there are 3 high volume candles that were formed within the same liquidity zone.
A combination of a classic Volume indicator and Volume Profile will help you to accurately identify the exact moments of volume increase and the price levels where this rise occurred.
That will be a reliable strategy to find important liquidity zones.
❤️Please, support my work with like, thank you!❤️
I am part of Trade Nation's Influencer program and receive a monthly fee for using their TradingView charts in my analysis.
Bulls Are DONE… Bears Ready to ATTACK🎯 Complete & Professional Guide to the Double Top & Double Bottom Pattern
The Double Top and Double Bottom patterns are among the most reliable reversal signals in technical analysis. When identified correctly, they can create low-risk and high-reward trading opportunities.
🔻 1. What Is a Double Top?
A Double Top forms when the price hits a resistance level twice and fails to break above it—showing the market has no strength to continue higher.
Key Characteristics:
The prior trend must be upward
Two peaks form at roughly the same level
A valley forms between the two peaks
Neckline breakout → confirms a sell entry
📉 Core message: Buyers are losing strength; sellers are taking control.
🔹 2. What Is a Double Bottom?
This is the opposite of the Double Top. Price tests a support level twice and bounces each time.
Key Characteristics:
Prior trend must be downward
Two bottoms at the same level
A peak forms between the two bottoms
Neckline breakout → confirms a buy entry
📈 Core message: Sellers are weakening; buyers are stepping in.
📌 3. Structure of Double Top / Double Bottom
Double Top → M-shaped
Double Bottom → W-shaped
Three essential components:
1️⃣ Two equal highs or lows
2️⃣ The neckline
3️⃣ Breakout → main trading signal
🧠 4. Most Important Rule: Breakout of the Neckline = Entry Signal
❌ Two highs or lows alone do NOT confirm a trade.
✔️ A professional entry occurs only after a valid neckline breakout.
🎯 5. Professional Entry Rules
🔻 Sell Entry – Double Top
After the neckline breaks:
Entry: after breakout or during pullback
Stop-loss: above the second top
Take-profit: measure the distance (Top → Neckline) and project it downward (T1)
T2: follow lower swing levels
🔹 Buy Entry – Double Bottom
After the neckline breaks:
Entry: after breakout or pullback
Stop-loss: below the second bottom
Take-profit: distance (Bottom → Neckline) projected upward
🔍 6. What Makes a Valid Pattern?
✔️ 1. Volume Confirmation
Double Top: volume decreases on the second peak → buyer exhaustion
Double Bottom: volume increases on the second bottom → new demand entering
✔️ 2. Proper spacing between two highs/lows
Not too close (noise)
Not too far (pattern loses meaning)
✔️ 3. Strong neckline breakout
Powerful candle + high volume = strongest confirmation
⚠️ 7. Common Mistakes Traders Make
❌ Entering before the neckline breaks
❌ Trusting the shape alone
❌ Ignoring volume
❌ Ignoring higher timeframes
❌ Trading these patterns in non-trending markets
🕒 8. Best Timeframes
Day trading: 15m, 30m, 1h
Swing trading: 4h, Daily
Higher timeframes = fewer fake breakouts and better structure.
🔐 9. Pro Tips for Expert Traders
💡 Double Top is stronger when the second peak creates a fake breakout (small wick above resistance → rejection).
💡 Double Bottom is stronger when the second bottom forms a long lower wick, showing heavy demand.
💡 Always check confirmations:
Volume
Rejection candle / breakout candle
Trendline confluence
RSI or MACD divergences
🎯 10. Simple & Highly Accurate Strategy (Recommended)
Breakout + Pullback = highest probability setup
Example (Double Top):
Entry: pullback to neckline
SL: above second top
TP1: height of the pattern
TP2: previous swing lows

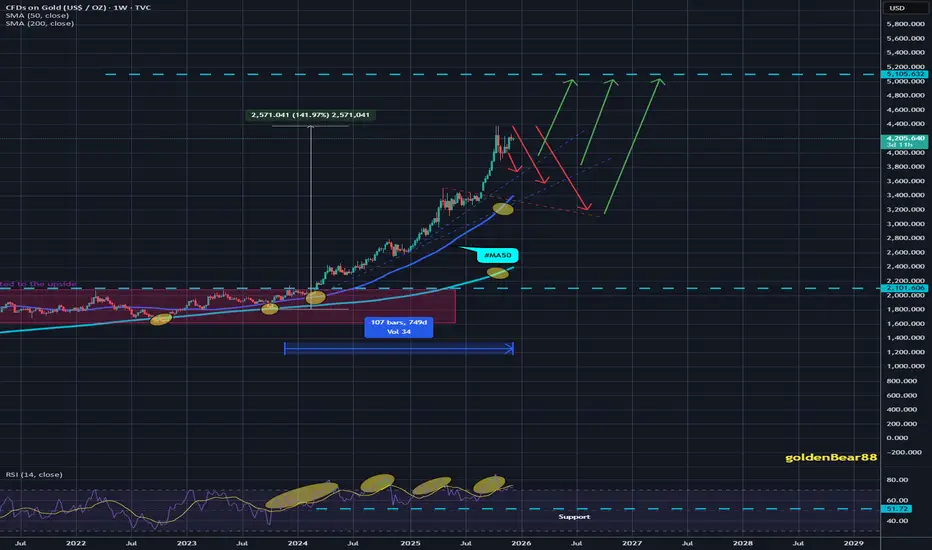
GOLD ANALYSIS (1 W)To understand the psychology in Gold,
I use only two tools:
Fibonacci retracement,
Trend-based Fibonacci extension.
We will use these two tools to measure the weekly cycles.
Since November 2022, Gold has been forming a pattern that can only be explained by Fibonacci principles.
Using Fibonacci retracement for each swing high and low, you'll realize that each retracement equals around 50%.
In only one example, we see that a higher low reaches the 61.8% level, which is also acceptable.
After these retracements, the next leg of the impulsive move always reaches around the 1.618 Fibonacci extension.
According to these two basic technical factors, Gold should first reach around $3,800, and then aim for the $6,600 level during the next impulsive leg in the coming years.
I’m not even going to list all the reasons why Gold tends to go up over time.
Most people reading this analysis are already aware of the fundamentals behind Gold’s long-term bullish nature.
Thanks for reading.

Accumulate at the beginning of the week - the bulls wait⭐️GOLDEN INFORMATION:
Gold (XAU/USD) holds in positive territory near $4,205 in early Asian trading on Monday, supported by expectations of a Fed rate cut at Wednesday’s December meeting.
Although inflation remains above the 2% target, signs of a cooling labor market have strengthened the case for a quarter-point cut to support economic activity. Lower rates reduce the opportunity cost of holding non-yielding gold, helping keep the metal supported.
⭐️Personal comments NOVA:
Gold price maintains accumulation - stable around 4200. Market psychology waiting for big fluctuations this week
⭐️SET UP GOLD PRICE:
🔥SELL GOLD zone: 4250 - 4252 SL 4257
TP1: $4240
TP2: $4230
TP3: $4215
🔥BUY GOLD zone: 4170 - 4168 SL 4163
TP1: $4180
TP2: $4190
TP3: $4200
⭐️Technical analysis:
Based on technical indicators EMA 34, EMA89 and support resistance areas to set up a reasonable BUY order.
⭐️NOTE:
Note: Nova wishes traders to manage their capital well
- take the number of lots that match your capital
- Takeprofit equal to 4-6% of capital account
- Stoplose equal to 2-3% of capital account

GOLD | Bullish Structure Holds After Fed Cut, with correctionalGOLD – Technical Overview
Gold prices are rising after the Federal Reserve delivered a widely expected 25 bps rate cut, even though policymakers offered little clarity on the 2025 policy path.
Despite uncertainty, safe-haven demand, strong central-bank buying, and surging ETF inflows have pushed both gold and silver toward what could be their strongest annual performance since 1979.
Gold is up more than 60% this year, while silver has more than doubled.
Technical Analysis
Gold remains in a bullish structure while trading above 4198, with upside targets at:
→ 4225 → 4237 → 4255 (extended bullish continuation)
A retest of 4198 remains possible before the next move higher.
Above 4198: bullish trend intact, continuation expected
Below 4198 (1H close): bearish momentum activates, opening a deeper correction toward 4152
Pivot Line: 4218
Support: 4198 · 4152
Resistance: 4237 · 4255

Gold indecisive on Year end / I am in huge ProfitTechnical analysis: So far Gold has failed at attempt to invalidate the #4,157.80 - #4,167.80 wall of Support lines on Hourly 1 chart, despite an #3-consecutive sessions of weakness and #1-Month old Resistance zone ahead. Since Support zone managed to showcase strong durability and Price-action delivering almost #45 point uptrend on Intra-day basis, such aggressive spike confirms that Support zone is now even stronger and that area represents the trend’s Ultimate Bottom. Keep in mind on the other side that #4,227.80 benchmark have to be invalidated firstly on Hourly 1 chart to continue the Buying sequence, and with DX on spiral downtrend, is the mix which is keeping Bullish Short-term bias alive. Even though the December #5 trendline was invalidated, Hourly 1 chart was on healthy Descending Channel, DX was testing it’s Short-term Resistance + most importantly Fundamentals which weren’t enough to invalidate much expected Support zone break where market speculators were preventing total Selling domination and full oscillation towards #4,142.80 - #4,152.80 Lower Low’s Lower zone. Interesting fractal on Hourly 4 chart where Price-action was Trading above the Upper zone of Bollinger bands, which was instantly rejected as always Price-action tends to Trade within Bollinger Bands since #2002 Year. Historically, last time Gold was rejected above the Bollinger Bands on Daily chart (January #6 #2021), Gold extended the Medium-term decline of more than #150 points on the aftermath.
My position: I had light break in past few sessions as I've met my Annual Profit Target Months ago and December always is surprise Month for Trading / manipulations, fake-outs etc. I didn't answered to all messages and I am back now with posting my free Daily analysis. I will not Sell Gold at all costs and will continue Buying Gold from my key entry points. Also my Medium-term Buys did the job many times in recent Months and will continue to do so in #2026 Year.

Gold (xauusd): two inverse head and shouldersHi!
Gold continues to show constructive bullish behavior on the 1-hour timeframe, validated by consecutive inverse Head & Shoulders (iH&S) formations that developed around major support areas.
The first iH&S appeared near 4,173–4,180 USD, where price formed a clear left shoulder, deep head, and right shoulder inside a well-defined demand zone. The neckline was broken cleanly, confirming bullish intent. The projected target for this larger pattern lies in the 4,265–4,272 USD region (pink zone), which remains the ultimate upside objective as long as structure holds.
After the breakout, Gold retraced and created another smaller iH&S nested within the broader pattern. This second structure also built its head inside the same support region, highlighting strong buyer defense. Its neckline breakout signals a nearer target at 4,242–4,250 USD (green zone).
Gold is currently trading above the smaller neckline, retesting the breakout level. A successful retest followed by higher lows would likely fuel continuation toward the green zone, and eventually toward the pink zone, completing the larger pattern’s measured move.
Failure to hold above the neckline may lead to a deeper pullback toward 4,185–4,195 USD, but the bullish pattern remains valid unless the head area is breached.
Overall, structure supports a continuation of the uptrend as long as price remains above the neckline and key support levels.
Disclaimer: As part of ThinkMarkets’ Influencer Program, I am sponsored to share and publish their charts in my analysis.

Gold: holds steady pre-FOMCThe price of gold was not in the spotlight of market participants during the previous week. The reason for this is markets' full attention to inflation data and forthcoming FOMC meeting, scheduled for the week ahead. September's PCE data at 2,8% y/y came just a bit lower from anticipated 2,9%, increasing market bets that the Fed might cut rates by 25 basis points. US equities continued to mark weekly gains, however, the price of gold was traded relatively flat, in a range $4.169 up to $4.262.
The RSI was moving around the 60 level, indicating that the market is still more oriented toward the overbought market side. Moving averages of 50 and 200 days are still holding the direction on an uptrend as two parallel lines.
Analysts are commenting that the demand for gold coming from India and China has eased during the past week, as investors are waiting for a price correction in order to continue their purchases. As per current charts, a stronger correction of the gold is not to be expected. The trend line on daily charts points to the support level around the $4.130. This could be easily a short term target for gold in the week ahead. Certainly, it should be considered that the decrease in Feds interest rates increases demand for gold, in which sense, it could be also expected gold's another move toward the $4.260.

GOLD (XAU/USD) Next possible move
📈GOLD (XAU/USD) still in buyers control and technically exhibiting a strong bullish structure.
This H4 order Block ( 4190-4155) presents a favorable entry opportunity for buyers who can take us to 4300
High-possibility market will bounce from this zone

GOLD consolidating within a bullish remain intact.Gold is currently consolidating within a bullish range. As long as the market continues to hold above the 4200 support zone, the bullish momentum is expected to remain intact.
Technically, the trend stays positive—the U.S. dollar is weakening, and the fundamental backdrop is supportive for gold, which increases the probability of continued upside movement.
If buyers defend the support and price maintains strength on the upper side, a break above the 4230 resistance may open the way for the next bullish targets toward 4255 and 4285. This aligns with previous market behaviour and confirms continuation of the higher-trend structure.
However, if the 4200 support fails, the bullish outlook weakens and Gold may fall deeper as downside pressure increases. all in chart over technically strong support 4200
You may find more details in the chart.
Trade wisely best of luck buddies.
Ps; Support with like and comments for better analysis thanks for supporting.

DeGRAM | GOLD will continue to correct📊 Technical Analysis
● XAU/USD is repeatedly rejecting the 4,220–4,240 resistance cluster, forming lower highs near the main resistance line. A breakdown from the rising support line signals weakening bullish momentum.
● The projection shows a clean move toward 4,145 once price loses the green support zone, aligning with the medium-term descending structure.
💡 Fundamental Analysis
● FXStreet notes gold pressure as U.S. labour strength delays rate-cut expectations, supporting bearish continuation.
✨ Summary
● Short bias: resistance holds; targets 4,180 → 4,145.
-------------------
Share your opinion in the comments and support the idea with a like. Thanks for your support!

Accumulation trend - gold price around 4200✍️ NOVA hello everyone, Let's comment on gold price next week from 12/08/2025 - 12/12/2025
⭐️GOLDEN INFORMATION:
Gold (XAU/USD) firmed during Friday’s North American session, holding above $4,200 and heading for a flat weekly close as markets await next week’s Fed policy decision. The metal trades near $4,216 after retreating from intraday highs of $4,259.
The week ended with the Fed’s preferred inflation measure—Core PCE for September—showing little change, hovering closer to 3% than the Fed’s 2% target. While the data alone supports a policy hold, signs of a cooling labor market and dovish Fed commentary keep expectations tilted toward a rate cut
⭐️Personal comments NOVA:
Accumulation trend - waiting for bulls to increase price when interest rates decrease. Maintain stable above 4200
🔥 Technically:
Based on the resistance and support areas of the gold price according to the H4 frame, NOVA identifies the important key areas as follows:
Resistance: $4262, $4305
Support: $4185, $4141
🔥 NOTE:
Note: Nova wishes traders to manage their capital well
- take the number of lots that match your capital
- Takeprofit equal to 4-6% of capital account
- Stoplose equal to 2-3% of capital account
- The winner is the one who sticks with the market the longest

Gold drop
A 320-pip drop on gold right from the 4237.5 resistance I forecasted in the weekly analysis 😉🔥
Hope you caught it!
We’re now over 3R in profit.

How to set % risk per trade based on your statistical dataHey whats up traders today it will be a short one in the bullet points but I believe a valuable points to think about. The setup matters, but the real foundation is how much you risk per trade. If you don’t control this, nothing else works. Your edge collapses. Your psychology collapses. And your results become completely random.
If you are not gambler you most likely risk between 0.5 -2% risk per trade. Good, but why?
Many traders use this risk because it's kind of well known and recommended value risk per trade. Ok, it's relatively safe, but if you don't have it build based on your statistical data. You can be also risking to low while you could make more. So In this post is not about why we should use risk management and calculate if for each position based on SL distance. I already did this post below 👇Click the picture to learn more In this post I will try to give advice how you can calculate best risk per trade for you based on your strategy and risk.
I always recommend backtest at least 300 examples of strategy. When you do that, you know your average win rate on average target. From the tab bellow you can see how many % of trades you need to win with the specific risk reward. Here is also important to consider your ability to hold in the trade. Its amazing to catch 1:5 risk reward trades, but it mostly comes with low win ratio in other words, you will get stopped out few times until you get big trade. Also 1:5 risk reward usually has a pullback during the move. Can you face it without emotions being affected?
Most importantly, you finally understand something every professional lives by: you don’t know the distribution of the trades.
You may have a 65% percent win rate. It still means that you can have 35 losses out of 100 traders. Remember distribution of wins and losses is random , you never know outcome of next trade.
It could be win win loss win. Or loss loss loss win win. Or a brutal streak of seven losses before the market pays you back.
✅✅❌✅❌❌✅✅✅✅❌✅
When wins and losses are evenly distributed it's quite comfortable to continue in opening new trades. You still believe your strategy and it's simply normal to have loss time to time.
✅❌❌❌✅❌❌❌❌❌✅✅
But what you gonna do when such a streak comes? Are you gonna doubt your strategy? Are you gonna look for different strategy? Remember 65% success rate means 35 possible losses out of 100. If 20 losses comes in a row your long term statistics still was not broken.
Dont think this cant happen to you. If this didnt happen to you yet, you are not trading for long enough. It will come and its better to be prepared.
📌 Lets look at the Monte Carlo simulation with our 65% win ratio and 2RR
As we can see on the picture below if you start with 10K and follow your strategy in a short period of one month we can face drawdown and end unprofitable even when we did everything right. Why? We did everything right and we have positive winning ratio and Risk reward
📌 Random distribution of the trades
I don't win every trade, you don't win every trade. No one does. Trading is longterm game and short term result can be a bit random. Because you are might trend trader and market can stay in the range during some months or you are a reversal trader and its still trading against you. So how to beat it - Time.
📌 Lets have a look at the same setup 65% Win rate and 2 RR
But now let's have look at the long-term results. As we can see on chart below. after some time even the worst case distribution is getting in to the profit. However there still was 3 months around break even - Frustrating but its the reality 📌 Lets improve Risk reward to 2.3
You will be getting slightly bigger wins so every loosing streak will be recovered faster.
And you should not stay in the prolonged drawdowns for long periods
📌 Lets improve win ration to 70%
And its even better less often you got loss and 2.3 RR recover slightly better.
📌 So what should be my risk per trade
First done look on how much you want to make, trading is mainly about protecting capital. After you got your statistical data. Run Monte Carlo simulations and try to model the worst case distribution of the trades.
For example if you got 70% win rate - means you can lose 30 trades out of 100. Be ready that it can happen, even its unlikely and if that really happens it means something is wrong with your strategy or you made too much mistakes. But count with it that it can happen.. Setup your risk per trade in such % that you would be comfortable if that happens.
📍 0.25% Risk - 30x Loss = - 7.5%
📍0.5% Risk - 30 x Loss = - 15%
📍1% Risk - 30 x Loss = -30%
📍2% Risk - 30x Loss = - 60%
📍3% Risk - 30x Loss = - 90%
Define what would you be able to accept and be comfortable even during a loosing streak.
📌 Have more accounts
This will give you flexibility. Im running 3x personal accounts. Each with different risk. with copy trading system to distribute my positions. 🎯 Account 1: Here Im opening all trades which I has well defined risk and its A+Setups. If I open a trade on this account they goes automatically to the other 2 accounts. So I got proportionaly this positions on whole capital with 1% risk.
🎯 Account 2: Here are running copied trades from Account 1 + Im opening another positions when I want to add or increase the risk also used for short terms setups. Its 3% risk only form this one specific account and its not copied to other accounts.
🎯 Account 3: Here are running trades from account 1 + This account is also used mainly for the crypto trades and news trading. Trades are also isolated just for this account and not copied to the whole portfolio.
🎯 Prop Firm Trading
For the prop trading where more strict rules Im using completely different approach which I described in this post below 👇Click the picture to learn more Final tip: Try to have strategy with win rate between 65 - 70% and 2 - 2.5 RR.
If you got anything lower than that you can go thru some dark periods, but you will survive if stick to your plan based on the statistics. If you don't have statistical data of your strategy, stop trading for while , step back and do a bit of backtesting Tradingview has great backtesting features.
David Perk aka Dave FX Hunter

XAUUSD weekly closing below 4245H1 TIMEFRAME SETUP
XAUUSD still moving in rising wedge pattern and we have supply at 4243-4246 zone.
XAUUSD is still bullish rall pattern overall 4245 is supply zone.
If H1 &H4 candle closes below 4245 then readyfor the implusive drop towards 4208 then 4200 milestone.
If it's H1-H4 closes above 4250 then don't sell ,Market will test 4280 .
Keep in mind 4245

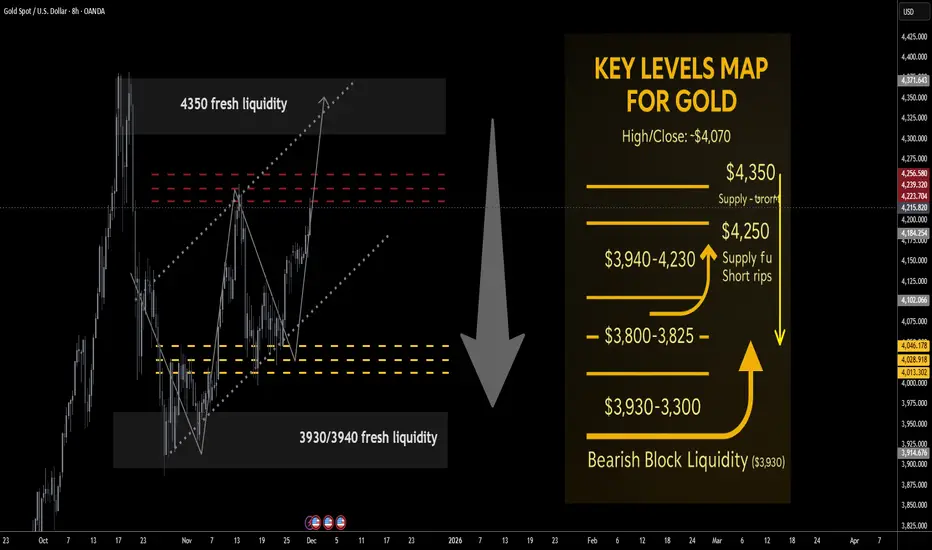
Gold next week Key S/R Levels and Outlook for Traders🔥 GOLD WEEKLY SNAPSHOT — BY PROJECTSYNDICATE
🏆 Swing High / Swing low:
$4,350 → ~$3,930 — clean rejection from the $4,350 bear-liquidity pocket, weekly close back inside prior range and below $4.1k.
📈 Trend:
Structural uptrend still intact above ~$3,900, but near-term momentum has flipped distributive: rallies into $4,250–$4,350 look like supply, not fresh markup. Upside is seen as asymmetric to the downside from overhead resistance.
🛡 Supports:
• $4,060–$4,020: first demand / reaction band below the close.
• $4,000–$3,960: psychological shelf; first downside target on failed rallies.
• $3,940–$3,930: bullish block liquidity — key structural demand; loss of this area risks a deeper de-leveraging leg.
🚧 Resistances:
• $4,200–$4,230: immediate supply from the weekly close; first “sell-the-rip” area.
• $4,250–$4,280: primary bearish liquidity / core short zone.
• $4,300–$4,350: exhaustion band; $4,350 = recent swing high / bear block.
• Stretch: $4,380 prior spike; only expected on an overshoot / stop run.
🧭 Bias Next Week:
Fade strength rather than chase upside.
Base idea: short rips into $4,220–$4,320, scale adds toward $4,350, looking for reversal back into $4,060 → $4,000–$3,960.
• A weekly close above $4,380 would invalidate the short-the-rip bias and open room toward the higher Street targets.
________________________________________
🔝 Key Resistance Zones Short-Side Focus
• $4,200–$4,230: first supply from the weekly close; good area for initial probe shorts.
• $4,250–$4,280: primary bearish liquidity / main take-profit area for trapped late longs.
• $4,300–$4,350: extension / exhaustion band; includes the $4,350 swing high and core “blow-off” liquidity pocket.
• $4,380: prior spike high / stretched stop-run; only expect in a squeeze.
________________________________________
🛡 Support Zones Downside Objectives / Where Shorts Start Covering
• $4,060–$4,020: first reaction band below; scale out partial profits here.
• $4,000–$3,960: key psychological shelf; second profit zone and likely area of responsive dip-buyers.
• $3,940–$3,930: bullish block liquidity; final target for aggressive shorts, and the spot where higher-timeframe bulls are expected to defend. A sustained break below would be a regime change.
________________________________________
⚖️ Base Case Scenario
• Rallies into $4,220–$4,320 encounter selling as late longs de-risk and fresh shorts engage.
• Price fails to sustain above $4,300–$4,350, leaving a wick / rejection on the higher timeframes.
• From there, rotation lower toward $4,060, then $4,000–$3,960 as the primary downside objective.
• Only if the $3,960–$3,930 block cracks cleanly do we start talking about a deeper flush into $3,880–$3,850 as a secondary scenario.
________________________________________
🚀 Breakout / Invalidation Trigger
• Bearish framework invalidation:
o A strong daily/weekly acceptance > $4,380 would suggest bears are trapped and open the door toward $4,450+, in line with the newly raised Street forecasts.
o In that case, shift from short-the-rip to neutral / buy shallow pullbacks until a new top structure forms.
________________________________________
💡 Market Drivers to Watch This Week
• Fed communication and front-end real yields – any hawkish surprise or delay in cuts could extend the correction; dovish surprise risks another squeeze.
• USD index swings around data / politics – sharp dollar bounces favour your short bias from resistance.
• Central-bank headlines (reserve diversification, sanction risk) – supportive in the background but less impactful intraday; use them as context, not trade triggers.
• Geopolitical flare-ups – can create squeezes into your sell zones; be ready for fast spikes into $4,300–$4,350 rather than waiting for slow grinds.
________________________________________
🔓 Bull / Bear Trigger Lines
• Structural bull line:
• Above $3,930–$4,000: long-term bull structure intact; even if you’re tactically shorting rips, treat deep flushes into this band with respect — this is where bigger players are likely accumulating.
• Bear expansion line:
• Below $3,930: opens scope for a faster liquidation wave toward $3,880–$3,850; would indicate that the 2025 blow-off is transitioning toward a broader consolidation or mean-reversion phase.
________________________________________
🧭 Strategy
Use overhead resistance as a place to sell strength, not initiate fresh longs. Expect limited upside and a reversal from liquidity above the market.
1️⃣ Primary Short Setup – Fade the Rips
• Entry zones:
o First scale: $4,220–$4,250
o Add / build: $4,250–$4,280 (primary bear-liquidity block)
o Final add / exhaustion: $4,300–$4,350 (only if tape shows blow-off / stop-run behaviour).
• Stops / invalidation:
o Tactical: hard stop above $4,380.
o More conservative traders can run a soft line at $4,350 and hard stop just beyond $4,380.
• Targets:
o TP1: $4,060–$4,020
o TP2: $4,000–$3,960
o Stretch TP3 (runner): $3,940–$3,930 bullish block.
________________________________________
🌍 Macro Tailwinds
• • Policy / Real Yields
Markets are leaning into lower US real rates and more cuts through 2026, with talk of “fiscal dominance” and persistent deficits. This keeps the medium-term backdrop supportive for gold even after the parabolic run.
• • FX / USD Dynamics
A softer, more volatile dollar driven by rate-cut expectations and concerns over US fiscal sustainability continues to underpin gold on dips, even if short-term dollar squeezes can trigger sharp pullbacks.
• • Flows: Central Banks Still the Backbone
Central banks remain heavy net buyers, with H1 and Q3 data showing robust additions and EM reserve managers diversifying away from sanction-risk USD assets. Recent commentary links record highs to this central-bank bid plus tight physical markets.
• • Flows: ETF & Investor Participation
After several years of outflows, ETF demand has turned back to net inflows, adding to central-bank buying and reinforcing the idea of a higher structural floor in the ~$3.9k area even after corrections.
• • Geopolitics & Safe-Haven Premium
Gold’s 2025 surge is still anchored in elevated geopolitical risk (Russia–NATO tensions, US–China frictions, tariff headlines), plus anxiety about frozen reserves and sanctions. This keeps the safety bid sticky even when positioning looks crowded.
• ________________________________________
GOLD MARKET ANALYSIS AND COMMENTARY - [Dec 08 - Dec 12]At the beginning of this week, international OANDA:XAUUSD prices fell from 4,264 USD/oz to 4,164 USD/oz, then recovered to 4,259 USD/oz, before declining again and closing the week at 4,198 USD/oz.
International gold prices continue to rise, hovering around 4,200 USD/oz as U.S. inflation remains relatively stable and data shows the country’s labor market is clearly slowing, reigniting expectations of interest rate cuts ahead of the upcoming Federal Reserve meeting. According to CME’s FedWatch tool, the market is once again pricing in nearly a 90% probability that the Fed will continue cutting interest rates at next week’s meeting.
According to many experts, an interest rate cut by the Fed at the upcoming meeting may not significantly affect gold prices next week, as this has already been priced into gold during recent trading sessions. However, if the Fed signals more rate cuts in 2026 compared to the guidance given at its September meeting, it could provide a stronger boost for gold prices.
Besides pressure from lower interest rates, the U.S. is also facing a large budget deficit and massive public debt, meaning it will have to inject a considerable amount of money into the economy. This not only carries the risk of driving inflation higher but also poses potential instability for the U.S. economy in particular and the global economy in general.
Overall, the future trajectory of gold prices will depend on whether the Fed continues to ease monetary policy, or whether macroeconomic conditions—such as weaker growth or rising geopolitical risks—emerge. To reach a new all-time high, gold prices will require a combination of more aggressive Fed rate cuts, continued weakening of the U.S. dollar, stronger safe-haven demand, and especially more robust gold buying from central banks.
In addition to the Fed’s monetary policy meeting, the Reserve Bank of Australia, the Bank of Canada, and the Swiss National Bank will also announce their interest rate decisions. The market expects all three central banks to keep interest rates unchanged.
📌Technically, gold is showing signs of sideways movement with a narrowing range on the H4 chart, the resistance level is established around the 4,264 mark, breaking through this level will create momentum for gold prices to find the 4,380 mark. In case gold prices trade below the 4,200 mark, next week the price may only fluctuate in the range of 4,100-4,265 USD/oz.
SELL XAUUSD PRICE 4222 - 4220⚡️
↠↠ Stop Loss 4226
BUY XAUUSD PRICE 4168 - 4170⚡️
↠↠ Stop Loss 4164

Gold indecisive on Year end / I am in huge ProfitTechnical analysis: So far Gold has failed at attempt to invalidate the #4,157.80 - #4,167.80 wall of Support lines on Hourly 1 chart, despite an #3-consecutive sessions of weakness and #1-Month old Resistance zone ahead. Since Support zone managed to showcase strong durability and Price-action delivering almost #45 point uptrend on Intra-day basis, such aggressive spike confirms that Support zone is now even stronger and that area represents the trend’s Ultimate Bottom. Keep in mind on the other side that #4,227.80 benchmark have to be invalidated firstly on Hourly 1 chart to continue the Buying sequence, and with DX on spiral downtrend, is the mix which is keeping Bullish Short-term bias alive. Even though the December #5 trendline was invalidated, Hourly 1 chart was on healthy Descending Channel, DX was testing it’s Short-term Resistance + most importantly Fundamentals which weren’t enough to invalidate much expected Support zone break where market speculators were preventing total Selling domination and full oscillation towards #4,142.80 - #4,152.80 Lower Low’s Lower zone. Interesting fractal on Hourly 4 chart where Price-action was Trading above the Upper zone of Bollinger bands, which was instantly rejected as always Price-action tends to Trade within Bollinger Bands since #2002 Year. Historically, last time Gold was rejected above the Bollinger Bands on Daily chart (January #6 #2021), Gold extended the Medium-term decline of more than #150 points on the aftermath.
My position: I had light break in past few sessions as I've met my Annual Profit Target Months ago and December always is surprise Month for Trading / manipulations, fake-outs etc. I didn't answered to all messages and I am back now with posting my free Daily analysis. I will not Sell Gold at all costs and will continue Buying Gold from my key entry points. Also my Medium-term Buys did the job many times in recent Months and will continue to do so in #2026 Year.
Gold Market Update & Technical OutlookGold currently leans bearish, but the next move will depend heavily on how the price behaves around key intraday levels.
If the 1-hour candle closes above 4230, market structure may begin to shift bullish. In that case, the price could retest the resistance zone near 4253.
A rejection from this zone may lead to a pullback toward previous support before any continuation higher if bullish momentum fails to hold, and price reacts weakly, gold may revisit the medium-term support area between 4200 and 4182, these levels will be important to watch for confirmation of either scenario.
If you found this analysis helpful, feel free to leave a comment and share—thanks!

SHORT GOLDGold has been very bullish but there is a completion of FIB inversion pattern hence a potential downside.. Alway manage risk as you sell.
