Defensive money returns to GOLD as US labor data worsensOANDA:XAUUSD prices maintained a slight decline in the Asian session, trading around $4,075/ounce as the market turned its attention to the Fed meeting minutes. The upside momentum is weakening, but downside pressure remains limited as money flows continue to seek support from the prospect of easing policy.
New data from ADP reinforces the view that the US labor market is losing momentum. The private sector lost an average of 2,500 jobs a week in the four weeks to November 1, as a host of large companies from Amazon to Target announced plans to cut staff. A report from Challenger showed the number of planned layoffs in October was the highest in more than two decades. Jobless claims rose to 1.9 million, and data from the Cleveland Fed showed 39,000 layoff announcements last month.
These signals are emerging just as the market remains concerned about a weakening U.S. economy, even though expectations for rate cuts are not yet firmly established. Still, sentiment has shifted: the FedWatch tool now shows nearly a 50% probability of a rate cut at the Fed’s December meeting, up from below 40% earlier this week. This development has helped gold rebound after three consecutive losing sessions, especially since the precious metal typically benefits in a low-rate environment.
However, gold’s recovery remains relatively fragile. Prices fell more than 3% on Friday and dropped another 1% on Monday as expectations for Fed easing were revised. This has made the market more sensitive to signals from monetary policy and economic data.
The short-term focus is on the minutes of the late-October FOMC meeting and the upcoming nonfarm payrolls report, both to be released this week. Forecasts suggest U.S. job growth may slow to around 55,000 in September—a pace reflecting cooling hiring demand.
Several Fed officials have struck a more dovish tone. Governor Waller described the labor market as “weak” and noted that core inflation is moving closer to the 2% target. Richmond Fed President Thomas Barkin expects upcoming data to offer more clues on the direction of the economy. These comments, combined with the market’s interpretation of soft labor signals, are creating an environment in which each new data point has the potential to significantly impact gold pricing.
In my view, gold is likely to continue trading within a narrow range as the market awaits clearer confirmation from the Fed while simultaneously assessing the risks of a slowing U.S. economy. Rate-cut expectations remain the key factor supporting gold in the current phase.
Technical analysis and suggestions OANDA:XAUUSD
Recovery Trend and Conditions for a New Uptrend
This morning's developments show that gold prices are trying to recover after a long correction, with a bounce back to the $4,070/ounce area, corresponding to the lower border of the medium-term Ascending Channel.
The price structure has remained within the uptrend channel since August, but the momentum has weakened significantly after the price failed twice before the strong resistance zone of $4,216/ounce (Fib 0.236). The $3,972–$3,990/ounce (Fib 0.382) level continues to act as an important buffer zone, and the fact that the price did not break this zone in the recent decline is a positive signal.
RSI hit the oversold zone and is bouncing up, indicating that selling pressure is weakening and the market is entering a rebalancing phase.
For a new uptrend to form, it is necessary:
Necessary condition: price holds above 3,972 USD/ounce, remaining above the rising trend line of the price channel.
Sufficient condition: close above 4,128 USD/ounce and then confirm above 4,216 USD/ounce, the key resistance zone that determines the return to a strong uptrend.
Only when these two conditions are met, the medium-term uptrend structure will be fully restored.
SELL XAUUSD PRICE 4116 - 4114⚡️
↠↠ Stop Loss 4120
→Take Profit 1 4108
↨
→Take Profit 2 4102
BUY XAUUSD PRICE 4025 - 4027⚡️
↠↠ Stop Loss 4021
→Take Profit 1 4033
↨
→Take Profit 2 4039
Trade ideas

GOLD RECOVERS AFTER WEEKEND - CRITICAL WEEK AHEAD💰 GOLD RECOVERS AFTER WEEKEND - CRITICAL WEEK AHEAD ⚡
Current Price: $4,088 - $4,092 📉
Opening Price: $4,171
Today's Range: $4,032 - $4,212
Weekend Change: -6.11% (Monthly decline)
Status: 🟡 RECOVERY MODE - VOLATILE
🎯 WEEKEND RECAP - WHAT HAPPENED?
Gold had a VOLATILE Friday, dropping from $4,235 to test $4,032 lows before recovering. The weekend showed:
❗ Sharp Sell-Off - Price dropped nearly $200 from Thursday's highs
❗ Weekend Gap - Opened lower Monday morning
❗ Bounce Attempt - Trying to recover above $4,088
❗ Critical Support Test - $4,000-$4,050 zone being tested
What's Different This Week?
Markets will focus on FOMC minutes and speeches from monetary policy officials this week
📊 TECHNICAL ANALYSIS
Market Structure: CORRECTIVE PHASE 🟡⚠️
Gold is in a corrective pullback after last week's rally. This is a critical moment - the market is testing support zones to see if bulls can defend or if bears take control.
Pattern: Triangle formation showing trader indecision - pivot point around $4,110 will determine direction
Critical Support Levels (MUST HOLD!) 🔵
Support 1: $4,080 - $4,088 (Current fight zone - CRITICAL!)
Support 2: $4,045 - $4,060 (Strong dip-buy zone)
Support 3: $4,000 - $4,020 (Psychological + deep support)
Support 4: $3,987 - $4,002 (November open - Major)
Support 5: $3,930 (Bullish invalidation - DO NOT BREAK!)
Key Resistance Levels (Recovery targets) 🔴
Resistance 1: $4,110 - $4,120 (Momentum pivot - KEY!)
Resistance 2: $4,150 - $4,165 (Rejection zone)
Resistance 3: $4,187 - $4,200 (Last week's high)
Resistance 4: $4,252 - $4,254 (Major breakout level)
📈 TECHNICAL INDICATORS
RSI (14): ~45-48 (Neutral to slightly bearish) ⚠️
MACD: Bearish crossover forming - Caution! 📉
Stochastic: Oversold zone - Bounce potential ✅
Moving Averages:
Price testing 20-day EMA support 🔴
50-day EMA at $3,800 (long-term support) ✅
Death cross forming on hourly charts ⚠️
Volume: High on decline - institutional selling present
Bollinger Bands: Price touching middle band - volatility compression
🎯 TODAY'S TRADING STRATEGIES
SCENARIO 1: BULLISH RECOVERY 🟢 (45% Probability)
IF Gold Breaks Above $4,110-$4,120:
Closing above $4,110 gives more odds for bull continuation, while closing below gives hand to sellers
LONG Setup:
Entry: Break and hold above $4,112-$4,120
Targets:
TP1: $4,150 📍 (+40 pips)
TP2: $4,187 📍 (+70 pips)
TP3: $4,210 📍 (+90 pips)
Stop Loss: $4,075 (Below support)
Risk/Reward: 1:2 minimum ✅
SCENARIO 2: FURTHER DECLINE 🔴 (40% Probability)
IF Gold Breaks Below $4,060:
This opens door for deeper correction.
SHORT Setup (Scalping):
Entry: Break below $4,058 with volume
Targets:
TP1: $4,020 📍
TP2: $4,000 📍
TP3: $3,987 📍
Stop Loss: $4,090
⚠️ WARNING: This is against long-term trend - smaller positions!
SCENARIO 3: RANGE-BOUND ⚪ (15% Probability)
IF Gold Stays Between $4,060-$4,120:
Range Trading:
Buy: $4,060-$4,070
Sell: $4,110-$4,120
Scalp targets: 30-40 pips
Tight SL: 25-30 pips
💎 BEST TRADE SETUP FOR TODAY
CONSERVATIVE APPROACH (Strongly Recommended!) 🎯
WAIT AND WATCH - Market is at a critical junction!
Option A - Buy the Dip (Preferred):
Entry: $4,045-$4,060 (if it drops)
Target: $4,120 → $4,150
SL: $4,025
Why: Strong support zone with high R:R
Option B - Breakout Play:
Entry: Above $4,122 (confirmed break)
Target: $4,150 → $4,187
SL: $4,095
⚠️ DO NOT CHASE at current price ($4,088-$4,095)! Wait for clear setup.
🌍 FUNDAMENTAL ANALYSIS
THIS WEEK'S KEY DRIVERS 📅
This week moderate volatility expected as markets await FOMC minutes and speeches by monetary policy officials
What to Watch:
FOMC Minutes Release - Critical for rate cut expectations
Fed Speakers All Week - Watch for hawkish/dovish tones
Economic Data - Delayed reports may start releasing
Dollar Strength - DXY testing resistance
BULLISH FACTORS ⬆️
✅ Central banks purchased 634 tonnes YTD, WGC expects 750-900 tonnes total for 2025
✅ ETF holdings grew by 619 tonnes ($64 billion) in 2025
✅ Analysts predict gold may reach $4,456-$4,509 by end of November
✅ Fed rate cut still 63% probability for December
✅ Geopolitical tensions remain elevated
✅ Inflation hedge demand continues
BEARISH RISKS ⬇️
⚠️ Technical Breakdown - Lost $4,200+ levels
⚠️ Strong Dollar - DXY showing strength
⚠️ Profit Taking - After 7% rally last week
⚠️ Overbought Unwinding - Correction from ATH
⚠️ Reduced Safe-Haven Demand - Risk-on sentiment
🔥 MARKET SENTIMENT: CAUTIOUSLY BEARISH SHORT-TERM
What Analysts Say:
Short-term (This Week):
Expected to trade between $4,114 and $4,254 - both upward and downward movements possible
Medium-term (November End):
Gold expected to recover toward $4,200-$4,300 range
Long-term (2025-2026):
Bullish outlook remains - targets $4,500-$5,000
💡 PROFESSIONAL GAME PLAN
For DAY TRADERS:
⚡ Scalp with Caution
Market is choppy and dangerous
Use tight stops (20-25 pips max)
Take quick profits
Trade the bounces/rejections at key levels
For SWING TRADERS:
📊 Wait for Clear Direction
Don't catch falling knife at $4,088
Best entry: $4,045-$4,060 (support bounce)
Alternative: Above $4,122 (breakout confirmation)
Target: $4,200+ (1-2 week hold)
For LONG-TERM INVESTORS:
💎 Accumulation Zone
This dip could be opportunity
Target: $4,000-$4,050 range
Strategy: Dollar-cost averaging
Vision: Hold for $4,500+ (2026)
📅 CRITICAL EVENTS THIS WEEK
Monday (Today):
Market sentiment assessment
Watch for bounce or breakdown
Tuesday-Wednesday:
FOMC minutes release
Fed speakers (CRITICAL!)
Thursday-Friday:
Economic data releases
Weekly close direction important
🎬 BOTTOM LINE (TL;DR)
Price: $4,088 (Volatile)
Bias: 🟡 NEUTRAL-BEARISH (Short-term caution)
Key Level: $4,110 (Above = Bulls, Below = Bears)
Best Action: WAIT for $4,045-$4,060 dip OR $4,122 breakout
Risk Level: HIGH (Extreme volatility)
🔔 TODAY'S CRITICAL BATTLE ZONES
THE LINE IN THE SAND: $4,110
ABOVE $4,110:
✅ Bulls in control
✅ Target $4,150 → $4,187
✅ Recovery mode active
BELOW $4,060:
❌ Bears in control
❌ Target $4,020 → $4,000
❌ Correction deepens
BETWEEN $4,060-$4,110:
⚪ Indecision zone
⚪ Wait for breakout
⚪ High chop risk
📊 TECHNICAL OUTLOOK
Trend: ⚠️ BULLISH (Long-term) but CORRECTING (Short-term)
Momentum: WEAK - Bearish pressure 📉
Support: TESTING at $4,080 🔴
Resistance: STRONG at $4,110-$4,120 🚧
Pattern: Descending triangle / Bull flag correction
Next Move: Break $4,110 = UP | Break $4,060 = DOWN
⚠️ RISK MANAGEMENT - CRITICAL TODAY!
✅ Smaller Positions - Market is volatile (1% risk max)
✅ Wider Stops - Give trades room (40-50 pips)
✅ Quick Profits - Don't be greedy, lock gains fast
✅ Respect $4,110 - This is THE level today
✅ Avoid Revenge Trading - If stopped, step away
🎯 SWING TRADE SETUPS
Setup A - Dip Buy (Recommended):
Entry: $4,045-$4,060 (wait for this!)
Target 1: $4,120 (Hold 2-3 days)
Target 2: $4,187 (Hold 5-7 days)
Target 3: $4,252 (Hold 1-2 weeks)
Stop Loss: $4,020
Setup B - Breakout Recovery:
Entry: $4,125-$4,130 (after confirmed break)
Target 1: $4,187 (Hold 3-5 days)
Target 2: $4,252 (Hold 1 week)
Stop Loss: $4,090
🏆 PROFESSIONAL ANALYSIS SUMMARY
Gold is at a CRITICAL CROSSROADS. After rallying 7% last week, the market pulled back sharply on Friday, testing support levels.
The Setup:
Gold rose to $4,091.53, up 0.19% but down 6.11% over the past month
Testing key support at $4,080-$4,088
$4,110 is the pivot - direction depends on this level
Most Likely Scenarios:
Scenario 1 (45%):
Brief consolidation → Break $4,110 → Recovery to $4,150-$4,200
Scenario 2 (40%):
Drop to $4,045-$4,060 → Strong bounce → Retest $4,110
Scenario 3 (15%):
Chop between $4,060-$4,120 for 1-2 days
The Big Picture:
Long-term trend is STILL bullish. This is likely a healthy correction before next leg up. Analysts still expect $4,456-$4,509 by end of November
💪 TRADING PSYCHOLOGY TIP
DON'T PANIC! Corrections are NORMAL and HEALTHY. Last week gold rallied 7% - it NEEDS to rest. Use this dip as opportunity, not fear. The long-term trend hasn't changed! 🚀
🎓 KEY LESSON: THE PIVOT POINT
Today's pivot is $4,110. In trading, pivot points are levels where price "decides" direction. Think of it like a seesaw:
Above $4,110 = Weight shifts to bulls
Below $4,110 = Weight shifts to bears
Action: Wait for price to choose a side, then follow!
🔮 WEEK FORECAST
Monday: Consolidation $4,060-$4,120 (Today)
Tuesday: FOMC minutes could spark breakout
Wednesday: Direction becomes clear
Thursday-Friday: Follow-through in chosen direction
Week End Target: $4,150-$4,200 OR $4,000-$4,040
🚨 CRITICAL WARNINGS
⚠️ FOMC Week - Expect HIGH volatility
⚠️ Don't Catch Falling Knife - Wait for support
⚠️ Triangle Pattern - Indecision = dangerous
⚠️ Weekend Gap Risk - Price can gap Monday AM
⚠️ False Breakouts - Confirm with volume
📊 SUPPORT/RESISTANCE SUMMARY
Strong Support: $4,045, $4,000, $3,987
Weak Support: $4,080, $4,060
Weak Resistance: $4,110, $4,120
Strong Resistance: $4,150, $4,187, $4,252
Breakout Level UP: $4,122
Breakdown Level DOWN: $4,058
⚠️ FINAL DISCLAIMER
This analysis is for educational and informational purposes only. Gold trading is highly volatile and risky, especially this week with FOMC minutes. Never risk more than 1-2% per trade. Always use stop losses. Past performance does not guarantee future results. The information provided is not financial advice. Consult a licensed financial advisor before making investment decisions.
📱 Stay sharp this week!
💬 Share your trades carefully
🔔 High volatility = High opportunity but HIGH RISK
⚡ Follow for updates as market develops
#Gold #XAUUSD #ForexTrading #TechnicalAnalysis #TradingView #FOMC #MarketAnalysis #DayTrading #SwingTrading #RiskManagement #TradingStrategy #GoldForecast #VolatilityTrading

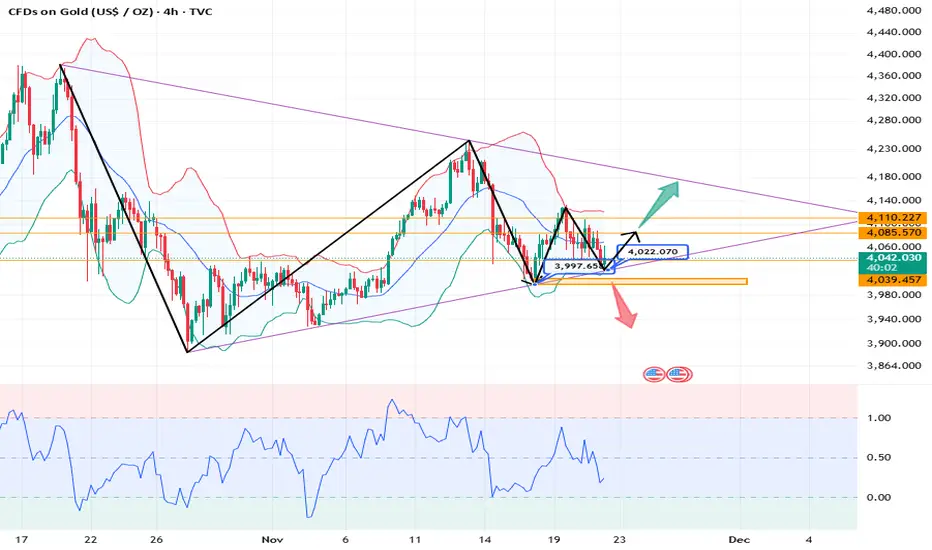
Gold rebound presents an opportunity,Why wait and do nothing?Following the release of supplementary US non-farm payroll data for September, the relatively strong job growth coupled with a resurgence in the unemployment rate has once again created a contradictory situation in the market. This has also led to growing disagreement within the Federal Reserve regarding whether to continue cutting interest rates in December. Judging from the recent tone of Fed officials' speeches, most officials lean towards a conservative and cautious approach, believing that maintaining the current interest rate is appropriate. The recent performance of the US dollar index best illustrates this point, putting significant pressure on gold, which has repeatedly weakened. However, there is clear buying interest at lower levels, with each sell-off followed by a rapid rebound, though the momentum has been weak. Intraday, gold retraced to around 4060, quickly rebounded to around 4080, and then fell back again. During the European session, it broke below the key short-term support around 4040, accelerating its decline and briefly touching around 4022. It then fluctuated before gradually stabilizing around 4030. Currently, the US session has seen another rapid rebound, mirroring yesterday's pattern. The recommended strategy is to look for opportunities to short after rallies. The short-term tone is set, and market sentiment is destined to be weak; at least avoid excessive shorting at lower levels.
Gold Trading Strategy: Sell gold in batches around 4080-4100, with a target of 4060-4030.
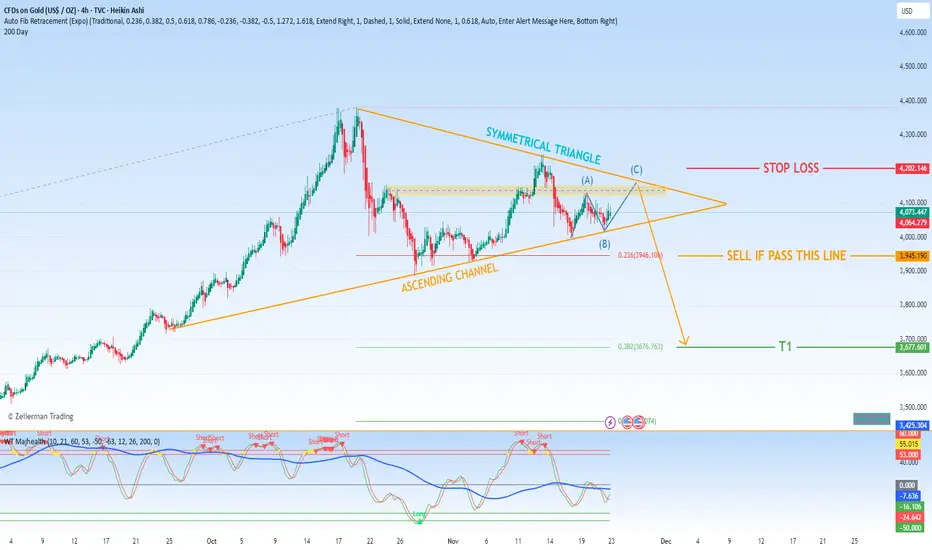
Technical Analysis & Trading Plan for $GOLDThe technical chart for TVC:GOLD is currently exhibiting a compelling and potentially powerful pattern configuration. The primary structure is an ascending channel, characterized by a consistent series of higher lows and higher highs. Contained within this broader channel, the price action has also begun to consolidate into a symmetrical triangle. This triangle is identified by converging trendlines, where the resistance is sloping downward and the support is sloping upward, creating a coil-like formation.
This pattern confluence is significant. The ascending channel provides the underlying bullish bias, while the symmetrical triangle represents a period of consolidation and equilibrium between buyers and sellers. A decisive breakout from this triangle, especially on high volume, typically signals the resumption of the prior trend and can lead to a powerful, directional move.
2. Key Technical Levels and Trade Execution Strategy
Our trading plan is built around the anticipated resolution of this symmetrical triangle.
Stop Loss (Risk Management): A stop loss is placed at 4,200. This level should be positioned logically below a key support structure, such as the lower boundary of the ascending channel or a recent significant swing low. Its purpose is to automatically exit the trade if the price action invalidates the bullish pattern, thus defining and limiting our maximum risk.
Profit-Taking Strategy (Tiered Exit):
Take Profit 1 (TP1): 3,637.763 (0.382 Fibonacci Retracement) - This is our primary profit-taking target. The 0.382 Fibonacci level is a common and respected retracement zone where one can expect some resistance during a pullback. Securing profits here locks in gains and reduces risk for the remainder of the position.
3. The Critical Trigger: Managing a Bearish Move
The analysis includes a specific contingency plan for a bearish outcome. The 0.236 Fibonacci level at 3,946.106 is not a take-profit level but a critical trigger level for action.
If the price declines and closes below 3,946.106, it serves as an early warning signal. This breach suggests that selling pressure is overcoming buying pressure and increases the probability that the price will continue to fall toward our TP1 level at 3,637.76.
Therefore, a break below 3,946.106 is the trigger that validates the sell signal and activates our profit-taking strategy at TP1.
In Summary:
The current setup for TVC:GOLD shows a bullish structure (Ascending Channel) undergoing consolidation (Symmetrical Triangle). Our base case is to wait for a bullish breakout. However, this plan specifically outlines the strategy for a bearish move:
Monitor the 0.236 Fibonacci level at 3,946.106.
If this level is broken, it triggers a sell signal.
Execute the trade with a profit target at the 0.382 Fibonacci level (3,637.76) and a stop loss at 4,200 to manage risk.
This creates a defined, rules-based approach to capitalize on a potential downward move within the broader pattern.
Once again, perfectly capturing gold trading opportunitiesIn yesterday's gold strategy, we emphasized the rebound correction at the 4000 level and the short position at 4080, and the market action has fully materialized! Congratulations to those who followed our advice.Gold is currently dominated by bears, and the overall structure remains weak. Short-term support levels to watch are the 4040-4030 area and strong support around 4000. Resistance remains concentrated in the 4080-4100 area. If the price rebounds to this area and fails to break through, short positions can still be considered. In short, the core logic for today remains unchanged: a weak, downward-trending market. Trading should focus on the aforementioned support and resistance levels, patiently waiting and positioning. The slower pace of the market movement means a longer trading cycle, thus requiring more patience in executing each trade. Until the trend changes, our overall strategy remains to primarily short at higher levels during rebounds, supplemented by buying on dips, proceeding steadily and following the trend.

Xauusd Possible Scenarios (Next 24–48 Hours)1. Market Structure
Gold recently made a strong bullish rally (left side of chart), followed by a sharp correction and is now consolidating in a sideways range.
Current structure shows:
Lower highs forming
Higher lows weakening
Price compressing → triangle / squeeze zone
This indicates indecision and a potential big breakout coming soon.
📈 Bullish Scenario
Gold climbs back above 4106, holds, and breaks the trendline.
Target 1: 4150
Target 2: 4200
Target 3: 4250
Bullish trigger: Break and close above 4120 on 4H.
📉 Bearish Scenario
If price breaks 4000 – 4030 support:
Target 1: 3985
Target 2: 3920
Target 3: 3870
Bearish trigger: Strong 4H candle close below 4025.
For More Updates Stay Tuned

Gold bulls launch a counterattack!
news:
On Wednesday (November 19), spot gold rose modestly for the second consecutive trading day, attempting to extend the previous day's rebound from the psychological level of nearly $4,000 per ounce, and is currently trading around $4,100. Overnight declines in Wall Street stocks indicate that market concerns about the US economy have led to fragile risk sentiment, putting dollar bulls on the defensive.
This, coupled with the ongoing geopolitical risks stemming from the Russia-Ukraine conflict, has become a key factor supporting the rise of the safe-haven precious metal.
technology:
From an hourly perspective, the $4,100 level may become a direct resistance level. If it can be effectively broken, it may trigger short covering and push gold prices to test the intermediate resistance of $4,150-$4,145, and then move towards the $4,200 mark.
Signal:
buy:4075-4080 SL:4065 TP:4140-4175

Accumulated price zone 4100, there is a recovery✍️ NOVA hello everyone, Let's comment on gold price next week from 11/24/2025 - 11/28/2025
⭐️GOLDEN INFORMATION:
Gold (XAU/USD) holds firm in Friday’s North American session after Fed officials signaled the possibility of a December rate cut. The metal trades near $4,096, up 0.53%, after briefly touching $4,101.
Despite mixed US data and shifting rate expectations, XAU/USD has moved sideways for the past three days as traders remain uncertain about its next direction. Recent Fed commentary and the return of key economic releases suggest a steady economy with a strong labor market and persistent inflation pressures
⭐️Personal comments NOVA:
Gold price accumulates around 4100, showing signs of recovery when breaking the short-term downtrend
🔥 Technically:
Based on the resistance and support areas of the gold price according to the H4 frame, NOVA identifies the important key areas as follows:
Resistance: $4133, $4242
Support: $4033, $3982
🔥 NOTE:
Note: Nova wishes traders to manage their capital well
- take the number of lots that match your capital
- Takeprofit equal to 4-6% of capital account
- Stoplose equal to 2-3% of capital account
- The winner is the one who sticks with the market the longest

XAU/USD – Inverse H&S Forming, Gold Eyes Bullish Reversal🔍 Market Context
Early today, Gold dropped nearly 70 points, but immediately rebounded strongly from 4040, signaling aggressive BUY interest and a clear rejection of downside continuation.
On the H2 chart, XAU/USD is shaping a clean Inverse Head & Shoulders pattern — a classic reversal structure that often precedes a strong bullish expansion.
The macro layer for today is packed with high-impact catalysts:
📌 Key Data & Events – 20 Nov
Speech by U.S. President Donald Trump
Barkin (2027 FOMC voter) speaks on economic outlook
Federal Reserve FOMC Meeting Minutes
Williams (permanent FOMC voter) speech
U.S. Unemployment Rate
Non-Farm Payrolls (NFP)
Initial Jobless Claims
➡️ A heavy news lineup capable of triggering high volatility and validating (or rejecting) the reversal pattern.
📊 Technical Analysis – MMF View
Gold bounced sharply from BUY ZONE 4044–4046 with strong volume.
The market structure is creating a complete Inverse H&S formation.
The Neckline Zone 4101–4111 is the key breakout level — clearing this zone opens the door for a full bullish reversal.
Trendline compression + liquidity sweeps show buyers gaining control.
Strategy for today: BUY bias. SELL only for quick scalps.
🎯 MMF Daily Trading Plan
BUY (Priority Setup – Swing / Intraday)
Buy 4046–4048
SL: 4039
TP: 4060 → 4085 → 4100 → 4125
✔️ BUY aligns with the reversal pattern + fresh liquidity shift.
SELL (Scalping Only)
Sell 4146–4148
SL: 4154
TP: 4132 → 4120 → 4110
✔️ SELL only if price taps liquidity at upper supply and rejects clearly.
⚠️ Key Levels to Watch
4101 – 4111 – 4142 → liquidity clusters + breakout confirmation
4029 → major support in case volatility spikes from news
🧠 MMFLOW TRADING Outlook
If Gold holds its corrective pullback and breaks above the Neckline (4101–4111), we may see a strong continuation toward:
4146 → 4187 → 4210+
The Inverse H&S on H2 is a powerful bullish setup — smart positioning favors building long exposure and holding into high-impact events.

GOLDDO YOU KNOW WHATS BEHIND THIS OR OTHER IDEAS?? in bio..
Preferably suitable for scalping and accurate as long as you watch carefully the price action with the drawn areas.
With your likes and comments, you give me enough energy to provide the best analysis on an ongoing basis.
And if you needed any analysis that was not on the page, you can ask me with a comment or a personal message.
Enjoy Trading ;)

Bullish Analysis. (Gold) SL Hit🟦 POST READY TO SHARE
📉 Losing Trade… with the Right Analysis (XAU/USD)
Today I’m sharing a trade that ended in Stop Loss, but delivered a huge lesson.
And yes — I don’t only post winners. Transparency builds real traders.
🔍 What was the idea behind the trade?
• Mitigation of the FVG
• ChoCH at demand
• Reaction at the 5M OB
• Fake Out sweeping liquidity
• BOS confirming bullish intent
• Full institutional sequence:
Liquidity → Mitigation → Rejection → Expansion
🎯 So, what happened?
Price completed:
✔ The liquidity sweep
✔ The mitigation
✔ The rejection
✔ The bullish BOS
✔ The entire push to TP1 and TP2
BUT before taking off…
👉 it swept my SL by just a few pips.
Classic gold manipulation.
🧠 Professional lesson
This wasn’t a bad analysis.
This wasn’t misreading structure.
It was gold doing what gold does — deeper liquidity sweep before expansion.
This doesn’t invalidate my idea.
It validates my vision.
💬 Motivational message
“Great traders aren’t built by wins… they’re built by process.
A losing trade doesn’t lower your level — it sharpens it.
Those who only show wins aren’t growing…
those who show the journey build consistency.”

XAUUSD H4 | Bullish Bounce off Key SupportMomentum: Bullish
Price is currently above the ichimoku cloud.
Buy entry: 4,010.78
- Strong pullback support
- 78.6% Fib retracement
- 161.8% Fib extension
Stop Loss: 3,928.49
- Multi-swing low support
Take Profit: 4,109.35
- Overlap resistance
High Risk Investment Warning
Stratos Markets Limited (tradu.com/uk ), Stratos Europe Ltd (tradu.com/eu ):
CFDs are complex instruments and come with a high risk of losing money rapidly due to leverage. 70% of retail investor accounts lose money when trading CFDs with this provider. You should consider whether you understand how CFDs work and whether you can afford to take the high risk of losing your money.
Stratos Global LLC (tradu.com/en ): Losses can exceed deposits.
Please be advised that the information presented on TradingView is provided to Tradu (‘Company’, ‘we’) by a third-party provider (‘TFA Global Pte Ltd’). Please be reminded that you are solely responsible for the trading decisions on your account. Any information and/or content is intended entirely for research, educational and informational purposes only and does not constitute investment or consultation advice or investment strategy. The information is not tailored to the investment needs of any specific person and therefore does not involve a consideration of any of the investment objectives, financial situation or needs of any viewer that may receive it. Past performance is not a reliable indicator of future results. Actual results may differ materially from those anticipated in forward-looking or past performance statements. We assume no liability as to the accuracy or completeness of any of the information and/or content provided herein and the Company cannot be held responsible for any omission, mistake nor for any loss or damage including without limitation to any loss of profit which may arise from reliance on any information supplied by TFA Global Pte Ltd.

TOMORROW SELL ENTRY A sell at 4054-60 any moment after market open with sl at 4080 and tp at 4000 or 3970

GOLD DAILY CHART ROUTE MAPHey everyone,
Please review our Daily Chart Route Map, now featuring updated levels for tracking Golds movement.
We continue to track our refreshed proprietary Goldturn Channel, our unique method for constructing ascending channels. Price action is now testing the swing range and the swing range seems to be holding support as expected. This swing range support also falls inline with the channel half line providing stronger support.
As long as ema5 remains above the swing zone we expect price to play between this range until the full updated long term swing is completed into 4145. An ema5 break below the swing range will open the lower channel floor for test, currently sitting at 3824
As always, we will keep you all updated with regular updates throughout the week and how we manage the active ideas and setups. Thank you all for your likes, comments and follows, we really appreciate it!
Mr Gold
GoldViewFX

XAUUSD H4 Market OutlookGold Outlook: Market Flashes Early Reversal Signals
Weekly Overview
- Gold closed the week at $4085.83, up 2.11%, but the rally is already showing cracks. Price failed to stay above the critical 50% monthly retracement at $4133.95, which instantly weakens the bullish narrative. Add the sharp rejection from $4245.20, and you’re looking at a market that’s losing follow-through right where buyers needed to dominate.
Fundamentals
- The 43-day U.S. government shutdown left holes in key economic data; CPI and NFP may never be published, so the Fed is flying partially blind into the December meeting. That uncertainty alone distorts every macro-driven asset, including gold.
- The Michigan Index is down 30% YoY, scraping near 1978-level pessimism. ADP shows job cuts averaging 11,000/week. Confidence is fragile, and the Fed remains split after two rate cuts this year.
Technical Breakdown
- Gold’s biggest job this week was simple: hold above $4133.95. It didn’t. That failure keeps that level as immediate overhead resistance.
Bullish Requirements
- Reclaim $4133.95
- Break and hold above $4245.20
- Only then does a push toward the record high at $4381.44 become realistic
Bearish Threats
- Last week’s rejection from $4245.20 is the textbook starting to point if buyers don’t return fast, sellers have clean downside targets:
- $3886.46 (minor swing low)
- $3846.50 → $3720.25 (retracement zone)
- Momentum already shows signs of fatigue.
Forward Bias
- The long-term trend is still up, but the weekly structure has shifted from “confident rally” to “prove it or lose it.”
- Until price decisively reclaims $4133.95, expect choppy action with a downside lean; especially if Fed minutes or Michigan sentiment reinforce uncertainty instead of relief.

Gold weekly chart with buy and sell levelsNo big update this week heading away for a few days.
As always wait for levels these levels will come into play all week

GOLD Bullish Breakout! Buy!
Hello,Traders!
GOLD broke out of the bullish flag, confirming bullish momentum after absorbing sell-side liquidity. With structure shifting upward, price may extend toward the buy-side liquidity resting at the marked target level.Time Frame 5H.
Sell!
Comment and subscribe to help us grow!
Check out other forecasts below too!
Disclosure: I am part of Trade Nation's Influencer program and receive a monthly fee for using their TradingView charts in my analysis.

If the price consolidates above $4110 then next target $4122I think that if the price stays above $4110 then a next target could be $4122.
Identified levels in yellow are from the Ichimoku reading system.

Gold looking for shortsgold looking good for some more downside in the upcoming days.
4111$ region looks great for some shorts.

Nov 18, 2025 - XAUUSD GOLD Analysis and Potential Opportunity📊 Analysis:
The overall momentum remains bearish, and the main plan today is to sell rallies into resistance.
Only if price breaks above 4055 will there be signs of bullish recovery.
If price falls below 4030, bearish momentum is likely to strengthen further.
🔍 Key Levels to Watch:
• 4075 – Resistance
• 4065 – Resistance
• 4058 – Resistance
• 4045–4050 – Resistance zone
• 4030 – Key intraday support
• 4020 – Support
• 4007 – Support
• 4000 – Psychological level / support
📈 Intraday Strategy:
SELL: If price breaks below 4030 → target 4025, with further downside toward 4020, 4015, 4007
BUY: If price holds above 4046 → target 4050, with further upside toward 4055, 4058, 4065

GOLD Near supporting region? What's next??#GOLD... market just retest again our last week supporting area.
That was around 4050-56
Keep close and holding if that area means we can expect again bounce from here.
Good luck
Trade wisely

Gold 4H – Liquidity Plays Ahead of Fed Minutes & PMI Data🥇 XAUUSD – Weekly Smart Money Outlook | by Ryan_TitanTrader
📈 Market Context
Gold continues to trade inside a controlled 4H consolidation as markets brace for a highly event-driven week: U.S. PMI releases, updated Fed guidance, and renewed debates over the timing of future rate cuts.
Recent data has shown mixed momentum — softer employment trends but steady business activity — keeping the dollar volatile and gold reactive near mid-range liquidity.
Institutional flows remain cautious, reducing aggressive positioning ahead of major macro catalysts. This environment typically leads to engineered sweeps on both sides of the range as Smart Money hunts liquidity before revealing direction.
Expect short-term volatility spikes, especially around U.S. session opens and PMI releases.
🔎 Technical Analysis (4H / SMC View)
• Price is navigating a minor bearish structure, forming lower highs while protecting deeper liquidity beneath 4020.
• The recent 4H BOS + corrective pullback suggests the market may generate a liquidity grab toward the discount zone before any strong bullish leg develops.
• A Premium Sell Zone at 4225–4227 sits above resting liquidity, making it an ideal region for stop hunts and short-term distribution.
• The Discount Buy Zone at 4010–4008 aligns with structural reaction points, unmitigated demand, and a liquidity shelf — ideal for accumulation.
• Mid-range liquidity around 4060–4080 may be swept before the market chooses a larger weekly direction.
🟢 Buy Zone: 4010–4008
SL: 4000
TP targets: 4085 → 4120 → 4175 → 4220
Rationale:
• Deep discount zone beneath 4H liquidity
• Confluence of demand + structural mitigation
• High probability of engineered sweep before bullish expansion
🔴 Sell Zone: 4225–4227
SL: 4235
TP targets: 4175 → 4120 → 4060 → 4015
Rationale:
• Premium supply above equal-high liquidity
• Favors stop hunt + distribution before correction
• Aligns with previous 4H rejection and imbalance fill
⚠️ Risk Management Notes
• Wait for M15 ChoCH / BOS inside each zone before entering — avoid blind entries.
• Expect spreads and liquidity manipulation around news: US PMI, Fed speeches, and data surprises.
• Avoid trading 10–20 minutes before high-impact events.
• Scale partial profits at each structural target to secure gains and let runners develop.
✅ Summary
Gold remains trapped in a structured 4H range where Smart Money is likely to sweep one side before delivering a decisive expansion.
Discounted buys at 4010–4008 and premium sells at 4225–4227 remain the highest-probability weekly setups.
Stay patient, respect liquidity, and follow confirmation.
🔔 FOLLOW @Ryan_TitanTrader for more weekly SMC setups 🚀

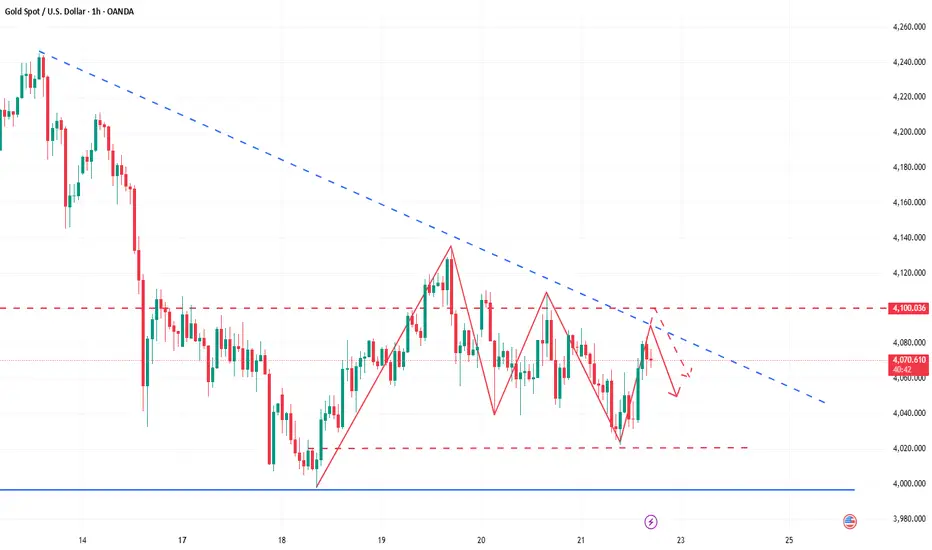
XAUUSD: Market Analysis and Strategy for November 21Gold Technical Analysis:
Daily Resistance: 4150, Support: 4000
4-Hour Resistance: 4110, Support: 4010
1-Hour Resistance: 4085, Support: 4020
Technically, the weekly chart is likely to close with a doji today. Yesterday's daily chart closed with a doji, indicating a slowdown in the short-term upward trend and exacerbating the expectation of sideways consolidation. The Bollinger Bands are also narrowing, and the effectiveness of the 4040 support level needs to be monitored today. Meanwhile, the 4000 level is being tested again. If 4020 is broken, a short-term sell signal can be adopted. If the price can hold above 4085, a buy signal can be adopted, with the 4140/4150 area to be watched again. Long-term holders can still look for buying opportunities around the 3930/3920 level;
Looking at the 1-hour chart, gold rebounded after the European session, but after breaking below 4080, there's a possibility of further downside in the short term. Watch for support around 4020;
For the European and American sessions, the plan is to consider buying if a stabilization signal appears around 4005/4000.
Trading Strategy:
SELL: 4078~4085.
BUY: 4005~4000.
More Analysis →