XAUUSD BULLISH OR TRAP (READ CAPTION)Hi traders what do you think about gold
Gold (XAUUSD) is currently showing a bullish structure, as price is holding above key support levels and forming higher-low patterns. Buyers are active near the lower zones, indicating strength for potential upside continuation.
🔹 Support: 4200
This is the primary support level where buyers previously reacted strongly.
As long as price stays above 4200, the bullish bias remains intact.
🔹 Second Support: 4191
This level represents strong secondary support and a deeper retracement area.
If the market pulls back to 4191, buyers are expected to re-enter and push the market upward.
🔹 Resistance Zone: 4220
This is the near-term resistance where market may slow down or face minor rejection.
A clean breakout above 4220 will confirm bullish continuation.
🔹 Supply Zone: 4240
This is the main upside target.
If price breaks above 4220, the next stop is the 4240 supply zone, where sellers may attempt to react.
A strong breakout above 4240 can shift Gold into a larger bullish trend.
📈 Market Outlook
Holding above 4200 & 4191 → Strong bullish continuation probability
Break above 4220 → Opens the path toward 4240 supply
4240 zone will decide next major move (either rejection or breakout continuation)
The overall structure supports a bullish pullback + continuation setup for upward momentum.
please don't forget to like comment and follow
Trade ideas

Can Gold Reach 4265? US Session Strategy Update.
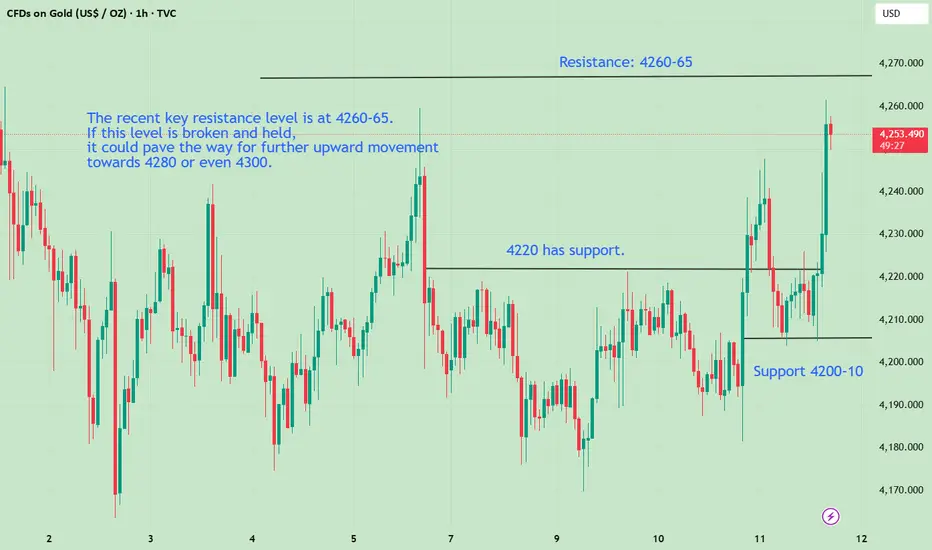
Gold prices rebounded after a brief dip this trading day, consolidating at higher levels. Throughout the day, it remained firmly above the key support level of 4200, indicating a clear bullish bias. Our strategy of buying in batches between 4200 and 4210 was wise, yielding multiple profitable buy-low-sell-high trades. In the US session, positive initial jobless claims data further boosted gold. The key resistance level recently is 4260-65. Watch this level closely; a break and hold above it could lead to further gains towards 4280 or even 4300. The key is whether the US session can break the current stalemate.
Today, you must seize every opportunity to buy on dips. If you struggle with precise execution, try my method: first test the market with a small position, then add to your position on pullbacks. This way, you won't miss any opportunities. If you need to recover significant losses or obtain precise trading signals, you can...
True high-level trading isn't about sifting through massive amounts of information, but about extracting the essence, focusing on the most effective signals, repeatedly applying them, and continuously optimizing them. The simpler the strategy, the more stable the results. The more focused the execution, the more profitable you'll be in the face of market volatility. Our stable returns are the best proof.
XAU/USD Elliott Wave Analysis: Potential Bearish Reversal OANDA:XAUUSD PEPPERSTONE:XAUUSD ICMARKETS:XAUUSD
The chart suggests that Gold Spot/U.S. Dollar (XAU/USD) has completed a major correction pattern and is now on the verge of a significant downward move.
Major Correction (A) ➡️ (B):
The price action from the major peak appears to be forming a complex correction, with the current phase completing the major (B) wave.
The sharp drop to the low around November 1st is labeled as a major (A) wave.
The subsequent rally is labeled as the major (B) wave, which is currently subdividing.
Subdivision of Wave (B): The corrective rally (B) is showing signs of completion as a smaller ABC pattern:
o Wave A (of B): A strong 5-wave impulse (labeled 1-2-3-4-5) completed in mid-November.
o Wave B (of B): A correction followed this high.
o Wave C (of B): The current rally is the final leg, Wave C (of B), aiming for the final target.
• Critical Reversal Target for (B) Wave: The chart anticipates the completion of the final Wave C (of B) at a specific price point, coinciding with a key Fibonacci level and trendline resistance:
61.80% Fibonacci Retracement at $4,313.88
This $4,313 zone is the high-probability reversal point before the major downside move begins.
📈 Technical Levels and Trendlines
Major Resistance (The Reversal Zone):
Upper Red Trendline: This descending trendline connects the initial peak with the top of the internal Wave (B), serving as strong dynamic resistance.
Key Price Target: The $4,313.88 level is the projected apex of the rally.
Understood. Here is the full analysis and titles for your post, presented in English, as requested.
📉 XAU/USD Elliott Wave Analysis: Potential Bearish Reversal from $4,313
🌊 Wave Count Interpretation (Elliott Wave)
The chart suggests that Gold Spot/U.S. Dollar (XAU/USD) has completed a major correction pattern and is now on the verge of a significant downward move.
Major Correction (A) ➡️ (B): The price action from the major peak appears to be forming a complex correction, with the current phase completing the major (B) wave.
The sharp drop to the low around November 1st is labeled as a major (A) wave.
The subsequent rally is labeled as the major (B) wave, which is currently subdividing.
Subdivision of Wave (B): The corrective rally (B) is showing signs of completion as a smaller ABC pattern:
Wave A (of B): A strong 5-wave impulse (labeled 1-2-3-4-5) completed in mid-November.
Wave B (of B): A correction followed this high.
Wave C (of B): The current rally is the final leg, Wave C (of B), aiming for the final target.
Critical Reversal Target for (B) Wave: The chart anticipates the completion of the final Wave C (of B) at a specific price point, coinciding with a key Fibonacci level and trendline resistance:
61.80% Fibonacci Retracement at $4,313.88
This $4,313 zone is the high-probability reversal point before the major downside move begins.
📈 Technical Levels and Trendlines
Major Resistance (The Reversal Zone):
Upper Red Trendline: This descending trendline connects the initial peak with the top of the internal Wave (B), serving as strong dynamic resistance.
Key Price Target: The $4,313.88 level is the projected apex of the rally.
Major Support (The Target Zone):
Lower Green Trendline: This ascending trendline connects the key lows and represents the potential final target for the upcoming decline.
Target Price Zone: The final target for the major (C) wave is indicated near the $3,826.25 level.
🎯 Trading Strategy Implication
Imminent Move: The price is completing the final internal wave towards the $4,313.88 reversal zone.
Short Entry: The ideal short-entry zone is near the $4,313.88 level, with a tight stop-loss placed just above the upper red trendline to manage risk.
Profit Target: The anticipated sharp decline, labeled as the massive (C) wave, targets the lower green trendline around $3,826.25, offering a substantial risk/reward opportunity.
Disclaimer:
This analysis is for educational purposes only and is based on Elliott Wave Theory and technical indicators. It is not financial advice. Trading foreign exchange, cryptocurrencies, and commodity futures involves significant risk of loss and is not suitable for all investors. Past performance is not indicative of future results.
Always do your own research

Gold | Bulls Loading UpGold is currently pulling back into a key intraday support zone near the 200-EMA after a sharp bullish spike, creating an ideal “dip-buy” opportunity as long as price holds above the 4,209–4,210 region. The corrective candles show shrinking bearish momentum, while the MACD histogram is easing—hinting that sellers are losing strength. As long as the support holds, buyers can target the upside continuation toward 4,245, with a well-defined stop around 4,200 to maintain a clean risk-reward profile. A bounce from this area could trigger the next bullish leg, making this setup attractive for momentum-based long entries

4 hourly candle strategy am working on working so perfectlybreaking below resistences and waiting for our pull backs its gona be a displinable trades we going to make here am tired of chasing liquidities and so ever ryt now am scalping 1 candle stick patten whatever the markets goes am in


XAUUSD: Market Analysis and Strategy for December 8thGold Technical Analysis:
Daily Resistance: 4300, Support: 4145
4-Hour Resistance: 4260, Support: 4180
1-Hour Resistance: 4220, Support: 4200
In the short term, gold faces pressure from profit-taking at higher levels, mainly due to the continued support from expectations of a Fed rate cut and the interplay of multiple pressures. On one hand, weak economic data has weakened the dollar, benefiting gold; on the other hand, rising US Treasury yields, reaching a more than two-week high, have suppressed gold price increases.
On the daily chart, gold surged to 4259 last Friday before falling to around 4196, continuing to put pressure on short-term gains. Currently, the technical indicators show weak continuity in both upward and downward movements. The price is consolidating in a narrow range at high levels, suggesting a potential larger move is brewing. At least as of the European session, gold has failed to maintain this momentum. The moving averages maintain a bullish structure, and the Bollinger Bands are widening, indicating short-term upward movement. In the US session, the price will likely struggle around the 4180 level, with trendline support around 4160.
Looking at the 1-hour chart, the price is testing the upper edge of a triangle pattern. Watch for short-term continuation, focusing on the 4220 level. A break above this level could lead to a further push towards 4260, where buying opportunities may arise. Short-term strategy remains to buy low and sell high.
Trading Strategy:
BUY: 4186~4180
SELL: 4220near
More Analysis →

Correction down and more upside for goldHi traders,
Last week gold started a corrective downmove and made a bullish Weekly FVG.
So next week we could see the fill of it and finish the correction down. After that it could go up again.
Let's see what price does and react.
Trade idea: Wait for the correction down to finish and a change in orderflow to bullish to trade longs.
This shared post is only my point of view on what could be the next move in this pair based on my technical analysis.
But I react and trade on what I see in the chart, not what I've predicted or expect.
Don't be emotional, just trade your plan!
Eduwave

Gold is consolidating inside TriangleGold is consolidating inside Triangle. Its attemting to break Resistance.

Gold potential shortsLooking for some shorts up until the top ,
Gold might also hit ATH take the Liquidity there and go down , but i also think this region is a good region for executing shorts.

Elliott Wave Analysis XAUUSD – December 10, 20251. Momentum
D1:
The D1 momentum has already turned upward. Therefore, we expect an upward move on the daily timeframe lasting through the end of this week to complete the green wave C.
H4:
H4 momentum is currently turning down. If the current H4 candle closes confirming this downward signal, the market is likely to form a short-term H4 decline.
H1:
H1 momentum is still rising but is starting to contract and show signs of a bearish reversal. The most recent strong bearish candle with wide downside range indicates that the next downward swing may begin from the H1 timeframe.
________________________________________
2. Wave Structure
D1:
The D1 wave structure has not changed from the previous plan. Price is still progressing within the green wave C. When the green wave C completes, the purple wave X will also complete, followed by a decline forming wave Y.
With D1 momentum turning upward, our expected targets for the purple wave C remain 4329 or 4336.
H4:
Yesterday, price touched the projected target area at 4167 and then bounced back to the POC zone, as anticipated.
The current bearish reversal on H4 momentum is critical:
• If price can remain above 4187 while H4 momentum moves into the oversold zone and then reverses upward, we may see the formation of a 5-wave green structure, which would be an early signal that the corrective wave (4) has completed.
• If price fails to hold above 4187 while H4 momentum continues downward, the green wave (4) may extend further.
H1:
Yesterday’s decline toward the 4168 target strengthens the expectation that wave (C) of the black flat structure (A)-(B)-(C) has completed, meaning green wave (4) may also be complete.
Price then rallied toward the POC at 4215, which we expect to be wave 1.
The current decline shows a 3-wave structure (A)-(B)-(C) in red, which we expect to be wave 2.
The projected completion zones for wave 2 (the end of red wave (C)) are:
• Equal to wave (A): 4197
• 1.618 × wave (A): 4187
From the H4 Volume Profile:
• The two key levels discussed yesterday were POC 4215 and the liquidity boundary at 4187.
• With H4 momentum now turning down and price reacting to POC from below, selling pressure remains dominant.
• Level 4187 acts as the liquidity boundary—if buyers can defend this level, a breakout above 4215 becomes likely.
• If 4187 does not hold while H4 momentum moves into oversold, the green wave (4) could still be ongoing.
________________________________________
3. Trading Plan
We will look to capture the end of wave 2.
Since the two target zones (4197 and 4187) are close to each other, the best approach is to wait for price to reach these areas and observe the reaction before entering.
If placing a limit order, I prefer the upper zone with a slightly wider stop.
BUY ZONE: 4198 – 4196
SL: 4177
TP1: 4218
TP2: 4245
TP3: 4329

XAUUSD still in corrective mode!I believe that GOLD is still in corrective wave and it is not done yet!
Possibilities prices to go down after hitting zone 4275 and 4325

XAUUSD: A new rise is possible after the pullbackXAUUSD has climbed strongly along a steep uptrend, and based on what I’m seeing on the chart, I expect the price to continue pushing toward the 4,265 area.
This zone could become a decision point where the price either finds support and bounces higher or breaks below and allows the move to extend deeper.
If I had to choose a direction right now, I’d lean toward more upside. But price action will always decide what comes next because the chart always speaks last.
When the price breaks below the trendline with real conviction, the bullish scenario loses validity. That could signal a pause in the uptrend or even a short-term reversal.
This is not financial advice, only my personal thoughts based on what I see on the chart.

XAU/USD NEXT MOVEGOLD NEXT MOVE...
Let me know what you think about my analysis in the comment section, and please hit boost and follow for more ideas.
Trading is not hard if you have a good coach! Thank you.

GOLD SELL PREDICTION DEC 2025After Asian Market session open and hit it's high i'm in for a XAUUSD (GoldUS dollar) short position .

XAU SWING TRADETP hit long positions.
EP hit short position.
Wave 5 (invalidation 4,332)
RSI Divergence
Macd
balance bounce 30m

Gold key levels to watchFollowing the Fed's rate decision we saw a mildly positive reaction in gold as the dollar sold off and yields weakened. But the metal hasn't been able to stage a breakout yet with the $4245 level once again providing resistance. It needs to climb above this level if it wants to the test $4300 and potentially a new record high above $4380 in the days to come. But if support at 4170 gives way first, then watch out for a quick drop to low $4000s again.
By Fawad Razaqzada, market analyst with FOREX.com

XAU / USD 1 Hour ChartHello traders. Taking a look at the hourly chart, I have marked the area I am watching to see if we push down some more, or move up and take out some of the existing short positions that are in profit. Pre NY volume starts coming in here in the US in 2 hours from now (7:20am est). Let's see how things play out on the current 30 min and 1 hour chart. Be well and trade the trend. Shout out to Big G.

GOLD Will Go Higher! Buy!
Take a look at our analysis for GOLD.
Time Frame: 1h
Current Trend: Bullish
Sentiment: Oversold (based on 7-period RSI)
Forecast: Bullish
The market is testing a major horizontal structure 4,201.56.
Taking into consideration the structure & trend analysis, I believe that the market will reach 4,215.52 level soon.
P.S
Overbought describes a period of time where there has been a significant and consistent upward move in price over a period of time without much pullback.
Like and subscribe and comment my ideas if you enjoy them!

gold await breakout#XAUUSD price await 2 times breakout below 4192-90, this price act as reverse on buy but if the H1 closes below there then sell will occur.
Buy limit 4192-90 2 times breakout, target 4209-31, SL 4186.
Below 4187.8 D1 low, breakout again will go sell but we await below 4186 to sell. Above 4231 holds sell retrace

GOLD BEARISH BIAS RIGHT NOW| SHORT
GOLD SIGNAL
Trade Direction: short
Entry Level: 4,202.78
Target Level: 4,170.08
Stop Loss: 4,224.41
RISK PROFILE
Risk level: medium
Suggested risk: 1%
Timeframe: 1h
Disclosure: I am part of Trade Nation's Influencer program and receive a monthly fee for using their TradingView charts in my analysis.
✅LIKE AND COMMENT MY IDEAS✅

XAUUSD -1H SetupWatching two key demand areas for potential buy signals. Bullish outlook remains valid as long as price does not close below the marked zone.

XAUUSD: Bulls Reach Full Targets; Start SellingToday the bullish momentum remained very strong. First, the market reached our initial target at 4228–4232, then moved up to 4250–4260, and eventually even surged to 4285, completing the final 4280 objective.
However, after reaching this area, the strength of the bulls clearly began to slow. On the one hand, we are approaching the market close, and trading activity is naturally fading. On the other hand, today’s rise has already been substantial, and gold is approaching the key 4300 level, where bullish pressure becomes significant.
Therefore, I plan to begin positioning a base short position. If prices continue to rise into the 4290–4310 zone, I will continue adding to the position to capture a pullback opportunity. The initial target is around 4260, followed by 4250. If the price extends above 4300, these targets will be adjusted upward accordingly, for example toward the 4270 area.
