Gold Big Sell-Off Ahead? Gold Showing Clear Bearish SignalsAs expected, Gold delivered a classic early-month liquidity grab, creating a false move before reversing. Price tapped the 4H bearish Order Block and reacted with strong downside aggression, confirming bearish intent.
At this stage, I would like to see a retracement into the 1H bearish OB at the 4254–4224 zone, which sits firmly in premium, along with a fill of the 1H FVG at 4235–4220. Once these areas are mitigated, the path toward the 4100–3900 region opens up.
My first partials/first target would be taken around the 4100 level.
Trade ideas

Gold Looking for for Bullish Continuation
Gold is bullish on the D1.
Price made a new Higher High and is currently ranging.
H4 structure remains bullish and holding above the previous high at 4226.
Entry ;H1 break structure and price above previous high
-

gold await breakout#XAUUSD base on price movement and H4 past candle, we need retest above 4226-35 for sell to reverse back.
Await buy on valid breakout 4209.4, SL 4196, TP 4226-35
Below the rectangle on M15-30 closure price will fall back till 4175 or more.

Gold Is Setting a Trap — The Real Move Comes After the LiquidityMarket Analysis — XAUUSD (H1)
1. Current Price Structure
- The market previously created a series of Higher Highs (HH) and Higher Lows (HL) → bullish order flow.
- After the last HH, the price showed multiple CHoCH events → early signs of a shift from bullish to bearish structure.
- Current consolidation is forming around 4,207 – 4,210, with price struggling to regain bullish conviction.
- A rising dotted trendline represents the last support of short-term buyers — once broken, bearish momentum strengthens.
2. Liquidity Zones
- Upper liquidity zone: 4,225 – 4,230 → where you expect price to sweep before reversal.
- Key support: 4,181 – 4,183 → first downside liquidity zone.
- Major target liquidity zone: 4,163 – 4,165 → final liquidity cluster before deeper bearish continuation.
3. Today’s Primary Scenario
This matches the green projection drawn on your chart:
🔹 Main Scenario (Bearish Continuation After Liquidity Sweep)
Price is likely to:
- Push upward to retest the 4,225 zone → sweep liquidity and create a final LH.
- Reject strongly → break the rising trendline.
- Drop into 4,181 → first liquidity target.
- Minor pullback → forming a reactionary LH.
- Continue down toward 4,163 → completing the corrective leg.
This aligns perfectly with the market structure + liquidity logic in your chart.
4. Market Psychology
- Buyers are weakening: repeated CHoCH + BOS bearish signals.
- Liquidity is building above and below → ideal for manipulation before expansion.
- Narrow movement before news = accumulation phase.
- Smart money likely pushes up first, then aggressively sells into trapped buyers.
5. Intraday Strategy Guidance
📌 SELL Setup (High Probability)
Sell Zone: 4,225 – 4,228
TP1: 4,181
TP2: 4,165
SL: 4,232
This aligns perfectly with your chart projection.
📌 BUY Setup (Low Probability – Countertrend)
Buy Zone: 4,163 – 4,166
TP: 4,178 – 4,185
SL: 4,158
⚠️ Notes
• Recent BOS patterns favor continuation to the downside.
• Avoid chasing trades in the middle of liquidity zones
Stay patient — the market always pays those who wait for the right setup, not the fast setup.

XAUUSD Potential Breakout Buy Signal XAUUSD Potential Breakout Buy Signal Scenario: Only if the current 4h candle closes clearly above the 4,274–4,280 major resistance zone Pair: XAUUSD
Direction: Buy (Long)
Trigger Entry: 4,260 – 4,250 (on 4h close + retest)
Stop Loss: 4,220 (below the broken resistance)
Take Profit 1: 4,350
Take Profit 2: 4,400–4,420 (next supply zone)
Reason: Strong bullish momentum, breakout above multi-week range high would confirm continuation of the uptrend.
Waiting for confirmation close — no early entries! This is for educational purposes only and NOT financial advice. Trade at your own risk. #XAUUSD #Gold #BreakoutBuy #BullishGold #ForexSignals #TradingSetup #NotFinancialAdvice

Gold has reached a buying opportunity.There are no absolutes in the market, and the rise and fall are not fixed. Therefore, judging the balance between rise and fall in the market is your winning strategy.
Monday's price action was characterized by an initial rise followed by a fall, reaching a high of 4218 and a low of 4175. I achieved some profit from my bullish position, but the unexpected drop following the US market news triggered stop-loss orders, causing my long positions to be stopped out. After confirming the double support at 4175, I continued to recommend long positions, which are currently holding for a profit, with a continued bullish outlook. If gold continues to rise today, watch the 4230 high; if it falls, watch the 4175 low.
The H4 chart shows a standard consolidation range, with narrowing Bollinger Bands and converging moving averages. Monday's drop seemed like a potential breakout, but the consecutive bullish candlesticks still indicate an upward trend. Therefore, the range-bound trading is evident, and as long as the range holds, there's no need to be overly concerned about a breakout.
Investment Strategy: Buy gold at 4200, target 4230, hold if it breaks through.

XAUUSD Aggressive Scalp Swing LongOANDA:XAUUSD XAU/USD – Aggressive Scalp/Swing Long (15m timeframe) – Updated Signal Entry Zone: 4,280 – 4,285 (buy limit or market if already bouncing)
Stop Loss: 4,274 (tight, just below today’s low – risk max 9–11$)
Take Profit Targets: TP1: 4,295 – 4,297 (quick scalp – 50–60% position)
TP2: 4,308 – 4,313 (main target – previous highs + upper red zone)
TP3: 4,325 – 4,330 (runner if we get strong follow-through)
Risk/Reward: 1:2 up to 1:5 depending on how many targets you let run Confluence & Reasoning (right now): Price just printed a strong bullish engulfing + pinbar reversal exactly at 4,280 demand
Holding the blue ascending trendline for the 4th time
Higher-timeframe daily trend still very bullish (Gold > 4,200 = structural bull)
Volume spike on the reversal candle
Risk events mostly priced in, safe-haven flows supporting
Execution tips: If you’re not in yet → buy the break & close above 4,288 for confirmation
Already in from 4,280–4,285 → move SL to breakeven now
Partial at 4,295–4,297, let the rest run with trailing stop
#Gold #XAUUSD #GoldTrading #XAUAnalysis #Commodities #DayTrading #SwingTrading #NotFinancialAdvice This is NOT financial advice. Trading involves high risk. Always use proper position sizing and manage your own risk.

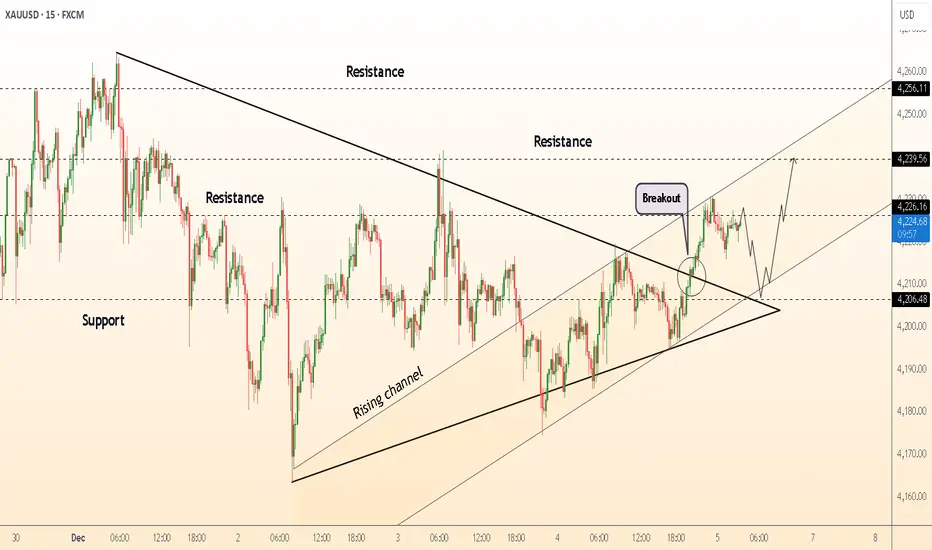
DeGRAM | GOLD kept a local ascending structure📊 Technical Analysis
● Gold broke above the descending resistance line and is now consolidating inside the rising channel, signaling renewed bullish momentum.
● The retest of 4206 as support aligns with higher-lows structure, increasing the probability of continuation toward 4239–4256.
💡 Fundamental Analysis
● Softening Treasury yields and renewed Fed-cut expectations keep short-term demand for gold elevated.
✨ Summary
● Bias: Long; key support 4206, targets 4239 → 4256.
-------------------
Share your opinion in the comments and support the idea with a like. Thanks for your support!
Gold Rebounds, Big Money Footprints Are EmergingGold has broken the previous M30 downtrend, clearing both the prior high and a key Order Block zone.
This move is not just a technical bounce, it signals that Big Money is stepping back in and regaining control.
The breakout was supported by strong buying volume, showing active demand absorbing earlier selling pressure.
Once an Order Block is broken and respected, market structure often shifts from distribution to early trend continuation.
At this stage, the priority is not chasing price, but waiting patiently for a pullback into institutional zones where Big Money tends to defend its position.
🔹 Buy Zone 1:
The Fibonacci retracement of the recent bullish leg, a first defensive area where Big Money may step in again.
🔹 Buy Zone 2:
The base of the bullish leg, a deeper retracement zone suitable if price corrects more aggressively before continuation.
📌 Note:
Monitor price reaction and volume behavior at these Buy Zones closely.
How price behaves there will reveal whether Big Money continues to protect the bullish structure in the sessions ahead.

The upward momentum is strong. Buy on a slight pullback.The number of Americans filing for unemployment benefits recorded its largest weekly increase, suggesting that the job market may be facing new pressures. In addition, the Federal Reserve announced the reappointment of all 11 regional Fed presidents, a move that helped alleviate market concerns about uncertainty surrounding senior personnel appointments.
Influenced by this news, the precious metals market strengthened in tandem, with international gold prices reaching a high of $4286, a 1.22% increase on the day; silver prices reached a high of $64.3, a 2.79% increase.
Gold closed strongly in the US session, especially with a significant surge in the final moments, which typically suggests that the upward momentum is likely to continue in the last trading session of the week.
Currently, a move above $4300 for gold prices seems highly probable, and it may even challenge the previous high near $4381. Quaid recommends a buy-on-dips strategy for the short term. After breaking out of the previous trading range, the short-term technical structure of gold remains strong. The key focus should be on whether a slight pullback will lead to a challenge of the previous high. If buying momentum continues to strengthen, the upside potential remains considerable.
Gold prices have broken strongly out of their trading range, and the previous resistance level of 4260 has now become a key support. As long as the price remains above 4260, it can be considered a strong bullish trend, and this level can be used as a reference for short-term entry points. I will update more trading information in the channel.

XAUUSD H4📌 1. Market Context (4H)
Gold is currently in a corrective phase after a strong impulsive rally. The chart shows price revisiting a liquidity-rich demand zone, suggesting the market may be preparing for a reversal leg upward.
📌 2. Wyckoff Interpretation
You’ve marked the current area as potential Spring:
Price swept the previous lows (equal lows) → Liquidity grab
Deep test into the highlighted BUY-side liquidity zone
Strong bullish reaction after the sweep
This behavior aligns with a Wyckoff accumulation, where:
Phase C = Spring
Price manipulation clears liquidity before the new uptrend.
📌 3. Elliott Wave Structure
Your labeling suggests:
The decline formed a 5-wave bearish structure (1 → 5)
Completion of wave (5) aligns with the Spring
Now price is in wave A → B → C correction upwards
Current Position:
Wave A is forming upward
Wave B expected to retrace slightly
Wave C projected to break higher toward resistance/targets
📌 4. Key Levels
🔹 Demand / Reversal Zone
$4,175 – $4,185 (the blue box)
This has acted as liquidity grab + Spring
🔹 Support
$4,190.82 (blue dashed line)
Current retest area after Spring rejection
🔹 Interim Resistances
$4,216.97 → former supply / wave A termination zone
$4,240.63 → 0.786 retracement
🔹 Final Target Zone
$4,259.28 (marked as Target)
Also aligns with previous Wyckoff UTAD zone / supply
📌 5. Price Outlook (Bullish Scenario)
If Wyckoff Spring + Elliott structure remains valid:
Price forms wave B retracement near $4,200–4,205
Then initiates wave C toward upper liquidity areas
Final rally into $4,240 – $4,260 zone
This would sweep previous highs where major liquidity sits
This path matches the projection drawn in your chart.

XAUUSD delivered Excellent results [300 pips Tp]As highlighted during my TODAY'S session update:
My position & stance:
I waited for Gold to deliver a TAP of 4220 last Friday Rebound, and I identified it at the $4218 resistance test.
I executed set of sell orders at $4212 & $4205 and closed them at the $4188 & 4175 in extension.
I want to take this moment to congratulate all the traders who followed my calls and patiently held their positions. Well done — enjoy the profits, and have a wonderful Day

Gold bullish continuation pattern breakout The Gold remains in a bullish trend, with recent price action showing signs of a breakout within the broader uptrend.
Support Zone: 4193 – a key level from previous consolidation. Price is currently testing or approaching this level.
A bullish rebound from 4193 would confirm ongoing upside momentum, with potential targets at:
4284 – initial resistance
4313 – psychological and structural level
4350 – extended resistance on the longer-term chart
Bearish Scenario:
A confirmed break and daily close below 4193 would weaken the bullish outlook and suggest deeper downside risk toward:
4161 – minor support
4134 – stronger support and potential demand zone
Outlook:
Bullish bias remains intact while the Gold holds above 4193. A sustained break below this level could shift momentum to the downside in the short term.
This communication is for informational purposes only and should not be viewed as any form of recommendation as to a particular course of action or as investment advice. It is not intended as an offer or solicitation for the purchase or sale of any financial instrument or as an official confirmation of any transaction. Opinions, estimates and assumptions expressed herein are made as of the date of this communication and are subject to change without notice. This communication has been prepared based upon information, including market prices, data and other information, believed to be reliable; however, Trade Nation does not warrant its completeness or accuracy. All market prices and market data contained in or attached to this communication are indicative and subject to change without notice.

GOLD DO YOU KNOW WHATS BEHIND THIS OR OTHER IDEAS?? in bio..
Preferably suitable for scalping and accurate as long as you watch carefully the price action with the drawn areas.
With your likes and comments, you give me enough energy to provide the best analysis on an ongoing basis.
And if you needed any analysis that was not on the page, you can ask me with a comment or a personal message.
Enjoy Trading ;)

XAU/USD: Buy at OB 4.18x–4.17x; Sell on reaction.✍️ Captain Vincent – SMC Flow Analysis
📊 Market Structure (H1)
Gold continues to accumulate within the range of 4,200–4,220 after failing to break the recent peak. The structure shows:
• Multiple ChoCH – BoS declines → selling pressure still leads in the short term.
• However, the OB Buy 4,184–4,170 zone remains a crucial structural bottom, where buyers react strongly once swept.
• Above, the market leaves a Liquidity Sell area at 4,261, a natural target if gold gathers enough liquidity below.
→ The current phase is liquidity gathering before making a big move.
💎 Key Levels – Price Zones to Watch
🔸 Resistance / Sell Zone
• 4,218 → intraday resistance, price reacts multiple times.
• 4,243–4,244 → confluence of sideways peak + old BoS.
• Liquidity Sell: 4,261 → extended target if price breaks strongly upwards.
🔸 Support / Buy Zone
• 4,200–4,201 → short-term price balance zone.
• OB Buy 4,184–4,170 → strong demand, where the previous trend initiated.
• If breaking 4,170 → price may sweep deeper but remains in the ideal discount zone for BUY hunting.
🎯 Trading Plan – Clear and Easy to Follow
1️⃣ Main Scenario – Prioritize BUY at OB 4,184–4,170
Expect the market to create a sweep below 4,200, touching OB Buy to gather liquidity before bouncing up.
BUY Conditions:
• Price touches 4,184–4,170
• Reversal signals appear on M15–H1: pin bar, engulfing, rising ChoCH
• Decline slows down or buying force becomes clear
Targets:
• TP1: 4,190
• TP2: 4,200
• TP3: 4,215
• TP4 extended: 4,261 (Liquidity Sell)
Invalidation: H1 closes below 4,165 → stay out and reassess the structure.
2️⃣ Secondary Scenario – Short SELL when price retests 4.24x
If the price does not drop immediately but pulls up:
SELL Conditions:
• Retest 4,243–4,244
• Strong reaction appears: rejection wick, declining ChoCH
• Must not close H1 above 4,250
Targets:
• TP1: 4,235
• TP2: 4,225
• TP3: OB Buy 4,184–4,170
Invalidation: H1 closes above 4,250 → stop SELL, shift bias to observe breakout.
3️⃣ Extended Scenario – Sweep peak 4,261
Only activate when:
• Price bounces strongly from OB Buy
• Clear breakout of 4,243 zone
• Structure forms HL → HH
At that point, gold will tend to run straight up to sweep liquidity at 4,261 before the market chooses a new direction.
⚠️ Risk Management Notes
• Do not BUY when price is still within the resistance zone 4,218–4,243.
• SELL is only a short-term strategy, do not go against the major trend if a breakout occurs.
• OB Buy 4,184–4,170 is the zone with the highest probability of triggering an upward wave.

GOLD at Resistance? holds or not??#GOLD.. well guys market perfectly placed our supporting region as we discussed in our last idea regarding #xauusd
now again market just holding his resistance region that is around 4215 to 4221
keep close that region and until market holds there is not long.
NOTE: we will go for cut n reverse above 4219 on confirmation.
good luck
trade wisely

GOLD Strong Bullish Bias! Buy!
Hello,Traders!
GOLD is trading in a strong uptrend and the players are now accumulating volume in a range structure, so we are waiting for a breakout which will be a sign of a further bullish continuation. Time Frame 12H.
Buy!
Comment and subscribe to help us grow!
Check out other forecasts below too!
Disclosure: I am part of Trade Nation's Influencer program and receive a monthly fee for using their TradingView charts in my analysis.

Gold Intraday Trading Plan 12/10/2025Gold went down all the way to 4170 yesterday and quickly bounced and broke 4200. It closed the day at 4208. Daily candle is in green bar, signalling the continuation of bullish trend. Aligning with my weekly post, gold should resume its bullish run from today. I will buy from 4196 and 1st target 4235, ultimate target 4253.

XAU/USD Watching Supply Zone and Trendline Interaction“Analyzing XAU/USD structure on the 30-minute timeframe. The chart marks a zone where price has previously shown selling pressure. A hypothetical bearish path is drawn for study purposes. Trade decisions should be based on personal analysis.”


30m XAUUSD Gold is at a strong buy zone $4,176-$4,184. Look for a bounce up to $4,213 first, then $4,233. Stop below $4,176.
Easy, clear, trade smart.
Caution : This is not a financial advice

XAUUSD GOLD Possible Bullish OpportunityGold is currently trending up nicely on the 4-hour time frame. We've had a pullback down into equilibrium and it's starting to move. Thought I'd get this video in quickly, understand the risk. This is my trade idea. Hope you like it. Do comment, I'd love to hear from you. Have a great day, safe trading, and see you in the next one

GOLD: Bullish Repricing Setup — Imbalance Refill + Equal Highs Gold is setting up for a bullish continuation as price trades back into lower-timeframe imbalances and a clear 1H demand block. We’ve already seen a corrective pullback into a 5min and 1H imbalance zone, where buyers previously showed strength.
If the current retracement holds, price is positioned to expand upward toward unmitigated inefficiencies and equal highs sitting above. Those liquidity pools, along with multiple fair value gaps, create a strong draw on price.
Key elements in this setup:
✔️ 5min + 1H imbalances acting as a potential long re-accumulation zone
✔️ Clean equal highs above — liquidity magnet
✔️ Unfilled FVGs stacked through the upside range
✔️ Bullish structure intact after recent higher-low formation
✔️ Expectation for continuation toward higher imbalance zones
I’m looking for bullish confirmation inside the shaded demand area before riding price into the next liquidity cluster and inefficiency above.
This is a structural, liquidity-driven setup — manage risk and allow price to confirm.
