Gold Pullback: Technical Correction Keeps the Main Trend IntactHello everyone,
Gold is currently trading around 4,112 USD on the H4 chart after a fairly deep correction. Many traders seem concerned seeing strong selling pressure, but a closer look at price action reveals this is merely a technical pullback, not a signal of a long-term trend reversal.
After the parabolic surge, gold paused due to profit-taking. The dense Fair Value Gaps (FVG) in the 4,050–4,130 USD area indicate plenty of “unfinished business” — liquidity has not been fully tested, stop-losses not swept, supply and demand not fully balanced.
The 4,050 USD zone is key support, both technically and psychologically for buyers. Holding above this level preserves the H4 uptrend structure. Meanwhile, the 4,130 USD zone presents a short-term resistance — FVG combined with the Ichimoku cloud — and gold must decisively handle this region to continue higher.
From the news perspective, the market is caught between two forces: anticipation of Fed rate decisions and the upcoming US CPI, which could trigger volatility; versus easing US–China tensions, temporarily reducing safe-haven demand. The recent selling was mostly profit-taking after a 5.5% rally earlier this month; buyers haven’t exited, they are merely reorganising positions before returning.
My preferred scenario: gold retests 4,050–4,070 USD, sweeps remaining liquidity, and then bounces to test 4,130 USD. Only if 4,050 USD breaks with high volume would the market likely head toward 4,000 USD, where buyers will defend aggressively. If it holds, a recovery is expected and gold could target higher levels.
Do you see this as a normal pullback or a precursor to a sharp drop? Share your thoughts below.
Trade ideas

4 Best Forex Gold Trading Strategies For Beginners
If you just started trading and looking for a winning strategy to trade, I prepared for you 4 simple and profitable forex trading strategies for beginners.
1. Harmonic Strategy
With that strategy, you will trade harmonic patterns.
Here is the list of the most powerful ones:
Bullish/Bearish Gartley pattern,
Bullish/Bearish Bat pattern,
Bullish/Bearish Cypher pattern.
To properly apply the Harmonic Strategy you should learn just 3 things: Fibonacci numbers, impulse legs and the rules of harmonic patterns.
That strategy is very simple: it works on any time frame and your only task is to recognize the harmonic pattern and trade it strictly following the rules .
2. Trend Following Strategy
That strategy is price action based.
To properly apply that, you should learn trend analysis rules and how to identify price action legs.
Once you spotted that the market is trading in a bullish/bearish trend, your task will be to wait for a completion of a correctional movement to buy/sell t he market expecting a trend continuation.
That strategy works on any time frame, however, my recommendation is to trade 4H time frame or higher.
3. Structure Breakout Strategy
That strategy is based on structure analysis.
To properly apply Breakout Strategy , you should learn to identify key vertical and horizontal structures: supports and resistances.
Your task will be to look for a confirmed structure violation with a candle close beyond that.
Bullish breakout of a key resistance will be a signal for you to buy, expecting a bullish movement to the next resistance, while a bearish breakout of support will push the prices lower to the next structure support.
That strategy works on any time frame, however, my recommendation is to trade 4H time frame or higher.
4. Trend Reversal Strategy
That strategy is price action based.
To use it properly, you should learn trend analysis and trend reversal rules.
Your task will be to look for a confirmed trend reversal . It will lead to an initiate of a new trade and give you a perfect opportunity to catch an extended movement.
What I like about these strategies, is that while you trade with them, you master structure and price action analysis. 2 essential components of any sophisticated professional strategy.
Master one of these strategies and then modify that with experience, adding some extra layers of analysis.
Let me know which strategy do you like the most?
❤️Please, support my work with like, thank you!❤️
I am part of Trade Nation's Influencer program and receive a monthly fee for using their TradingView charts in my analysis.

Gold Analysis: Break Above $4,293 Could Trigger a New HighHi guys!
Gold has been moving inside a clear ascending channel, respecting both its upper and lower boundaries. Recently, we saw a double top formation near the upper trendline , which triggered a corrective move down to the $4,190–$4,200 support zone, an area that has already shown strong buying interest.
After the rebound from this support, the price is now aiming toward the $4,293 resistance.
👉 If the price breaks and holds above $4,293 , it’s likely to continue the bullish momentum and head toward a new higher high inside the channel.
Overall, the structure remains bullish as long as the price stays above $4,190 , with the next key resistance at $4,293 being the level to watch for a potential continuation of the uptrend.
Gold’s bullish bias remains supported by the ongoing geopolitical tensions, uncertainty over global interest rate paths, and softening U.S. dollar. Investors are also increasingly turning to gold as a safe-haven asset, especially amid concerns about economic slowdown and central bank gold purchases remaining strong.
Disclaimer: As part of ThinkMarkets’ Influencer Program, I am sponsored to share and publish their charts in my analysis.

GOLD → Correction after aggressive growthFX:XAUUSD is in a correction phase after a month and a half of aggressive growth. The price is forming a trading range and continues to storm support...
The record growth was overheated, and traders are closing long positions. A gradual change in the fundamental background and market sentiment is also provoking an outflow of funds. However, US-China negotiations, the ongoing US shutdown, and the tense geopolitical situation, including the cancellation of Trump's meeting with Putin, create additional risks in the economy, which may support the metal.
The correction in gold looks like a healthy pause. The $4,000 level remains key support. A recovery above $4100 indicates continued buyer interest, but further dynamics depend on news about trade negotiations.
Resistance levels: 4082, 4107, 4163
Support levels: 4059, 4000
A breakdown of the trading range support could trigger further sell-offs. Focus on 4000K, aggressive reaction possible. At the moment, the market is falling as aggressively as it rose. We need to wait for the price to slow down in order to make reasonable technical decisions.
Best regards, R. Linda!

Gold 1H – Bearish Reaction After Consecutive Gains🟡 XAUUSD – Intraday Trading Plan | by Ryan_TitanTrader
📈 Market Context
After several sessions of steady gains, gold is showing signs of exhaustion as U.S. Treasury yields stabilize and traders reassess the Federal Reserve’s next move.
The market’s focus today is on U.S. housing data and Fed officials’ remarks, which could shape expectations for the December policy outlook.
• A hawkish tone from policymakers may strengthen the dollar and pressure gold lower.
• Conversely, softer remarks could briefly trigger buying around key discount zones, but the overall tone remains corrective after the recent rally.
Market liquidity is concentrated near the $4,230 area — where price may tap into unmitigated supply before continuing its bearish leg.
🔎 Technical Analysis (1H / SMC Style)
• Structure: The overall bias has shifted bearish following consecutive ChoCH and BOS formations.
• Premium Zone: The 4,230–4,228 area aligns with an H1 order block and previous liquidity pool — a prime zone for short re-entry.
• Liquidity Sweep: The recent upside push toward 4,230 may sweep late buyers before the next bearish leg unfolds.
• Discount Zone: Short-term liquidity may rest around 4,080–4,100, which aligns with previous sell-side imbalance (SSI) and acts as an intraday reaction zone.
🔴 Sell Setup
• Entry: 4,230 – 4,228
• Stop-Loss: 4,240
• Take-Profit Targets: 4,100 → 4,080 → 4,050+
🟢 Buy Scalp Setup (Short-Term Countermove)
• Entry: 4,081 – 4,083
• Stop-Loss: 4,074
• Take-Profit Targets: 4,100 → 4,115
(Only valid if liquidity sweep confirms reaction within discount zone)
⚠️ Risk Management Notes
• Confirm M15 BOS/ChoCH before entry — avoid blind orders during news.
• Reduce position size for scalp entries; primary directional bias remains bearish.
• Lock partial profits near first liquidity targets and trail stops as structure confirms continuation.
✅ Summary
Gold faces near-term correction pressure after multiple bullish sessions.
The 4,230–4,228 zone offers a clean premium OB entry for continuation shorts, while reactive buyers may scalp intraday from 4,081 if liquidity sweeps occur.
Stay adaptive — today’s sentiment is short-term bearish within a larger range-bound structure.
FOLLOW RYAN_TITANTRADER for daily SMC setups ⚡

What Do Global Experts Say About the XAUUSD Trend?👋Hello everyone , great to see you again! Let’s take a closer look at OANDA:XAUUSD today.
At the start of this new trading week, gold is showing a mild pullback, trading around $4,070 — down more than $44 at the time of writing.
In the short term, many Wall Street analysts are leaning toward a sideways or bearish outlook for gold. Among them, Jim Wyckoff, a veteran analyst at Kitco, predicts that gold will remain volatile with a downside bias this week:
“Large swings are pushing both buyers and sellers out of the market in the same session. When speculators retreat due to risk aversion, the trend often tilts lower.”
However, he also emphasizes that medium- to long-term support for gold remains intact. The U.S. government shutdown has now extended into its fourth week, and the lack of key economic data is adding to uncertainty — a backdrop where gold continues to serve as a safe-haven asset.
From my personal perspective, gold currently appears to be moving sideways and entering a phase of accumulation. The metal market looks somewhat exhausted after multiple strong rallies, and many traders seem to be waiting for a deeper correction before re-entering. The key support zone to watch lies around $4,030–$4,000 . If this level breaks, I would avoid buying immediately and wait for a more stable setup to emerge.
What about you — how do you see the gold trend unfolding next?
💬Share your thoughts in the comments below, and good luck with your trades!

Lingrid | GOLD Consolidation Period Following Retracement ?OANDA:XAUUSD is pulling back after a failed retest of the 4,380 resistance zone, showing weakness at the upper boundary of the market structure. The market forms a descending correction within a potential consolidation phase following pullback, staying below the downward trendline. Price may attempt a rebound toward upper zone of consolidation at 4,135 before another wave up if momentum remains neutral. Overall, gold reflects a temporary correction inside a broader upward trend.
⚠️ Risks:
A sustained break below 4,000 would shift short-term sentiment back to bearish.
Unexpected shifts in US inflation or bond yields could spark sell off gold.
Thin liquidity may trigger false breakouts within the consolidation range.
If this idea resonates with you or you have your own opinion, traders, hit the comments. I’m excited to read your thoughts!

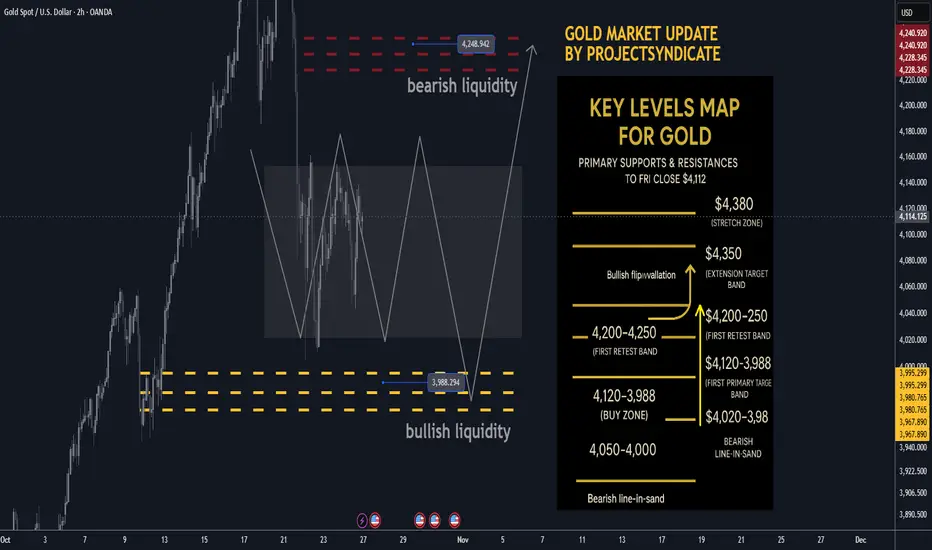
Gold next week Key S/R Levels and Outlook for Traders🔥 GOLD WEEKLY SNAPSHOT — BY PROJECTSYNDICATE
🏆 High/Close: $4,380 → ~$4,112 — lower close within range; momentum cooled but holding the $4,000 handle.
📈 Trend: Uptrend intact > $4,000; oversold into $4.1k—setup favors reflex bounce.
🛡 Supports: $4,120–$4,080 → $4,020–$3,988 (bullish liquidity) → $4,000/3,980 must hold.
🚧 Resistances: $4,200 / $4,250 (bearish liquidity) / $4,300 → stretch $4,350–$4,380.
🧭 Bias next week: Buy-the-dip $4,020–$3,988; momentum regain above $4,200 targets $4,250 → $4,300–$4,350. Invalidation < $3,980 risks a deeper flush to $3,950.
🌍 Macro tailwinds:
• Policy: Easing real yields supportive on dips.
• FX: Softer USD tone = constructive backdrop.
• Flows: Central-bank buying + tactical ETF interest underpin $4k.
• Geopolitics: Trade/tariff & regional tensions keep safety bids alive.
🎯 Street view: Select houses still float $5,000/oz by 2026 on policy easing & reserve-diversification narratives.
________________________________________
🔝 Key Resistance Zones
• $4,200–$4,230 immediate supply from the weekly close
• $4,250 bearish liquidity / primary target
• $4,300–$4,350 extension band
• $4,380 prior spike high / stretch
🛡 Support Zones
• $4,120–$4,080 first retest band below close
• $4,020–$3,988 buy zone (bullish liquidity)
• $4,000 / $3,980 must-hold shelf
________________________________________
⚖️ Base Case Scenario
Expect pullbacks into $4,120–$4,080 and $4,020–$3,988 to attract buyers, rotating price back toward $4,200 then $4,250. Acceptance above $4,250 invites a drive into $4,300–$4,350.
🚀 Breakout Trigger
A sustained push/acceptance > ~$4,250 unlocks $4,300 → $4,350, with room toward $4,380 if momentum persists.
💡 Market Drivers
• Real-yield drift lower (supportive carry backdrop)
• USD softness aiding metals
• Ongoing CB accumulation; ETF flows stabilizing on dips
• Headline risk (trade/geopolitics) sustaining safe-haven demand
🔓 Bull / Bear Trigger Lines
• Bullish above: $4,020–$4,100 (buyers defend pullbacks)
• Bearish below: $3,980 (risk expands; threatens $3,950)
🧭 Strategy
Buy low from bullish liquidity (~$3,988) with a target at $4,250; oversold conditions favor a strong bounce. Add on strength above $4,200 toward $4,300–$4,350. Keep risk tight below $3,980–$4,000 to invalidate.
Gold Rebound SetupGold (XAU/USD) is testing the support trend line around 4030. If it holds, price may rebound toward resistance levels at 4160 and 4236, with a potential target near 4370. A break below the trend line could indicate further downside pressure.

XAUUSD: Bullish Momentum Still Intact After a Healthy PullbackHello everyone, here is my breakdown of the current Gold setup.
Market Analysis
The broader trend for Gold remains strongly bullish, as we can clearly see from the consistent upward channel that has been forming since mid-September. Each corrective phase has been followed by a decisive breakout, confirming buyers’ control and sustaining the uptrend.
Recently, the market broke out from the upper boundary of the range near 4020, establishing a new structural high close to the 4250 resistance zone. However, after reaching this zone, the price entered a correction phase, pulling back to retest the major support zone around 4050–4020 — a level that also aligns with the lower boundary of the ascending channel.
My Scenario & Strategy
At the moment, the price is stabilizing around the support zone, showing early signs of a potential bullish rebound. This zone has acted as a strong demand area throughout the uptrend, and I expect buyers to defend it once again. If the price confirms a bounce from this level, the next logical move would be a continuation towards the 4215 resistance zone, which also aligns with the mid-level of the previous range.
I remain bullish on Gold while the price holds above the 4020 support zone. A successful retest here would provide a good opportunity for long positions targeting 4215 initially. If the price fails to hold above this level, we could see a deeper pullback — but as long as the channel structure remains intact, the broader bias stays positive.
That's the setup I'm tracking. Thank you for your attention, and always manage your risk.

Gold Defends the 4000 Zone Again — Eyes on 4160 Break for 4350 RGold Defends the 4000 Zone Again — Eyes on 4160 Break for 4350 Retest”
Yesterday, gold tested the 4000 price level for the second time and bounced back up, showing that the market is not ready to fall below that old psychological level.
Bullish optimism is rising again and the chances of gold rising further are also increasing.
The fact remains that the Gold continues to be manipulated, but this is the current market, take it or leave it. Since yesterday afternoon, gold has risen by almost 3.15% from 4010 to 4136.
If the price manages to break through 4160, then there is a good chance that it could retest the high near 4350 - 4380.
Overall, nothing has changed since yesterday. It's just that the market is hesitating to push the price up aggressively as before.
You may find more details in the chart!
Thank you and Good Luck!
❤️PS: Please support with a like or comment if you find this analysis useful for your trading day❤️

( Gold Protocol ) Bearish Reversal DetectedStatus: Active Reversal Protocol
🆚Symbol: Gold
Session: London–New York Overlap (Smart Exit Window)
Bearish Reversal : 4085
☄️ Volume Surge Confirmed — Sellers dominate exhausted highs
☄️ Session Aligned — Smart money exit window open
☄️ Cluster Shield Active — Supply imbalance verified
☄️ Delta Shift Negative — Buyers trapped above
☄️ POC Retest Completed — Liquidity absorbed at resistance
☄️ Structure Break Pending — Bearish bias confirmed
🚀 Logic: This is engineered reversal, not prediction.
🚀 Objective: Controlled execution with minimal drawdown.
Goal: Controlled Both Sides with minimal drawdown
★★★★★ (Smart Money Aligned)
⤵️ Every like & comment on our Trading View posts helps us grow. More engagement means more exposure ★★★★★ , which benefits everyone in the community!

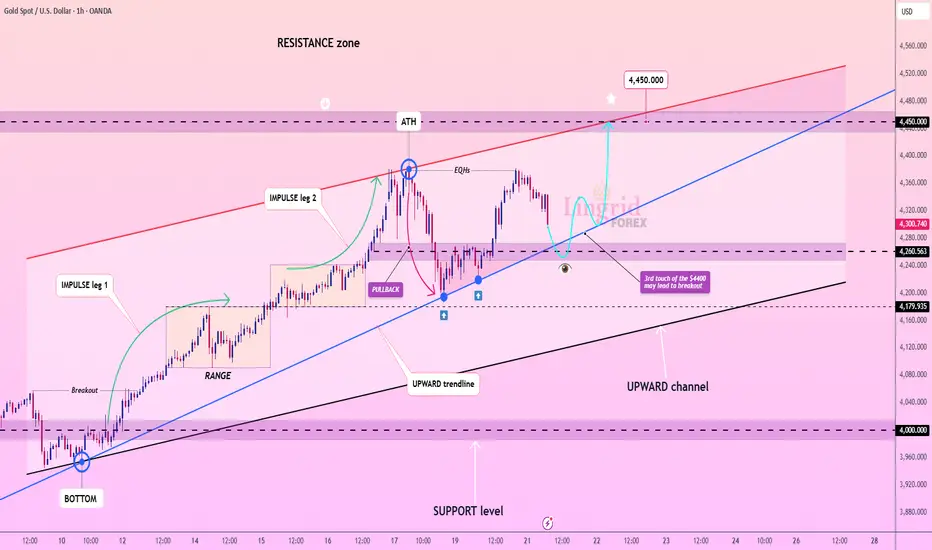
Lingrid | GOLD Trend Continuation Pattern FormingOANDA:XAUUSD is maintaining its bullish structure within an upward channel, where the price continues to create impulsive legs followed by controlled pullbacks. The third touch of the $4,380 resistance area suggests an increasing probability of a breakout continuation toward $4,450. As long as the $4,250–$4,270 support region holds, buyers remain in control of the broader trend. Momentum remains constructive, supported by higher lows and consistent rebounds from the trendline base.
⚠️ Risks:
Failure to hold $4,240 could invalidate the bullish setup.
Strong CPI data may cap gold’s upside.
A sudden drop in inflation expectations could weaken safe-haven demand.
If this idea resonates with you or you have your own opinion, traders, hit the comments. I’m excited to read your thoughts!
Gold at a Critical Crossroad: Bounce or Breakdown Ahead?Hi!
The gold price is currently trading around $4,042, sitting just above a critical support area near $3,953.80. This gray zone is a key decision point for the next major move.
Trend Structure:
The broader trend remains bullish, moving within a well-defined ascending channel.
Double Top Formation:
A short-term double top has formed near recent highs, triggering a corrective move down into the channel’s midline and the gray support area.
Critical Support Zone ($3,953.80):
This level aligns with previous structure support and the channel’s bottom, making it a high-probability reaction zone.
________________
Scenario 1: Bullish Reaction (Primary Scenario)
If gold holds above the gray critical area and bounces within the ascending channel, we could see a renewed bullish wave.
Confirmation: A strong bullish reaction or higher low around $3,953–$3,980.
Target: The green target zone around $4,619.57, corresponding to the upper channel boundary and a potential measured move from the recent correction.
Scenario 2: Bearish Breakdown
If the gray area fails to hold, it could signal deeper downside momentum.
Trigger: A clean break and 4H close below $3,953.80.
Target: The pink support zone near $3,656.01, which aligns with prior accumulation and the lower channel boundary.
________________
Disclaimer: As part of ThinkMarkets’ Influencer Program, I am sponsored to share and publish their charts in my analysis.

Xauusd Bullish SetupThis Gold (XAU/USD) analysis presents a bullish setup on the 30-minute chart. The price is expected to rebound from the support zone around 4097, where a buy limit trade is placed. The stop loss is positioned at 4046 to manage downside risk. The analysis targets an upward move towards 4165 (first take profit), 4227 (second take profit), and a final target at 4318, indicating strong potential for a recovery and continuation of the uptrend.

Gold Pullback or Reversal? Key Zone Ahead!As I expected , Gold ( OANDA:XAUUSD ) started to drop thanks to the Double Top Pattern and reached its target at the Support zone($4,011 – $3,981) .
Now, do you think Gold will start dropping again, or will it resume its recent weeks’ uptrend?
Today, I’m going to do a short-term 15-minute analysis of Gold , so stay tuned.
At the moment, Gold is approaching a Resistance zone($4,192 – $4,137) —also a Potential Reversal Zone (PRZ) —and moving within an ascending channel . Overall, the recent moves in Gold over the past couple of days look like a pullback to the previous Support zone($4,192 – $4,137) .
From an Elliott Wave perspective , it seems that Gold , given the momentum of its recent drop, is completing corrective waves, and we should expect another decline .
I expect Gold to start dropping again from the Resistance zone($4,192 – $4,137) and PRZ , and AFTER breaking the lower line of the ascending channel , it could fall at least down to around $4,039(First Target) .
Second Target: Support zone($4,011 – $3,981)
Stop Loss(SL): $4,222
Please respect each other's ideas and express them politely if you agree or disagree.
Gold Analyze (XAUUSD), 15-minute time frame.
Be sure to follow the updated ideas.
Do not forget to put a Stop loss for your positions (For every position you want to open).
Please follow your strategy; this is just my idea, and I will gladly see your ideas in this post.
Please do not forget the ✅ ' like ' ✅ button 🙏😊 & Share it with your friends; thanks, and Trade safe.

XAU/USD (Gold 4H timeframe)... XAU/USD (Gold 4H timeframe) — here’s what’s visible and how it breaks down technically:
Price: Around 4065 USD currently.
Trendline: A major uptrend line has been broken clearly.
Ichimoku Cloud: Price has fallen below the Kumo, confirming bearish momentum.
Support Zone: Between 4120–4160 USD, already broken and retested.
Measured Move (Target Projection): my chart’s extension line points toward a target around 3840–3860 USD.
📉 Target Breakdown:
Immediate support: 4000 USD (psychological round number).
Main target: 3840 USD (as marked on My chart — aligns with previous structure support).
Extended bearish target: If momentum continues, 3740–3760 USD zone may come next.
⚠ Notes:
If gold reclaims above 4160–4180, bearish bias weakens.
Below 4060 = bears in full control.
Below 4000 = confirmation toward your target zone (≈3840 USD).
✅ Final Target: $3,840 – $3,860 USD
Would you like me to give you stop-loss and re-entry zones too (for sell setup)?

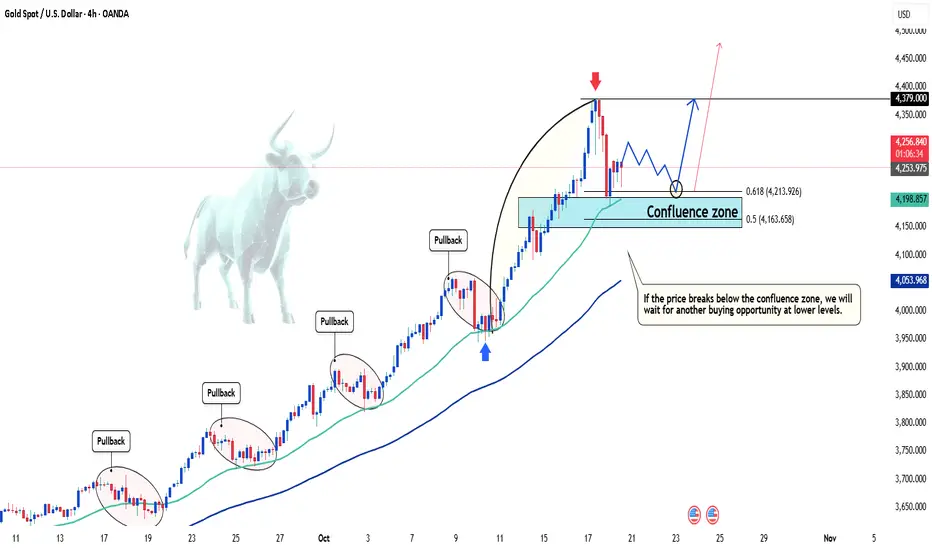
Gold Extends Its 8-Week Winning Streak👋Hello everyone, what are your thoughts on OANDA:XAUUSD ?
Over the past week, gold prices climbed close to the $4,400 mark before pulling back sharply and closing the week around $4,250, up $223 from the weekly open of $4,022 — nearly a 6% gain, marking the eighth consecutive week of growth. Despite the volatility, Main Street investors remain confident that the precious metal will continue to rise this week.
Trade tensions and geopolitical uncertainties have been the key drivers supporting gold’s rally. Meanwhile, the Fed’s rate cut and the U.S. government shutdown have strengthened the dollar while simultaneously providing support for gold prices.
At the time of writing, gold is fluctuating around $4,255, showing little change since the start of the session. Overall, the bullish trend remains intact, and as long as the confluence zone holds, buying opportunities are still favored.
What about you — what’s your outlook on XAUUSD? 💬Share your thoughts in the comments below, and let’s discuss!
Good luck!
(XAU/USD – Gold Spot, 1-hour timeframe)...(XAU/USD – Gold Spot, 1-hour timeframe), here’s the breakdown:
Current price: Around $4,337
First target (near-term): Around $4,284
Second (main) target: Around $4,205
These target levels are marked on my chart with blue arrows labeled “Target Point.”
📉 Interpretation:
The chart suggests a bearish (downward) move — likely following a correction from the peak labeled “2.”
The Ichimoku cloud and marked arrows indicate a short-term pullback, with a stronger support zone near $4,205–4,210.

THE KOG REPORTTHE KOG REPORT:
In last week’s KOG Report we said we would be looking at two levels as potential for the long trades and target for the short trades. We ideally wanted price to push upside and complete the long target before turning and then completing the short target. During the early part of the week, we activated short and gave caution on longs only to see the aggressive decline which hit our short target and completed our bias level and red box targets for the week.
All in all, a decent week in Camelot with Excalibur guiding and the EA hitting another full house of completed targets on Gold.
So, what can we expect in the week ahead?
We're pondering on this bearish move and it’s giving us hints of a swing low so for that reason we’ve given the red box bias level at 4095 which will need to break for us to see a continuation of the move. Above there, we have immediate support at 4104 which if held can give us another bounce in the early sessions giving us a move upside into the 4140-50 regions initially.
Above that level there is a level sticking out sitting at 4173 with the extension level 4192 which if targeted is the level to keep an eye on for us. A break above there and it’s likely we will attempt to swing high from a lot higher up which we will need to navigate level to level. But a RIP there would be ideal if it happens with a clean reversal.
On the flip, we do want to see lower pricing on gold as we feel it’s not only needed, but it will give buyers better opportunities to get in for better positioning to carry trades upside into the higher target levels we have active. As we approach the end of the month, it's going to be another whipsaw and we would hope to complete the move, or, we'll most likely see some sideways accumulation leading into the next week.
KOG’s bias for the week:
Bullish above 4095 with the ideal target 4274
Bearish below 4095 with the ideal target 4025
RED BOX TARGETS:
Break above 4115 for 4123, 4125 and 4140 in extension of the move
Break below 4095 for 4080, 4065 and 4050 in extension of the move
Please do support us by hitting the like button, leaving a comment, and giving us a follow. We’ve been doing this for a long time now providing traders with in-depth free analysis on Gold, so your likes and comments are very much appreciated.
As always, trade safe.
KOG

GOLD 1H CHART ROUTE MAP UPDATE & TRADING PLAN FOR THE WEEKHey Everyone,
Please see our updated 1h chart levels and targets for the coming week.
We are seeing price play between two weighted levels with a gap above at 4275 and a gap below at 4229. We will need to see ema5 cross and lock on either weighted level to determine the next range.
We will see levels tested side by side until one of the weighted levels break and lock to confirm direction for the next range.
We will keep the above in mind when taking buys from dips. Our updated levels and weighted levels will allow us to track the movement down and then catch bounces up.
We will continue to buy dips using our support levels taking 20 to 40 pips. As stated before each of our level structures give 20 to 40 pip bounces, which is enough for a nice entry and exit. If you back test the levels we shared every week for the past 24 months, you can see how effectively they were used to trade with or against short/mid term swings and trends.
The swing range give bigger bounces then our weighted levels that's the difference between weighted levels and swing ranges.
BULLISH TARGET
275
EMA5 CROSS AND LOCK ABOVE 4275 WILL OPEN THE FOLLOWING BULLISH TARGETS
4320
EMA5 CROSS AND LOCK ABOVE 4320 WILL OPEN THE FOLLOWING BULLISH TARGET
4360
BEARISH TARGETS
4229
EMA5 CROSS AND LOCK BELOW 4229 WILL OPEN THE FOLLOWING BEARISH TARGET
4194
EMA5 CROSS AND LOCK BELOW 4194 WILL OPEN THE FOLLOWING BEARISH TARGET
4151
EMA5 CROSS AND LOCK BELOW 4151 WILL OPEN THE SWING RANGE
4122
4075
EMA5 CROSS AND LOCK BELOW 4075 WILL OPEN THE SECONDAARY SWING RANGE
4022
3955
As always, we will keep you all updated with regular updates throughout the week and how we manage the active ideas and setups. Thank you all for your likes, comments and follows, we really appreciate it!
Mr Gold
GoldViewFX

GOLD 4H CHART ROUTE MAP UPDATE & TRADING PLAN FOR THE WEEKHey Everyone,
Please see our updated 4h chart levels and targets for the coming week.
We are seeing price play between two weighted levels with a gap above at 4173 and a gap below at 4079. We will need to see ema5 cross and lock on either weighted level to determine the next range.
We will see levels tested side by side until one of the weighted levels break and lock to confirm direction for the next range.
We will keep the above in mind when taking buys from dips. Our updated levels and weighted levels will allow us to track the movement down and then catch bounces up.
We will continue to buy dips using our support levels taking 20 to 40 pips. As stated before each of our level structures give 20 to 40 pip bounces, which is enough for a nice entry and exit. If you back test the levels we shared every week for the past 24 months, you can see how effectively they were used to trade with or against short/mid term swings and trends.
The swing range give bigger bounces then our weighted levels that's the difference between weighted levels and swing ranges.
BULLISH TARGET
4173
EMA5 CROSS AND LOCK ABOVE 4173 WILL OPEN THE FOLLOWING BULLISH TARGETS
4264
EMA5 CROSS AND LOCK ABOVE 4264 WILL OPEN THE FOLLOWING BULLISH TARGET
4333
EMA5 CROSS AND LOCK ABOVE 4333 WILL OPEN THE FOLLOWING BULLISH TARGET
4333
EMA5 CROSS AND LOCK ABOVE 4333 WILL OPEN THE FOLLOWING BULLISH TARGET
4422
EMA5 CROSS AND LOCK ABOVE 4422 WILL OPEN THE FOLLOWING BULLISH TARGET
4494
BEARISH TARGETS
4079
EMA5 CROSS AND LOCK BELOW 4079 WILL OPEN THE SWING RANGE
3985
3873
EMA5 CROSS AND LOCK BELOW 3873 WILL OPEN THE SECONDARY SWING RANGE
3741
3632
As always, we will keep you all updated with regular updates throughout the week and how we manage the active ideas and setups. Thank you all for your likes, comments and follows, we really appreciate it!
Mr Gold
GoldViewFX

XAUUSD Long: Bulls Preparing for the Next Impulse Toward 4180Hello, traders! Gold (XAUUSD) continues to move within a strong bullish structure, defined by a clear Ascending Channel. The market has shown steady buyer strength, forming consistent higher highs and higher lows. Along this uptrend, price has broken resistance level — most notably around 3950, turning him into new support zone. After reaching the upper part of the channel near the Supply Zone (around 4250), the price entered a corrective phase, retesting the midline of the ascending channel.
This correction appears healthy within the broader bullish context, as it aligns with previous pivot points and areas where demand has repeatedly returned.
Currently, the market is trading between the Support Zone (around 3950) and the Supply Zone (around 4100–4250). Buyers have recently defended the lower boundary of the channel, suggesting potential continuation to the upside if momentum sustains.
My main scenario anticipates a bullish continuation from the current pivot zone.
If the price successfully holds above the Demand Line and breaks through 4100, I expect a further move toward the 4180–4250 resistance area — which aligns with the top of the channel and prior supply zone.In my opinion, this structure still favors the bulls, and any correction toward 3950 would likely offer a buying opportunity within the prevailing uptrend.Therefore, my target (TP) is set at 4180, aiming for a retest of the channel’s upper resistance line. Manage your risk!
