XAUUSD How to become successful in forex and stock trading: 1.Master fundamentals and technical analysis. 2,Build and follow a solid trading plan. 3.Apply strict risk management (1–2% rule). 4.Stay disciplined—control fear and greed. 5.Record and analyze every trade. 6.Focus on high-quality setups only. 7.Diversify across assets and markets. 8.Keep evolving—study, adapt, and grow daily.
Trade ideas

GOLD Elliott Wave – Daily: Possible Expanding Flat ScenarioThis is a speculative Elliott Wave possibility being monitored on the daily XAUUSD chart. While the structure could develop as a complex expanding flat correction (Wave IV), this scenario requires significant fundamental confirmation and price action validation before it becomes the primary count.
Daily Structure (Speculative):
Wave (i)–(ii)–(iii): Completed impulse sequence
Wave (IV): Potential expanding flat if structure develops (currently not confirmed)
Wave C downside: If this unfolds, targets would align with 1.618 extension (~3,630.262) and base channel support (~2,920.49)
Important caveats:
This is an extremely bearish scenario and remains highly speculative
Fundamental backdrop would need to support a sustained breakdown
Current intraday ABC structures and bounces remain the primary near-term focus
Price action and momentum must validate this pattern; structure alone is insufficient
Fundamentals to monitor for activation:
Watch for shifts in:
USD strength: Sustained dollar rally weakens gold demand
Fed policy: Rate cuts or dovish pivot reduces real yields
Geopolitical safe-haven demand: Reduced flight-to-safety buying
Real interest rates: Lower real rates typically support gold; rising rates are bearish
Central bank positioning: Any shift away from gold accumulation
If these fundamentals don't shift in the bearish direction, the expanding flat scenario loses conviction and intraday bounces become the primary focus.
Bottom line: This expanding flat is a possibility to monitor, not a confirmed roadmap. Trade the intraday structure and bounces; watch for both technical and fundamental confirmations before committing to this deeper bearish scenario.

Gold will continue to fluctuate within a narrow range.
I. Market Dynamics Summary
Macro Policy Expectations:
The market widely expects the Federal Reserve to announce an interest rate cut at this week's meeting (probability around 90%). If realized, this will enhance the appeal of non-yielding assets like gold.
White House Economic Advisor Hassett emphasized that "the Fed should adjust policies dynamically based on data," leaving uncertainty about the medium- to long-term rate cut path (cumulative cuts expected to be less than 75 basis points by the end of 2026).
Geopolitical and Safe-Haven Sentiment:
The Ukraine crisis persists, with ongoing negotiations for Western aid and potential peace agreements with Russia.
Russia's announcement to ban gold bar exports starting in 2026 adds uncertainty to the supply side.
Recent Price Volatility:
On Monday (December 8), spot gold surged initially but retreated, plummeting over $20 during the U.S. session to $4,176 per ounce, turning negative for the day.
II. Technical Analysis
Trend Assessment:
Overall consolidation with a bearish bias: Gold prices have shown weak rebounds recently, consistently facing resistance below $4,220, indicating a consolidating downtrend.
Key Resistance and Support Levels:
Resistance: $4,200–$4,205 (short-term pivotal level).
Support: $4,160–$4,165 (a break below could lead to further declines).
Hourly Chart Signals:
Bearish Engulfing Pattern: A large bearish candlestick during Monday's U.S. session engulfed prior gains, signaling strengthening bearish momentum.
Moving Average Pressure: Rebounds are suppressed by short-term moving averages. Failure to break above $4,200 may extend the downtrend.
III. Trading Strategy Recommendations
Core Approach: Prioritize selling on rallies, with light long positions at key support levels, while strictly managing risks.
Short Strategy (Primary Direction):
Entry Points: Sell in batches at $4,195–$4,200.
Stop Loss: $4,208–$4,210.
Targets: $4,180 → $4,170, with a break below eyeing $4,160.
Long Strategy (Secondary Direction):
Entry Points: Buy lightly at $4,160–$4,165.
Stop Loss: $4,152–$4,155.
Targets: $4,175 → $4,185, with a break above targeting $4,195.
IV. Risk Warnings
Event Risks:
The Fed's interest rate decision (to be announced on Wednesday) may trigger sharp volatility. It is advised to reduce positions or exit before the announcement.
Sudden geopolitical developments could temporarily boost safe-haven demand.
Trading Discipline:
Set strict stop-loss orders to avoid holding losing positions.
Limit position sizing to 5%–10% of capital. Avoid chasing rallies or selling off in consolidating markets.

Gold Intraday Trading Plan 12/9/2025Gold indeed broke the support line as expected yesterday. Further drop is expected as daily candle is still red. I will sell from 4199 and 1st target is 4165 and final target is 4153.

Elise | XAUUSD – Bullish Rejection Trendline ContinuationOANDA:XAUUSD
Gold is holding a clear bullish structure with repeated support bounces from the rising trendline. Price previously rejected from the 4,250–4,259 supply zone, and if the trendline continues to hold, we may see another retest of resistance.
Scenarios
🔼 Bullish Continuation
If price respects the trendline:
🎯 Target 1 → 4,227
🎯 Target 2 → 4,241.50
🎯 Target 3 → 4,250–4,259 (major supply sweep zone)
🔽 Bearish Retest (Invalidation)
Break and close below 4,198 may retest the support zone:
🟢 Buy zone (secondary) → 4,175–4,165
Below 4,165 invalidates current bullish flow.
⚠️ This analysis is for study and educational purpose only — not financial advice.

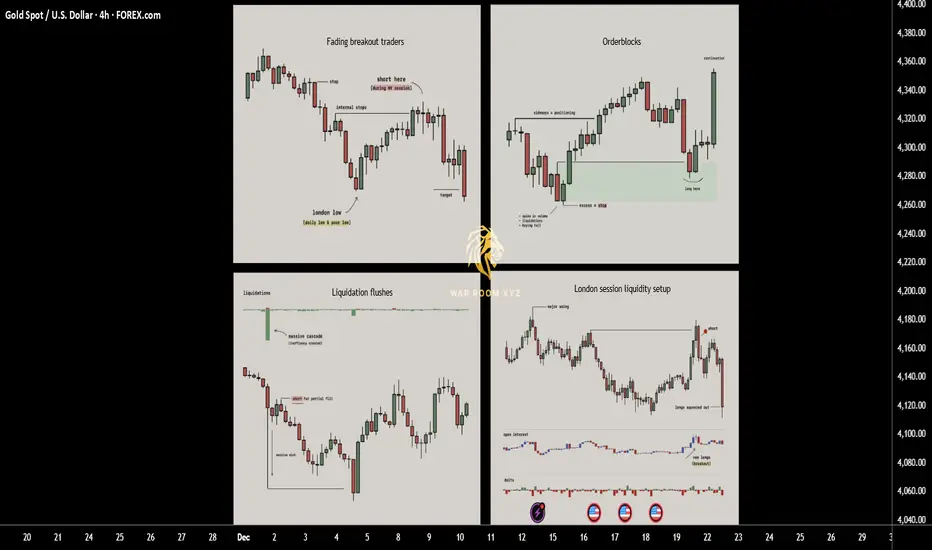
How Price Really Moves: 4 Entry Triggers Driven by LiquidityThis breakdown explains four recurring entry triggers that appear consistently across real market structure.
These are not indicators and not prediction tools. They are observable behaviors driven by liquidity, positioning, and trader psychology.
Each trigger is rooted in why price moves, not what price might do next.
1. Fading breakout traders (Failed Momentum / Trap Model)
When price breaks a key level and open interest jumps, breakout traders rush in expecting continuation. If price quickly snaps back, those new traders become trapped and their exits fuel a move in the opposite direction. This creates one of the cleanest reversal triggers since you are trading directly against failed momentum.
► What usually happens
Markets frequently approach obvious highs, lows, or range boundaries where:
•Retail breakout traders anticipate continuation
•Algorithms and short-term momentum systems enter aggressively
•Open interest or volume often expands rapidly
At this moment, new positions are created late , directly into resistance or support.
► The key failure
If price:
•Breaks a key level
•Fails to hold acceptance beyond it
•Quickly closes back inside the prior range
Then the breakout has failed structurally.
This means:
•Buyers who entered above resistance are now trapped
•Sellers who entered below support are trapped
•Their exits (stops + panic closes) become fuel for the opposite move
► Why this works
Markets move efficiently when traders are positioned correctly.
They move violently when traders are positioned incorrectly.
A failed breakout converts hope-based positions into forced exits.
► Educational takeaway
You are not trading the level,
you are trading the failure of belief at the level.
This is why failed breakouts often produce:
•Fast reversals
•Clean directional candles
•Strong continuation after rejection
2. Liquidation flushes (Forced Exit & Rebalance Model)
Sharp liquidation events create long wicks and temporary price inefficiencies. Markets tend to rebalance after these shocks as liquidity returns, which is why these wicks often get filled quickly. This setup works well in volatile phases and near exhaustion points where forced selling or buying pushes price too far.
► What a liquidation flush is
A liquidation flush occurs when:
•Price moves aggressively in one direction
•Overleveraged positions are forcibly closed
•Stops and liquidations cascade simultaneously
This often creates:
•Long wicks
•One-sided impulsive candles
•Temporary price inefficiencies
Importantly, this move is not driven by new conviction, but by forced exits.
► What happens after
Once forced liquidations are complete:
•Selling or buying pressure rapidly decreases
•Liquidity returns to the market
•Price frequently retraces part or all of the wick
This retracement is not random
it is the market rebalancing after stress.
► Where flushes matter most
Liquidation flushes are most meaningful when they occur:
•Near prior highs/lows
•At range extremes
•After extended directional moves
•During high-volatility sessions
► Educational takeaway
A liquidation wick does not mean “strong trend”.
It often means the move is temporarily exhausted.
You are not trading momentum,
you are trading the absence of remaining pressure.
3. Orderblocks
Orderblocks are zones where previous heavy participation occurred, usually during sideways movements before a strong move away. When price revisits these levels, the same participants often defend the area, creating reliable reaction points. Clean pivots with no messy wicks are the strongest since they signal clear institutional activity.
► What an orderblock represents
Orderblocks are areas where:
•Large participants accumulated or distributed positions
•Price moved sideways briefly
•A strong directional move followed immediately after
This sideways phase exists because large players cannot enter all at once without moving price against themselves.
► Why orderblocks matter
•When price returns to these zones:
•Previous participants may still be active
•Unfilled orders may remain
•Defensive reactions are more likely than random continuation
Clean orderblocks typically show:
•Tight consolidation
•Minimal wicks
•Strong departure afterward
Messy structures often indicate mixed participation and weaker reactions.
► How orderblocks are used
Orderblocks are reaction zones , not signals.
They provide:
•Logical areas to expect interest
•Defined risk zones
•Context for entry triggers like wicks or failed breaks
► Educational takeaway
Orderblocks work because institutions remember their prices , even if retail traders forget them.
You are trading where participation previously mattered, not arbitrary support or resistance.
4. London session liquidity setup
London frequently sets the daily low or high early in the session. Later in the day price often returns to sweep internal liquidity around that level before continuing the trend. This repeatable behavior offers structured entries based on predictable liquidity grabs tied to session mechanics.
► Why London matters
The London session is:
•One of the highest liquidity windows globally
•Often responsible for setting the initial daily structure
•Heavily watched by institutions and algorithms
In many markets, London establishes:
•The daily high
•The daily low
Or a key internal liquidity level early in the session
► The repeatable behavior
Later in the day (often London continuation or New York):
•Price returns to that London high or low
•Sweeps internal liquidity around it
•Rejects after stops are collected
•Continues in the higher-timeframe direction
This is not coincidence,
it is session-based liquidity engineering.
► Why it works
Institutions prefer:
•Liquidity-rich entries
•Known pools of resting stops
•Session transitions for execution
London levels provide exactly that.
► Educational takeaway
Sessions are not just time zones,
they are liquidity cycles.
Understanding when liquidity is created is just as important as where.
How These Triggers Fit Together
These models are not standalone strategies.
They are contextual tools.
Very often:
•A London sweep causes a liquidation wick
•A failed breakout forms at an orderblock
•A liquidation flush completes a failed momentum move
The strongest setups occur when multiple triggers overlap , but each can stand alone as a learning framework.
Why These Triggers Work Long-Term
They work because they are based on:
• Trader positioning
• Forced behavior (stops, liquidations)
• Institutional execution constraints
• Repeating session mechanics
They do not rely on:
•Indicator crossovers
•Lagging calculations
•Pattern prediction
Price moves because someone is forced to act.
These triggers show where and why that happens.
These 4 triggers work because they exploit trapped traders, forced liquidations and consistent liquidity patterns rather than relying on indicators. Keep them simple, wait for clean context and let the setups come to you.
Note
These concepts are:
•Descriptive, not predictive
•Contextual, not mechanical
•Dependent on execution skill and risk management
The goal is not to trade more,
it is to wait for situations where the market gives you an advantage.
I have made a script which might help identify all 4 triggers.
Disclaimer
The script is provided for educational and informational purposes only.
It does not constitute financial advice, investment advice, or a recommendation to buy or sell any instrument.
The script does not execute trades, manage risk, or replace the need for trader discretion. Market behavior can change quickly, and past behavior detected by the script does not ensure similar future outcomes.
Users should test the script on demo or simulation environments before applying it to live markets and must maintain full responsibility for their own risk management, position sizing, and trade execution.
Trading involves risk, and losses can exceed deposits. By using the script, you acknowledge that you understand and accept all associated risks.
GOLD ANALYSIS What’s Moving the Market Today? December 08, 2025FOREXCOM:XAUUSD GOLD ANALYSIS What’s Moving the Market Today? (December 08, 2025)
Welcome back to Trade with DECRYPTERS, where we decode smart-money footprints into clean, actionable buy & sell zones.
Keep it simple. Trust the levels. Follow the plan.
📰 Market Overview
Gold is holding firm above the mid-range after reacting cleanly from discount levels last week. Price is slowly rotating upward, respecting the 4200–4230 structure while approaching premium liquidity pockets. Despite short-term USD fluctuations, the macro trend remains bullish, supported by dovish rate expectations, geopolitical uncertainty, and aggressive central-bank accumulation.
The U.S. Dollar Index stays soft, unable to break key resistance, keeping gold supported. Treasury yields remain elevated but are no longer rising a positive environment for non-yielding assets like gold. With the December 9–10 FOMC meeting ahead, markets are positioning for volatility but remain structurally bullish.
Smart money continues to accumulate dips and distribute premium, maintaining a clean bullish rotation.
🔍 Key Fundamentals Driving Today’s Move
📈 87–90% probability of a December Fed rate cut
→ Lower yield competition boosts gold demand.
💵 USD softening after CPI & ISM weakness
→ Supports upside continuation.
🌍 Geopolitical tensions (US–China + Middle East)
→ Sustains safe-haven flows.
🏦 China adds 11 tonnes of gold in December (13th month of accumulation)
→ Reinforces structural demand.
📊 Bond market volatility cooling
→ Allows gold to stabilise and grind higher.
Gold’s strength continues to be driven by macro uncertainty + dedollarization + institutional accumulation.
📰 Insights From Key Sources
“Market pricing ~88% probability of 25bp cut in December.”
“Fed officials reiterate: easing will be gradual but necessary.”
Highlights renewed talk about US gold revaluation scenarios due to debt levels.
Notes increasing chatter about BRICS gold-backed settlement trials gaining traction.
Reports strong ETF inflows, highest in 18 months.
Notes ongoing US–China tariff tensions boosting safe-haven bids.
Confirms silver outperforming gold YTD, but gold remains the institutional favourite.
Highlights supply shortages and increased miner exploration efforts globally.
These sources show a unified narrative: institutions remain buyers, and macro conditions favour further upside.
📆 KEY EVENTS TO WATCH
🔸 JOLTS Job Openings (Tuesday)
Weak data → Boosts rate-cut expectations → Bullish for gold
Strong data → Temporary push into sell zones → Liquidity grabs likely
🔸 Geopolitical Risk Rotation
🌍 Tensions increase → Spikes toward premium zones
🌤️ Calm environment → Controlled dips into discount levels
Trend remains bullish unless the 4122 structure breaks.
🟩 GOLD TECHNICAL LEVELS
Gold continues to respect its bullish structure, rotating efficiently between Smart Money Sell ➝ Discount Buy Zones.
Price is currently sitting between scalp sell and major SM sell zones.
🟩 📌 SMART MONEY BUY ORDERS: 4138 – 4122
Primary institutional demand with deep discount liquidity.
Expect:
✔ Strong reaction on first tap
✔ Accumulation wicks & mitigation plays
✔ Higher-low formation if trend continues
Break below 4122 opens drawdown toward 4085 → 4050.
🟩 📌 SCALP BUY AREA: 4203 – 4189
Short-term discount region inside the mid-range.
Ideal for:
✔ Intraday continuation longs
✔ Retracement buy setups
✔ Liquidity grab reactions
Lose 4189 → Price rotates back to SM Buy Orders (4138–4122).
🟧 📌 SCALP SELL AREA: 4222 – 4209
Short-term distribution block.
Expect:
✔ Quick reaction shorts
✔ Intraday pullbacks
✔ Stop runs before premium sweep
Failure to hold below 4209 → Expansion toward 4238+.
🔺 📌 SMART MONEY SELL AREA: 4238 – 4248
Major premium sell zone — high probability reversal area.
Contains heavy institutional distribution.
Expect:
✔ Manipulation wicks above prior highs
✔ Liquidity grabs
✔ Swing short setups
Break & hold above 4248 opens pathway toward:
➡ 4264 → 4284 → 4310
📌 Conclusion
Gold remains firmly bullish as long as 4138–4122 holds, with smart money maintaining clear accumulation at discount and distribution at premium. With FOMC approaching, expect engineered volatility before the real move unfolds. As long as macro conditions stay dovish and demand stays strong, the path of least resistance remains to the upside. Stay patient, trust the zones, and execute only where smart money operates.
🙌 Support the Analysis
If this breakdown brought value to your trading:
👍 Drop a like
💬 Comment your levels
📈 Share your charts with the community
Let’s grow together.
Best Regards,
M. MOIZ KHATTAK | Founder — TRADE WITH DECRYPTERS

Gold Bulls Strong, but Watch Selling Pressure Near 4300The combination of Wednesday’s rate decision and yesterday’s employment data delivered a strong boost to gold. If the FOMC decision served as the fuse, then the weak labor report was the match that ignited it. Together, they pushed gold sharply higher, once again breaking above 4280. This area is essentially entering historical highs, and the selling pressure here will be another significant test for the bulls.
From a technical standpoint, bullish momentum remains intact. However, as I noted before, the higher the price climbs, the heavier the selling pressure becomes. Therefore, while long positions can still be considered, targets need to be managed carefully. The medium-term outlook remains constructive given the macro backdrop, but in the short term, I recommend avoiding excessive optimism. When gold approaches 4300 — or breaks above it — do not blindly chase higher levels unless there is a clear and healthy pullback.
Looking ahead, attention should remain on whether economic data continues to weaken, whether the Federal Reserve maintains a cautious pace of rate cuts, whether global economic concerns intensify, and whether geopolitical tensions further escalate. If these core drivers continue to support gold, then breaking above the 4381 high would only be a matter of time.
Today is Friday, and the data calendar is relatively quiet, though several economic-related speeches are scheduled and deserve moderate attention.
From a technical perspective, first watch the 4280–4300 zone for selling pressure. On the downside, initial support sits at 4260–4240, with particular focus on the 4256–4248 line.
Trading approach: buy on dips, sell on rallies, and avoid chasing extended moves.

The downward trend in gold prices is likely to continue.
news:
The Federal Reserve cut interest rates by 25 basis points as expected, fully in line with market expectations.
However, internal opinions diverged the most this year, with the statement signaling a "hawkish rate cut," predicting a very slow pace of easing in the future, with only one rate cut expected in the next two years.
Because this statement was not significantly different from previous market expectations, although it presented a hawkish signal, it was not as strong as previously anticipated. Gold prices initially fell after the data release but then rose, breaking through the key level of 4230 immediately after Powell's speech.
This indicates that the market has largely priced in this data release. With the subsequent release of non-farm payroll and CPI data, if the cooling labor market and inflation cannot be controlled, gold and silver may face another round of declines.
Technical aspects:
1. The daily moving averages MA5 and MA10 are converging and flattening, indicating a sideways price movement. The MACD indicator is also converging and flattening, further suggesting a sideways price movement. Currently, daily support is around the parabolic retracement level and the middle Bollinger Band, corresponding to the 4175-4165 range. In the short term, the daily chart is expected to remain within the large range of 4260-4170.
2. On the 4-hour chart, the MACD is currently consolidating near the zero line with decreasing volume, and the candlestick has also fallen back to around 4200, near the middle Bollinger Band. Currently, all 4-hour moving averages are intertwined around the middle Bollinger Band, indicating that the price is oscillating around this level, within the 4190-4130 range.
3. On the hourly chart, the MACD is currently showing a bearish crossover with increasing volume, and the stochastic oscillator is rapidly moving downwards into oversold territory, indicating a weak and sideways price movement. Short-term support is at the MA60, around 4200. A break below this level will likely lead to further downward movement towards the lower Bollinger Band, currently around 4160.
Strategy Signals:
Buy at 4235-40, stop loss : 4250, target: 4210, 4190, 4160

Gold Analysis: Volatility Ahead in NY Session (Dec 11, 2025)FXOPEN:XAUUSD GOLD ANALYSIS VOLATILITY AHEAD IN NY SESSION (December 11, 2025)
Welcome back to Trade with DECRYPTERS
*Market Overview*
Gold rallied to $4,232/oz after the Fed’s third straight 25bp cut weakened the dollar and eased yields, giving bullion classic upside fuel. Silver outperformed with a 1.9% jump to a new all-time high amid a historic squeeze, while gold’s gains were limited by the Fed’s hawkish 2026 dot plot. Powell’s announcement of $40B/month Treasury bill buys acted as stealth QE, lifting both risk assets and safe haven flows. China’s continued gold accumulation and elevated geopolitical risks added further support. Overall, gold holds a bullish bias toward $4,300 as long as DXY stays below 98.5.
*Key Fundamentals*
Spot Gold: $4,215/oz, up 57% YTD, with 50+ ATHs showing strong momentum.
Central Banks: 254t bought YTD, on track for 1,000t/year a powerful structural floor.
ETF Flows: $64B inflows (record AUM $530B; holdings 3,932t), signaling surging investment demand.
Inflation: CPI ~3% with Nov expected 2.7–2.99%; real yields near 2%, supportive for gold.
Dollar & Yields: DXY at 98.59 (soft), 10Y at 4.13% (low real yields) both bullish tailwinds for gold.
*Geopolitics*
1. China Warns Against US Tariffs
Rising US China trade tensions pushed gold up and pressured tech/Asian markets.
2. US Tech Export Curbs on China
New US restrictions on semiconductors/software lifted gold and hurt tech stocks, especially chipmakers.
3. Israel Iran Tensions Increase
War rhetoric boosted safe-haven buying (gold, oil) and weakened global equities.
4. US China Trade Truce Talks Fail
Talk breakdown revived trade-war fears, increasing gold ETF inflows and pressuring EM currencies.
5. Houthi Attacks in Red Sea
Shipping disruptions lifted oil and gold, increasing market volatility and hurting shipping stocks.
Emerging Flashpoints
South Korea, Syria, and European debt worries added fresh volatility, pushing the GPR index higher and reinforcing upside risks for gold and other safe-haven assets.
*Risk-On/Risk-Off Analysis*
1. Yields Stabilized After Fed Cut but Stay Elevated
Treasury yields eased slightly after the Fed’s 25bp cut (10-yr at 4.13%), but real yields remain high (~2.05%), signaling persistent inflation pressure and fewer expected cuts in 2026.
2. Market Sentiment = Mild Tactical Risk-Off
Yen carry unwinds, tariff fears, and the Fed’s cautious outlook have shifted markets into a 55/45 risk-off tilt, supporting gold and Treasuries, even as U.S. equities remain resilient with low VIX.
3. Cross-Asset Signals Flash Mixed Outlook
Stocks rise on strong earnings and AI demand, but rising yields (-0.85 correlation), a soft USD (-0.75 correlation with gold), and global policy shifts (BoJ hikes) create a fragile setup where risk-on/bullish momentum depends heavily on next week’s CPI.
*Key Insights From Credible Sources*
Trump Comments on Markets & Growth
Trump expressed extremely bullish views, suggesting GDP could reach 20–25% and that markets should continue rising adding short-term optimism to equities and risk assets.
Powell Comment on Housing
Powell said a 0.25% rate cut won’t significantly improve housing affordability, signaling limited impact of small cuts on the housing market and keeping pressure on real estate linked assets.
*Key Events To Watch*
🔸 US Unemployment Claims (TODAY — HIGH IMPACT)
Higher claims → Weak labor → Dovish → Bullish gold
Lower claims → Strong labor → Hawkish → Bearish gold
Expect immediate spike reactions toward your zones.
*Conclusion*
Gold remains supported by strong macro foundations Fed easing, a softer dollar, and record central-bank demand keeping the broader trend firmly bullish above $4,200. Geopolitical tensions and rising risk-off flows continue to fuel safe-haven demand, while ETF inflows reinforce a structural floor. Although yields remain elevated and sentiment is cautiously mixed, the path toward $4,300 stays intact as long as DXY holds below 98.5. With high-impact labor data ahead, expect sharp intraday volatility, but the overall bias remains upward.
Support the Analysis
If this breakdown added value to your trading:
👍 Drop a like
💬 Comment your levels
📈 Share your charts with the community
Let’s grow together.
Best Regards,
M. MOIZ KHATTAK | Founder — TRADE WITH DECRYPTERS

XAUUSD: Market Analysis and Strategy for December 10thGold Technical Analysis:
Daily Resistance: 4260, Support: 4133
4-Hour Resistance: 4241, Support: 4170
1-Hour Resistance: 4220, Support: 4190
The Federal Reserve is about to announce its interest rate decision, with the market widely expecting a 25 basis point rate cut. The focus of this meeting is whether the Fed will release a "hawkish" signal regarding rate cuts. We need to closely monitor the decision statement, economic forecasts, and Powell's speech to assess the policy path in the first half of 2026.
In the short term, gold still faces selling pressure at higher levels. The daily candlestick chart showed a downward trend starting in the European session, further confirming the recent lack of strong continuity in both bullish and bearish movements. Pay attention to the reaction around the trendline support level of 4160. The widening Bollinger Bands provide some support for short-term upward movement.
Looking at the 1-hour chart, the price is trending downwards with consecutive declines in the candlestick chart. The moving averages are crossing downwards. Watch for support around 4190, the low of the previous US session. A break below this level could lead to a further test of 4160 in the short term.
Trading Strategy:
BUY: 4170~4160
SELL: 4260 (near)
More Analysis →

Gold Price Expected to Fall: $4150Gold Price Expected to Fall: $4150
As shown on the 2-hour chart:
We saw a false breakout in gold prices, followed by a decline today.
But is it truly stable?
Is the downtrend really safe?
At least in today's trading, we've made a respectable profit of $3200 per lot.
Continuing our trend-following strategy:
We now judge the probability of a genuine breakout in gold prices to be over 70%.
Based on this assumption:
Effective Resistance Level for Gold: $4200-$4190
Effective Support Level for Gold: $4180
The current trading strategy is very clear:
Sell: $4190
Stop Loss: $4205
Take Profit: $4150-$4100
There are countless profitable strategies and trading methods.
But from a technical analysis perspective, this strategy is currently the most cost-effective.
We believe the gold price will fall below $4150.
Therefore, this strategy is ideal.
You can understand my trading rhythm by viewing my real trading records on my channel. Through long-term practice and trading experience, my trading philosophy and methods have proven highly effective for me.
I have led my team to achieve an average weekly return of nearly 100 points.
We only release 1-2 high-quality signals per day.
But fewer signals do not mean less profit.
In fact, our pace is very slow and relaxed.
Now, we will continue to observe whether the gold price will fall as we expect and reach the next target: $4150.

GOLD Update (Before/After) & Year-End Offer!✅ GOLD OANDA:XAUUSD moved exactly as expected from this chart.
If you followed the plan with proper risk management, we hope you banked profit and stayed disciplined through the move.
The macro backdrop we highlighted remains supportive overall, and we’ll keep sharing clean, structured analysis like this so you’re not guessing, you’re executing.
Year-End Offer! 🎁🎄
WTW Pro at $99/month for the next 3 months.
This is your chance to start 2026 with clarity, confidence, and real market mastery.
For the first 10 traders only:
Send us an email at info@wetradewaves.com with the subject line “Year End Gift”, and our team will send you your exclusive coupon code within 24 hours to access **WTW Pro at $99/month for the next 3 months.
This offer is exclusively for traders who are completely new to WTW.
Claim your spot now.
WTW Team
**Disclosure:** We are part of Trade Nation’s influencer program and receive a monthly fee for using their TradingView charts in our analysis.

Bullish but not chasing the rally, will it test 4380 again?#XAUUSD TVC:GOLD OANDA:XAUUSD
With a series of positive news recently, the market remains bullish in the short term. Judging from the Asian session, gold prices have been fluctuating at high levels. In the short term, they may test the resistance level of 4290-4300. We are bullish but will not chase the rise. Our trading strategy is still to buy on dips.
Short-term support is seen at 4260-4250. If the price retraces to this support level and holds, a small long position in gold can be considered. The key support level to watch remains unchanged at 4235-4225.

Gold prices rallied after consolidation.Gold Policy Outlook: Balancing Dovish Rate Cuts and Hawkish Guidance, Bullish Bias with Elevated Volatility
The current gold market is shaped by a delicate balance between dovish monetary actions and hawkish forward guidance. Dovish policies lay the fundamental support, while hawkish expectations cap short-term gains. Coupled with global policy divergence, this creates a "bullish but volatile" policy backdrop for gold.
--------------------------------------------------------------------------------
1. Dovish Actions Underpin the Bullish Foundation
Concrete easing measures provide solid fundamental support for gold, reducing holding costs and sustaining long-term bullish momentum.
- Rate Cut Cycle Confirmed with Clear Forward Guidance: The Fed delivered its third consecutive 25BP rate cut this year, bringing the federal funds rate to 3.5%-3.75% (a total of 75BP in 2025) — fully in line with market expectations. Powell explicitly stated that "rate hikes are not in the baseline scenario," eliminating the risk of policy reversal and stabilizing market sentiment .
- Covert QE Injects Liquidity: Starting December 12, the Fed will purchase $40 billion in short-term Treasury bonds within 30 days. Though framed as "reserve management," this move exceeds market expectations in both timing and scale, acting as a "quasi-QE" to inject substantial liquidity . It directly lowers the opportunity cost of holding non-interest-bearing gold and offsets the tightening sentiment from hawkish guidance .
- Political Pressure Sustains Easing Expectations: Trump publicly criticized the Fed for "insufficient rate cuts" and demanded rates be lowered to below 2% . Meanwhile, the high probability of dovish candidate Kevin Hassett taking over as the next Fed Chair — who has emphasized "significant room for rate cuts" — keeps 2026 easing expectations alive, providing ongoing policy dividends for gold .
--------------------------------------------------------------------------------
2. Hawkish Guidance Caps Short-Term Upside
Hawkish signals in policy communications trigger profit-taking by short-term capital, preventing unbridled gains and leading to oscillatory price action.
- Dot Plot Signals Slower Easing Rhythm: The Fed’s dot plot projects only one 25BP rate cut in 2026, falling short of the market’s previous expectation of two cuts. This indicates a deliberate slowdown in the easing pace, dampening overly optimistic market sentiment .
- Unprecedented Internal Divisions: The rate decision saw three dissenting votes — the first in six years — with two officials advocating for unchanged rates and one pushing for a 50BP cut . Among 19 officials, 7 favor pausing rate cuts entirely (3 even support hikes) while 8 call for more than one cut, reflecting extreme disagreements over the policy path . This fragmented consensus weakens the credibility of forward guidance and fuels market uncertainty .
- "Buy the Rumor, Sell the Fact" Reaction: The "dovish action + hawkish guidance" mix has sparked early signs of "buying the rumor, selling the fact." After the rate cut was implemented, short-term capital locked in profits, limiting gold’s upside momentum and leading to volatile sideways trading .
--------------------------------------------------------------------------------
3. Global Policy Divergence Creates Resonant Support
Divergent monetary paths across economies reinforce gold’s dual appeal as a liquidity-driven asset and safe haven, while amplifying volatility.
- Developed Markets Lean Dovish: The UAE central bank followed the Fed with a 25BP cut, and the Swiss National Bank maintained its negative interest rate stance . These moves align with the global dovish trend, providing a liquidity floor for gold .
- Emerging Markets Boost Strategic Buying: Amid policy divergence, emerging market central banks continue to accelerate gold purchases to diversify reserves, forming structural support for prices . This dovetails with the "dollar depreciation expectation" — the dollar index has fallen over 9% year-to-date, and its current stability around 98.64 does not reverse the long-term downward trend, benefiting dollar-denominated gold .
- Bullish Bias with Higher Volatility: The combination of "developed market easing underpinning + dollar weakness + central bank buying" keeps the overall policy backdrop bullish for gold . However, conflicting signals from the Fed’s "dovish actions vs. hawkish guidance" and internal divisions will likely exacerbate short-term market fluctuations, leading to a "range-bound upward" trend .
Gold trading strategy
buy:4255-4265
tp:4280-4290-4310
sl:4245

Gold Analysis: Fed Cut Ignites Rally Toward $4,300 TargetFXOPEN:XAUUSD GOLD ANALYSIS Bulls Target $4,300 as Fed Cut Sparks Fresh Momentum (Dec 12, 2025)
Welcome back to Trade with DECRYPTERS
🌍 MARKET OVERVIEW
Gold climbed to $4,224 on December 11, hitting a one month high after the Fed’s 25bps cut weakened the dollar and boosted safe-haven demand. Lower real yields and expectations of further easing in 2026 kept bullish momentum strong, supported by heavy central-bank buying led by China.
Geopolitical tensions, including the U.S. seizure of a Venezuelan tanker, added extra upside fuel. Silver also broke records above $64/oz, reflecting broad strength across precious metals. Analysts now eye $4,300–$4,400 into year-end, with volatility likely around upcoming NFP data.
📊 KEY FUNDAMENTALS
• Current Price: $4,268/oz (slightly lower intraday, -0.3%)
• Valuation Context: ~137% above 20-year avg.; ATH at $4,381 (Oct 2025)
• Global Reserves: ~36,000 tonnes; U.S. holds 8,133 tonnes (23% of total)
• Supply (Q3 2025): 1,313 tonnes — mine output 825t (+1.5% YoY) + recycled 344t (+6% YoY)
• Demand (Q3 2025): 1,313 tonnes (+3% YoY) driven by central-bank buying (220t Q3; 634t YTD) & strong investment flows
• YTD Performance: +61%, outperforming S&P 500 by 2.4×
• Outlook: Structural bullishness intact; 12-month forecasts near $4,465/oz
🌐 GEOPOLITICS
1️⃣ Russia Ukraine War
• Persistent conflict, sanctions, and NATO tensions keep volatility elevated
• Safe-haven demand remains strong
2️⃣ U.S. China Trade Tensions
• Trump’s 100% tariffs reignite the trade war, weakening USD
• BRICS pushback & China’s gold accumulation accelerate de-dollarization
3️⃣ Middle East Instability
• Gaza escalation & Iran-backed proxy attacks heighten global risk
• Temporary dips but repeated surges above $4,000
4️⃣ De Dollarization & BRICS Strategy
• Central banks accelerate gold buying to hedge USD weaponization
• 95% of global central bankers plan further gold purchases in 2026
5️⃣ Global Debt & Systemic Risks
• $324T global debt and U.S. $2T deficits fuel inflation fears
• Gold gains long-term support as trust in fiat declines
🔄 RISK-ON / RISK-OFF ANALYSIS
Gold’s +61% YTD surge reflects classic RORO flows, supported by stable yields & a weaker dollar. With the 10-year at 4.16%, opportunity costs stay low. Only a rise toward 4.5% could pressure prices back toward $4,000.
The DXY at 98.38 enhances gold affordability, where each 1% drop historically adds 0.5–1% to gold, amplified by 500+ tonnes of central bank buying.
Despite a low VIX (15.41) and strong equities (+30% YTD), gold continues to rally an unusual divergence driven by tariffs, inflation risk, and persistent geopolitical tensions. A VIX spike above 20 typically accelerates gold, while deep risk-on conditions may cause a 10 to 12% pullback.
📰 KEY INSIGHTS FROM CREDIBLE SOURCES
• Goldman Sachs reaffirmed a $4,900 target citing massive central-bank demand
• Gold & silver jumped ~1% on Fed dovishness & liquidity expansion (TGA -$78B)
• Fed plans to buy short end Treasuries → weaker USD → stronger gold
• Trump’s “run it hot” growth narrative boosts expectations of lower real yields
✅ CONCLUSION
Gold remains strongly bullish as macro conditions, Fed easing, and central bank accumulation create a solid structural floor above $4,150. Pullbacks are temporary, while geopolitical tensions and tariff-driven USD weakness support moves toward $4,300 - $4,400.
Subdued real yields keep opportunity costs low, and even in risk-on markets, gold's resilience highlights deep institutional demand. Momentum favors upside continuation into year-end unless yields spike aggressively.
🙌 SUPPORT THE ANALYSIS
If this breakdown added value to your trading:
👍 Drop a like
💬 Comment your levels
📈 Share your charts with the community
Let’s grow together.
Best Regards,
M. MOIZ KHATTAK | Founder - TRADE WITH DECRYPTERS

XAUUSD Bullish Move Above 4210XAUUSD is currently showing strong bullish momentum after breaking above 4210, indicating the market is likely to continue moving towards 4235. Buyers should look for pullbacks to 4199, as this level could provide an ideal entry for those looking to join the uptrend. With price action remaining bullish, a continued rise towards 4235 is anticipated.
The recent break above 4210 signals that the market is in an upward phase, supported by strong buying activity. Watch for further confirmation, such as a retest of the 4199 area, before entering. This area could act as a support zone, offering a solid entry for those looking to capture the next move higher.
Although the overall trend is bullish, traders should remain cautious and ensure proper risk management. A key aspect of this trade is waiting for confirmation on the pullback to 4199 before entering. Strong bullish momentum should push the market towards 4235, but price action should be monitored closely for any signs of reversal.
Traders should use stop-loss orders to protect against downside risk, with a target in the region of 4235. As the market approaches 4235, be alert to potential signs of exhaustion or reversal. This could indicate the end of the current uptrend or a temporary pullback. Always follow proper risk management and avoid chasing price if confirmation is not clear.

XAUUSD, Expecting sell from 4220XAUUSD, I am Expecting sell from 4220 with targets of 4208 & 4187 area.
good luck

GoldXAUUSD
- Change of Characteristics
- Symmetrical Triangle as an corrective pattern in Short Time Frame
- Consolidation Phase
- Order Block
- Fair Value Gap

XAUUSDDO YOU KNOW WHATS BEHIND THIS OR OTHER IDEAS?? in bio..
Preferably suitable for scalping and accurate as long as you watch carefully the price action with the drawn areas.
With your likes and comments, you give me enough energy to provide the best analysis on an ongoing basis.
And if you needed any analysis that was not on the page, you can ask me with a comment or a personal message.
Enjoy Trading ;)

Latest gold trading signalsFederal Reserve Chairman Jerome Powell will hold a new monetary policy press conference. With the market nearly certain that the Fed will cut interest rates this week, some analysts believe the Fed will implement a "hawkish rate cut," meaning that although rates will be cut, the wording of the statement, median forecasts, and Powell's remarks may all suggest a higher threshold for further rate cuts.
If the Fed's stance prompts the market to lower its expectations for two to three rate cuts next year, the dollar may find support. Traders are hesitant to act until they receive more clues about the Fed's rate cut path, focusing instead on the latest economic forecasts and Powell's press conference.
On the 4-hour chart, the candlestick is currently trading near the previous resistance zone along the short-term moving averages. However, the pullbacks during the session have been weak and short-lived, suggesting a continued slightly bullish trend in the short term. However, attention should be paid to potential short-term corrections.
Gold Trading Recommendations:
1. Sell gold in batches around 4220-4225 with 20% of your capital, stop loss at 8 points, target 4205-4195, break below to 4190.
2. Buy gold in batches around 4185-4190 with 20% of your capital, stop loss at 8 points, target 4210-4220, break above to 4230.

XAUUSD – LANA TRACKS ELLIOTT WAVE 5, PRIORITIZES SELLING ...XAUUSD – LANA TRACKS ELLIOTT WAVE 5, PRIORITIZES SELLING TOWARDS 4130
1. Fundamental Analysis
International capital is pouring into Japanese Government Bonds (JGB), accounting for ~65% of monthly transactions.
When the BOJ reduces bond purchases, JGB yields climb to multi-decade highs, turning Japan into a new source of "volatility export" for the global financial market.
Every capital withdrawal or reversal on JGB can spread to currency and commodity markets, including gold.
In this context, Lana prioritizes viewing gold through the lens of Elliott waves + liquidity, considering current increases mainly as technical rebounds in a deeper corrective structure.
2. Technical Analysis
On the M30 frame, Lana is monitoring the declining Elliott wave 5 structure:
The area around 4200 is acting as the end of wave 4, after which the price gradually weakens.
Wave 5 is expected to head towards the strong support area of 4128–4135, coinciding with the large demand box below.
Two intermediate support areas: 4164 – where the chart notes "Buy scalping".
4153 – an important bottom area and sellside liquidity.
4176–4178 is currently a short-term bottom: if decisively broken, Lana considers this a confirmation signal for wave 5 expansion.
3. Price Areas to Watch
Near resistance: Retest area around 4184–4187 (after breaking the bottom, it may rebound to test).
Support & wave target: 4164 and 4153: intermediate support, likely to react.
4135 – 4130 – 4112: expected price area to complete wave 5 & liquidity below.
4. Trading Scenarios
⭐️ Main Scenario – Sell according to Elliott wave 5
Condition: Only Sell when the price breaks and confirms the bottom 4176–4178.
Sell: below the area 4176–4178 (can wait for a retest around 4180–4184 for a better entry).
SL: 4184
TP: 4155 – 4130 – 4112
⭐️ Secondary Scenario – Short-term Buy scalping
Buy scalping: 4164
Target: short rebound of 10–15 points, suitable for quick trades, not holding positions for long.
This week, Lana maintains a primary Sell mindset, all Buy orders are only for scalping to catch rebounds, not against the main trend.
👉 Follow Lana on TradingView to receive the earliest gold updates directly on your phone. 💛

Stop!Loss|Market View: GOLD🙌 Stop!Loss team welcomes you❗️
In this post, we're going to talk about the near-term outlook for GOLD ☝️
Potential trade setup:
🔔Entry level: 4167.192
💰TP: 3900.356
⛔️SL: 4370.061
"Market View" - a brief analysis of trading instruments, covering the most important aspects of the FOREX market.
👇 In the comments 👇 you can type the trading instrument you'd like to analyze, and we'll talk about it in our next posts.
💬 Description: After breaking out of the accumulation in a symmetrical triangle, gold prices formed an accumulation near the 4200 level, indicating the emergence of a potential limit seller who, after breaking out of the accumulation, will sell the instrument to those willing to buy at the breakout. Against this backdrop, a downward movement is likely expected, and given the potential volatility this week, two scenarios are being considered.
Thanks for your support 🚀
Profits for all ✅
