XAU / USD 1 Hour ChartHello traders. Not saying I called the move down, but I called the move down. I am watching to see if we drop some more, or maybe I will grab a small Long position from the area marked on the chart. Big G gets a shout out. Be well and trade the trend. It is Friday, so I am not in any hurry to force or rush a trade. Have a good weekend. If i take a trade, it will be shortly, and I will post if I do.
Trade ideas

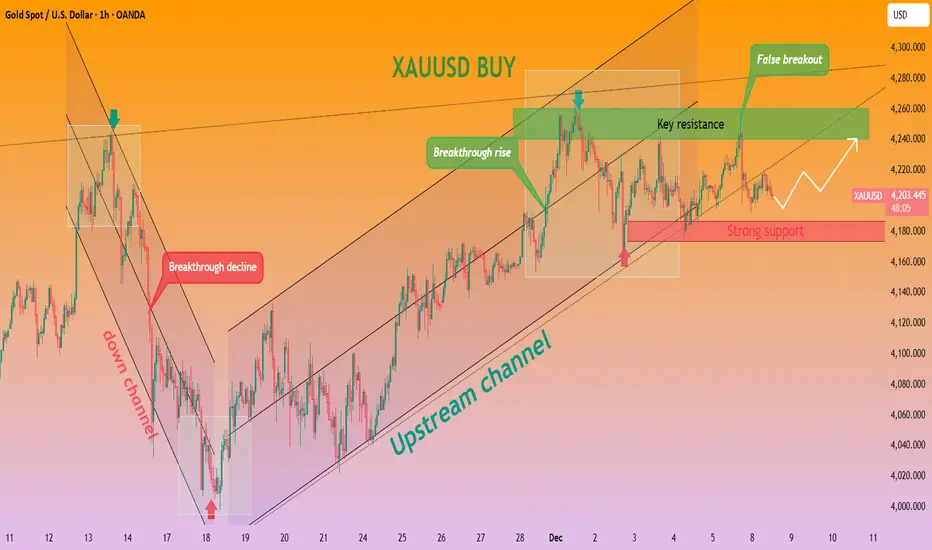
TIME TO BUY GOLD ... nowXAUUSD (GOLD) was recently in a short term downtrend for a few weeks but has now shown some clear bullish movements ahead. XAUUSD (Gold) has broken out of a downward trend channel that was acting as strong resistance, The price is very likely to head to the next strong resistance level which is marked as the take profit zone (green line). Time to buy gold now.

Report 12/12/25Report summary
U.S. equities remain supported by the “cut-and-cap” policy mix—Fed funds steady in a 3.50%–3.75% target range and the WSJ U.S. Prime Rate reset to 6.75%—which keeps financial conditions easier than a month ago. Into last night, the S&P 500 printed 6,901 (+0.21%) and the Dow’s latest all-time high stands at 48,704 (12/11), underscoring resilient risk appetite despite mixed micro headlines around AI capex pacing.
Labor and inventories data point to mid-cycle, not late-cycle: initial claims rose to 236k but remain in the prevailing 210k–250k channel, while wholesale inventories jumped 0.5% m/m in September—both consistent with a soft-landing glide path rather than abrupt slowing. That mix keeps the “growth-but-cooling inflation” narrative intact and helps explain why equities can rally alongside falling policy rates.
On the micro/tech tape, “Oracle renews worries on AI spending” captured a wobble in hyperscaler procurement pacing, but the headline momentum bias still tilts pro-AI after a marquee tie-up: Disney is set to invest $1bn in OpenAI—signaling détente between Hollywood IP owners and model builders and a fresh pipeline for AI-content tooling. That pairing supports AI infrastructure spend and related semis/software multiples on dips.
Geopolitics and energy
Two developments dominate risk premia. First, Europe continues to entertain channeling a large share of the roughly $200bn in frozen Russian assets into a Ukraine lending structure over the next two years. If formalized, this would tighten EU-Russia financial frictions, lift legal/policy uncertainty around reserve immobilization, and modestly support the euro’s policy credibility via a clearer fiscal backstop to Kyiv.
Second, the U.S. seizure of a tanker off Venezuela signals a tougher stance toward Caracas, incrementally raising headline risk for Caribbean/Latin crude logistics just as EIA reported U.S. commercial crude stocks down 1.8mb last week, refinery runs near 94.5%, and production hovering around a record 13.8mb/d—a fundamentally ample backdrop that blunts the geopolitical premium. Net, oil’s impulse skews choppy, not trend-breaking.
Policy currents to watch
Beyond the near-term rate setting, money-market plumbing is shifting in ways that matter to liquidity and dollar basis. With the prime rate cut to 6.75% and the effective fed funds rate sliding toward 3.64% alongside a lower SOFR print, the policy complex is tilting toward cheaper front-end funding. Historically, that mix leans mildly bearish USD on a broad basis unless growth differentials widen in America’s favor.
Asset-by-asset implications
XAUUSD (Gold). Spot reference prices show bullion around $4,226/oz on wholesale metrics today. In a regime of falling real front-end rates, sticky geopolitical frictions (Ukraine financing architecture; U.S.–Venezuela tension), and robust central-bank purchases, the path of least resistance remains buy-the-dip. Near-term risk is a stronger-than-expected U.S. activity run (claims stay low; inventories rebuild) that props real yields; otherwise, the balance of macro forces still supports $4.1k–$4.4k consolidation with upside skew on fresh shocks.
S&P 500. The index’s grind to 6,901 reflects positioning relief as “policy put” expectations harden and earnings breadth improves outside megacaps. AI-capex timing noise (e.g., Oracle caution) may keep factor rotations brisk, but Disney–OpenAI signals durable content-tech monetization routes into 2026. Base case: buy dips toward the 65-day moving average while the policy floor holds and labor remains non-recessionary.
Dow Jones Industrial Average. With cyclical financials/industrials bid into an easier front end, the Dow’s ATH at 48,704 confirms the “American re-acceleration without inflation flare” theme. If inventory rebuilding persists and capex steadies, the Dow should retain leadership vs. more duration-sensitive growth baskets. Monitor credit spreads for confirmation.
USDJPY. The Dollar-yen remains a function of front-end differentials and Japan’s local term-premium rise. With U.S. policy rates drifting lower and Japan’s yields at multi-decade highs, the incentive to fade USDJPY strength into policy-driven spikes is growing. Intervention risk increases if yen volatility re-accelerates around global event risk or if U.S. cuts outpace market-implied paths.
DXY (U.S. Dollar Index). Easing fed-funds settings and falling SOFR/FF effective prints are fundamentally dollar-negative on a multi-month view, but DXY path dependency will hinge on Europe’s fiscal-security stance and whether EU growth can re-converge. A credible EU mechanism to deploy Russian assets in support of Ukraine, if paired with modest fiscal-capex impulses, would reduce Europe’s policy-risk discount and weigh on DXY at the margin.
WTI/Brent (Crude Oil). Weekly EIA shows a modest crude draw, big gasoline build and utilization above 94%, while U.S. output sits near record highs. That supply cushion limits upside from geopolitics unless Venezuela enforcement escalates or Middle-East risks surge. Expect a whipsaw range with rallies capped by high U.S. production and product stock builds; dips supported by any new sanctions/transport incidents.
Strategic forecasts (3–6 months)
The most likely trajectory is a controlled U.S. disinflation with activity dispersion by sector. Claims and inventories argue against an imminent hard landing; the policy mix lowers discount rates and improves equity carry, while an incremental reduction in dollar carry tailwinds should favor non-U.S. risk selectively. In tech, headline jitter around AI opex/capex cadence won’t derail the structural thesis—especially as content/IP owners start partnering with model providers, implying more predictable monetization rails. That is supportive for semis, inference hardware, cloud capacity lessors, and the ad-tech recovery impulse through 2026.
In Europe, any formalization of the frozen-assets loan will harden the bloc’s political cohesion around Ukraine, with limited immediate macro spillovers but a medium-term lift to euro-area defense/capex outlays. That combination tends to compress trans-Atlantic policy-risk differentials and is modestly EUR-supportive if growth stabilizes.
On energy, the U.S. stance toward Venezuela raises the odds of episodic shipping and payments frictions, but given record U.S. output, the baseline is range-bound crude punctuated by geopolitically-driven squeezes rather than durable breakouts.
Fiscal and political implications
The U.S. policy mix—failed bipartisan effort to extend ACA subsidies, ongoing price-pressure concerns (food/fuel) and the White House’s consumer-cost messaging—keeps fiscal optics sensitive into 2026 premiums, but none of this dislodges the soft-landing baseline. The Disney–OpenAI arrangement underscores a regulatory-industrial equilibrium forming between Hollywood IP owners and AI companies, lowering litigation overhangs and channeling private capital into AI commercialization. Both dynamics are equity-positive and neutral-to-mildly negative USD via improved global risk sentiment.
In Europe, Ukraine-financing via Russian assets would entail legal engineering but, if advanced, signals a willingness to deploy novel fiscal/financial tools—an important precedent for crisis management and a mild tailwind for European risk assets if followed by defense/industry investment programs.
Key risks and opportunities
The principal near-term risk is an upside surprise in U.S. growth that re-steepens reals and forces a slower Fed easing path, pressuring gold and long-duration equities. A second risk is policy/tariff shocks that revive goods inflation and upset the disinflation glide. Geopolitically, escalation around Venezuelan enforcement or a new chokepoint incident would re-price crude’s term structure. Opportunities cluster in AI infrastructure (chips, data-center power and networking) on capex-timing drawdowns; high-quality cyclicals levered to an inventory rebuild; and gold exposure as a portfolio hedge while real rates drift lower and policy/geopolitical uncertainty persists.
If you’d like, say “ok” and I’ll extend with scenario maps (bull/base/bear) for each asset, including trigger levels, catalysts, and a positioning plan tailored to your portfolio constraints.

Gold: Watch 4228 as the Short-Term Pivot, Focus on Buying DipsUnder the influence of the FOMC’s 25bp rate cut yesterday, gold surged toward the 4248 area with significant volatility. Now that the rate-cut decision has been finalized, the conditions for trading purely on that expectation have passed; however, its subsequent impact will continue to create opportunities in the market. The series of economic releases before the holidays still deserve close attention. At the same time, developments in the Russia–Ukraine situation should be monitored. If peace negotiations progress smoothly and tensions ease, safe-haven demand for gold will weaken, putting short-term pressure on the bullish side.
Technically, fueled by news, the price broke through resistance near 4228 and tested the 4245-4250 area, but encountered significant selling pressure, returning to the 4207-4200 area. This trend is relatively healthy, but it also indicates that the market remains cautious.
Continue to focus on the 4223-28 area. If it can stabilize at this level, it means that the selling pressure has been largely released. With increased capital participation, there may be an opportunity to test the 4300 area before the holiday. If it cannot stabilize, and the Russia-Ukraine peace talks proceed smoothly, the bears may push the price down to around 4100 or even 4050.
Additionally, there is some data to watch in 7 hours.

XAUUSD Trendline Break & Bearish Retest SetupXAUUSD broke the trendline and is now retesting it with a strong rejection from the supply zone, indicating a potential drop toward the lower demand zone (4185–4195)

Dec 11, 2025 - XAUUSD GOLD Analysis and Potential Opportunity📊 Summary:
The combination of rate cuts and renewed bond-buying is strongly bullish for gold.
The primary plan remains buying pullbacks into support, as long as key support zones hold.
However, in an extreme scenario where price breaks 4170, and especially 4164, it would invalidate today’s bullish bias and require a full reassessment.
For today, the two most important supports to watch are 4220 and 4207:
• A break below 4220 may trigger a short-term pullback.
• Above these levels, the bullish trend remains intact, and I continue to favor long setups.
🔍 Key Levels to Watch:
• 4255 – Resistance
• 4250 – Resistance
• 4245 – Resistance
• 4239 – Resistance
• 4230 – Resistance
• 4220 – Key intraday support
• 4207 – Key support
• 4198–4200 – Support zone
• 4189 – Support
• 4182 – Support
📈 Asia Session Intraday Strategy:
SELL: If price breaks below 4220 → target 4216, with further downside toward 4211, 4207, 4205
BUY: If price holds above 4230 → target 4232, with further upside toward 4235, 4239, 4245

XAU/USD (Gold) – Market Structure & Liquidity OutlookGold is currently trading in a well-defined consolidation range within my marked blue zone, showing signs of balance after the impulsive move into this area. Price action over the recent sessions indicates compression, with multiple equal highs and lows forming — a classic sign that liquidity is building.
Key Levels
• Current Price Area: ~4,228
• Range High / Liquidity Pool: 4,255 – 4,265
• Range Low / Support: 4,195 – 4,205
• Higher Timeframe Demand (H4 Zone): 4,155 – 4,165
• Invalidation / Stop Loss: Below 4,175
Trade Bias
My bias remains bullish as long as price holds above the H4 demand zone.
The market has respected the blue range multiple times without a clean breakdown, suggesting stronger hands are accumulating positioning below resistance. I’m expecting price to first sweep the resting buy-side liquidity resting above the recent highs around 4,255–4,265, followed by a decisive break and acceptance above the blue zone.
A strong close above 4,265 would confirm a breakout from consolidation and open the door for continuation toward higher highs.
Execution Plan
• Entry Zone: Within the blue consolidation range on confirmation
• Target 1 (Liquidity Sweep): 4,260
• Target 2 (Continuation): New highs above 4,270
• Stop Loss: Below 4,175 (protecting against a deeper H4 demand sweep)
Risk Thesis
A sustained break and close below 4,175 would invalidate the bullish structure and suggest a deeper retracement into the H4 demand zone near 4,160.

XAU / USD 1 Hour ChartHello traders. I did not take the trade,but I just wanted to post that my analysis was spot on for the scalp trade. That is about all I got. Not gloating, just thankful to BIg G. Be well and trade the trend.

XAUUSD Delivered Excellent [ 610 PIPS] PROFITsAs I discussed throughout my TODAY'S Commentary
What was my stance & Postions:
I took buy in my early trade from at London session also shared my Setup and target was 4215 which XAUUSD delivered
Second hiting my first Target i have waited for Gold to deliver decent pullback and respect the previous BOS at $4200 - $4195 Belt I found such on $4194-4195 bos test. I have engaged big Lot set of Buying orders again along (#4185 Stop loss ) and closed my orders on $4220 .
I want to take this moment to congratulate the traders who followed my calls and patiently held their orders. Great job — enjoy the profits and have a great weekend.
Massive win of Day

XAU / USD 1 Hour ChartHello traders. My bad for not posting this morning, got sidetracked. We had some JOLTS news today, and tomorrow we have potential rate cuts when the Fed speaks here in the US. Saying that, the one hour chart is marked with my area of interest. Volume is dying down, so for me, I am just watching. Watching to see if we reject or push up a bit more. Patience is key. Big G gets a shout out. Wishing everyone a great day. Tomorrow is the day i will be looking for a potential trade if I can time it. Let's see how things play out. Be well and trade the trend.

GOLD SELL NOW!!!!!!Gold just hit my poi with a rejections am going shorts from this zone holding till price make a big drop to the sell side.....

Premium Rejects. Discount Reacts. GOLD Obeys.TVC:GOLD continues to respect the same liquidity structure I mapped in last week’s analysis.
The 4,240 to 4,250 premium zone rejected perfectly again, triggering a clean redistribution and sending price back toward discount arrays.
My OG Indicators reacted flawlessly:
* 🔻 Sold off directly from the premium Trend Zone
* ⚡ FlowMaster showed exhaustion at the HH sweep
* 🎯 ScalpMaster printed early reversal signals
* 📉 TrendMaster acted as dynamic 1H resistance
The roadmap played out almost point to point.
⏳ 1H Short Term View
Structure still leans bearish while price stays under the premium band.
* 🐼 Bears remain in control below 4,210
* 🎯 Short targets: 4,196 → 4,188 → 4,175
* ❌ Invalidation: reclaim of 4,225 to 4,230
Discount arrays near 4,180 are attracting buyers, but we still need clean confirmation for a stronger bounce.
📆 1D Mid Term View
Macro structure stays bullish as long as the 4,100 to 4,020 demand zone holds.
This zone continues to absorb sell-side liquidity and maintain the upward structure.
* 🟢 Bulls remain in control above 4,100
* 🎯 Mid term targets: 4,265 → 4,300 → 4,335
* ⚠️ Breakdown zone: 4,100 → 4,020
Momentum cooled off, but the higher timeframe trend is still intact.
📌 Summary
Short term weakness continues, mid term support remains solid.
Premium zones keep giving clean sells, discount zones keep giving clean reactions, exactly how the OG Zones and Indicators mapped it.
The market is rotating smoothly inside the levels and offering controlled, high probability setups.

Golden Reversal from FVG Zone [XAU/USD]OANDA:XAUUSD Golden Reversal from FVG Zone
Signal: BUY
Entry: 4189.00
TP1: 4203.70
TP2: 4218.10
TP3: 4229.00
SL: 4178.00
Insights:
Price retraced into the 0.618–0.705 Fibonacci zone, overlapping with a Fair Value Gap and high VRVP node—strong confluence for reversal.
RSI is recovering from oversold (44.90), MACD histogram shows bullish divergence with signal line crossing up.
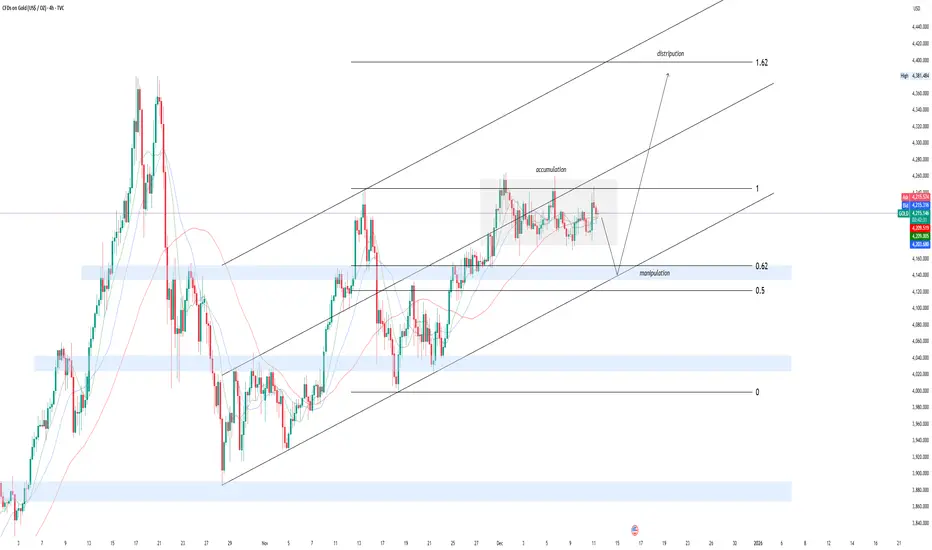
Market structure shows BOS to the upside, suggesting a shift from distribution to accumulation.
#FVGReversal #GoldScalp #HunterSetup#LiquiditySweep #SmartMoneyEntry #BreakoutMomentum
🌟 Trade Like Hunter
✅ High-Probability Setup: Confluence across VRVP (high volume node), MA support, RSI bounce, and MACD crossover.📊 Risk-Reward Ratio: Approx. 1:2.5 to TP3🔑 Liquidity Zone Confirmation: Entry aligns with imbalance zone and prior demand sweep🧠 Market Psychology: Traders likely shifting sentiment toward bullish continuation post-structure break⚡ Probability Score: 80% High Probability📈 Scalability: Setup aligns with H1 and H4 structure—ideal for intraday and swing scalpers🔒 Risk Disclaimer: Always use proper lot sizing and SL discipline. Market conditions can change rapidly.

Multi-indicator Resonance Bullish ViewGold Technical Strategy: Bullish Structure Intact, High-Cost-Effective Long Opportunities Available
On the daily chart, gold trades within an ascending channel with short-term moving averages in a bullish alignment. The 20-day moving average converges with the ascending trend line to form resonant support, reinforcing the upward bias.
The 4-hour chart reveals a triangular consolidation pattern around the $4,200 level — a classic continuation signal of an uptrend, indicating accumulation of bullish momentum before the next move.
Clear Key Levels
Resistance Zones:
Short-term resistance: $4,230–$4,240 (upper edge of the triangle + previous high-volume trading zone).
Support Zones:
Immediate support: $4,180 (lower edge of the triangle + 5-day moving average).
Strong support: $4,170 (previous stabilization level, with solid buying interest).
Indicator Signals Confirm Bullish Bias
MACD: Remains above the zero line; although momentum has slightly contracted, there are no signs of a trend reversal, indicating sustained bullish dominance.
RSI: Trades in the neutral range, suggesting limited room for pullback and balanced market sentiment.
Current price levels offer favorable risk-reward for long positions, with clear support levels to limit downside and a consolidation pattern signaling potential upside momentum.
Gold trading strategy
buy:4190-4200
tp:4210-4220-4240
sl:4180
XAUUSD: Bulls Profited Friday — Sell the Rebound TodayLast week, gold moved largely within a choppy range. Early in the week, price surged to 4264 but failed to break higher and pulled back. Mid-week, gold traded in a narrow band around 4220, and on Friday it spiked to 4259 before rapidly reversing downward, closing at 4196—losing the key 4200 level directly.
The supportive factors for gold remain intact: the market is pricing in nearly a 90% chance of a Fed rate cut in December, and easing expectations tend to suppress real interest rates. In addition, geopolitical risks in the Middle East and the Russia-Ukraine conflict, along with strong global central-bank gold purchases, continue to provide support. However, stronger-than-expected U.S. non-farm payrolls pushed the dollar higher, weighing on gold. Friday’s spike-and-fade also showed profit-taking from the bulls, suggesting short-term downside tests of support may continue.
Before Thursday’s data release, gold may continue its choppy consolidation. Upside momentum will only be renewed if price breaks above 4260; a successful breakout could open the path toward 4300 and potentially 4350. Early in the week, price is likely to remain within a range. Key levels:
Near-term strength/weakness zone: around 4210
Minor resistance: 4225–4230
Higher resistance: 4245 and 4265
Supports: 4190, 4175, and 4160
At the moment, gold continues to dip and bounce repeatedly. Bullish momentum is still insufficient for a breakout, and without major catalysts, price is likely to remain range-bound. The market is waiting for Wednesday’s Fed rate decision, which will guide the next directional move. In the first half of the week, expect continued sideways action—ideal for short-term “sell high, buy low” trading. Trend trading favors selling rallies for now, with both high-sell and low-buy opportunities available.
Last Friday’s long setup based on the PCE data played out perfectly, and the post-pullback short-term long position also delivered profits.
Today’s trading plan:
Go long if price stabilizes above 4215; watch resistance at 4230. If it fails to break, consider selling.
Watch support near 4190; if it holds, look for buying opportunities.

XAUUSD SHORT Hello
My prediction of Spot Gold
Midterm is short to 3880 us dollar
Long term is long up 4500 us dollar
Today is possible key price 4150 us dollar

GOLD 4-HOUR ANALYSISThe breakout at 4,312 shows a reversal is expected. Traders should take profits at significant volume cluster areas 4212 and 4054.

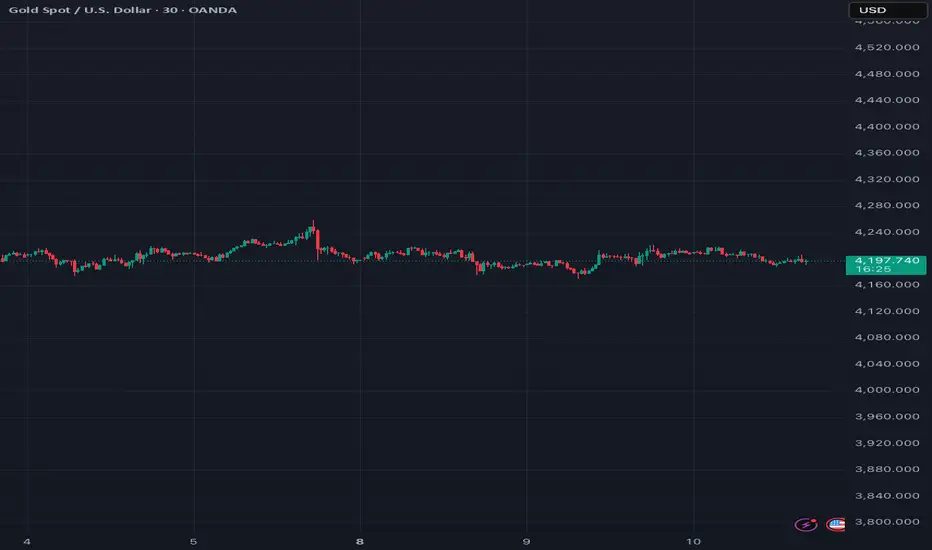
XAU / USD 30 Minute ChartHello traders. I have marked my area(s) that I am watching. We can see the lone red candle in the line of green candles moving up, and that is the area to watch. Pre NY volume start coming in 15 minutes from this post ( 7:20am est). I am thinking gold will push down to take out any leveraged Long positions and correct the overnight sessions move up. Let's see how it plays out. Big G gets my thanks. Happy Friday, be well and trade the trend.

XAUUSD | Gold Signal |Dec 11,2025Trend Analysis: The price of XAUUSD is currently facing a downtrend, with a clear bearish structure visible on the chart. The trend is supported by the price moving below several key EMAs (34, 89, and 200), which signal a potential continuation of the downtrend. The 200 EMA appears to be the strongest resistance.
Price Action & Volume Profile:
The price is testing the lower range, particularly around 4,198.685, a significant support zone. The market structure suggests that the price may bounce upward, especially if it manages to hold above this support level.
The volume profile shows a higher concentration of activity at around the 4,211.906 level, which is likely to act as a strong resistance. If the price approaches this zone, watch for a possible reversal or continuation, depending on how volume behaves there.
Key Levels:
Support: The critical support area lies around 4,198.685, as indicated by the horizontal blue line. If this level holds, there could be a potential reversal.
Resistance: The price is currently facing resistance around 4,214.210. The volume profile suggests that this area could present a barrier for upward movement.
Indicators:
The EMAs (34, 89, 200) are all aligned in a bearish manner, with the price being below the EMAs. This suggests that the bearish trend is likely to continue, but any reversal will depend on how the price interacts with these key levels.
The market seems to be forming a triangular consolidation pattern, indicating potential indecision. A breakout from this pattern will be key to determining the next major move.
Overall Sentiment: Bearish bias is prevailing, but the price is at a crucial support zone. A breakout above the resistance at 4,211.906 may lead to a short-term bullish retracement. Watch for price action at the support and resistance levels to gain more insight into the next move.

XAU-USDFor today, if USD/INR can break its resistance at 4231, it could be attractive for a buy. Keep an eye on the chart and watch it closely.

Report 10/12/25Report summary
Markets are trading a “policy-and-geopolitics” crosscurrent. On the policy side, the Fed is set up for a quarter-point cut to 3.50%–3.75% amid unusually public internal dissent, with Chair Powell aiming to minimize dissents via a “cut-and-cap” signal that raises the bar for further easing. Futures and press reporting frame this as the base case into Wednesday. Meanwhile, Kevin Hassett, now a leading candidate to replace Powell—said there is “plenty of room” to cut and that he wouldn’t bow to political pressure if he becomes Fed chair, comments that lubricate the market’s easing narrative even as they raise governance optics questions.
On the geopolitics side, the EU agreed to permanently ban Russian gas by 2027 (LNG phased out by end-2026; pipelines by Sept. 30, 2027), a structurally bullish pivot for non-Russian gas and European energy security. At the same time, Ukraine widened its strikes from refineries to Russia-linked tankers and a Black Sea export terminal that handles >1% of global flows, incrementally lifting shipping risk premia in the basin.
A third swing factor is tech policy: the White House move to let Nvidia ship high-end AI chips to China (paired with a U.S. “take” on sales) supports capex and earnings for U.S. semis but loosens a key export control, potentially accelerating Chinese AI progress and adding a strategic wrinkle for long-duration tech valuations.
Immediate market reaction and setup
Dollar gauges remain soft into the meeting: the ICE U.S. Dollar Index (DXY) March contract traded 98.85 and the front December at 99.20 on Tuesday’s close, while CME euro futures settled near $1.1632, both consistent with markets leaning dovish. Equity index futures were marginally lower on the day but near cycle highs; the S&P 500 mini closed 6,865 and the Nasdaq-100 mini 25,700 area. Barron’s notes the S&P ended last week up 0.3% with implied odds of a cut around the high-80s.
Front-end money market references also reflect an easier stance already in the price: effective fed funds around 3.89% with T-bill auctions stepping down, and the prime rate steady at 7%.
Strategic forecast (3–6 months)
The modal path is a one-and-pause profile that keeps financial conditions easy without promising a sequence of cuts. Powell’s communication objective is to bank insurance now while stressing data-dependence later, which historically tempers the dollar and supports risk until the growth or inflation data force a repricing. Internal opposition (as many as five voters leaning against a cut) limits how far the market can front-run a full easing cycle; that constraint reduces the risk of a sharp “over-easing” rally and instead argues for a grind higher in U.S. stocks and a controlled drift lower in the dollar.
In Europe, the 2027 gas ban codifies the post-’22 energy pivot; it implies higher medium-term EU investment in LNG regasification, storage and renewables, with a modest structural uplift to European industrial input costs versus pre-war norms. If Kyiv’s tanker/terminal strikes persist, Black Sea freight and insurance premia should stay elevated, nudging seaborne crude differentials and introducing episodic upside tails for Brent.
In tech, the Nvidia-to-China opening mechanically boosts near-term revenue visibility for U.S. semis and data-center supply chains but narrows the “policy risk discount” investors had assigned to China-exposed AI demand—supportive for multiples now, with longer-run strategic competition risk relocated to Washington/Beijing policy channels rather than corporate execution.
Fiscal and political implications
A Fed cut lowers the Treasury’s interest burden at the margin, but the larger story is governance optics: Hassett’s comments reinforce the Administration’s desire for lower rates while asserting central-bank independence—messaging designed to calm markets even as it underscores that personnel choices (chair succession in May) could re-tilt the reaction function. Expect Congress and oversight committees to probe any perception of political influence, especially if inflation stalls above 2%.
In the EU, the gas ban and the revised Ukraine financing plan (≈€90bn lent against frozen Russian assets over two years with guarantees) mean the Commission is taking on larger coordination and credit-risk roles. That supports defense/energy capex and preserves leverage over Moscow in parallel U.S.-Russia-Ukraine talks, but it also embeds fiscal trade-offs for member states if growth underperforms.
Risks
The near-term macro risk is a policy error on either side: cutting into sticky inflation (Dollar rebound + long rates up + equities de-rate), or signaling too hawkishly and tightening financial conditions into softening labor data. Internally divided FOMCs can amplify market volatility around each data print. Geopolitically, a prolonged Ukrainian campaign against the shadow fleet raises the probability of an insurance/liquidity shock in specific sea lanes, a risk that can leap into headline crude curves. Policy toward China’s AI ecosystem could also re-politicize tech valuations if Congress or security agencies push back.
Opportunities
For multi-asset portfolios, a “soft cut” backdrop with a weak dollar and contained energy shocks tends to favor quality U.S. equities with AI leverage, EU energy transition beneficiaries, and selectively EM FX/credit with low external funding needs. European utilities/midstream with credible capex plans into the 2027 ban, and U.S. data-center/logistics names geared to AI capex, screen well if the Fed successfully caps easing expectations rather than launching a cycle.
Asset-by-asset take
XAUUSD (Gold). A weaker DXY into a one-and-pause cut plus steady real-rate compression is supportive. With the DXY December at ~99.2 and euro futures >$1.16, gold’s upside skew remains intact provided inflation doesn’t re-accelerate post-cut. Black Sea risk adds a mild safe-haven bid. Base case: constructive with dips bought.
S&P 500. Earnings visibility improves if the cut reduces discount-rate pressure while AI capex remains robust; Barron’s shows the index near highs with a modest weekly advance. Watch for “buy the cut, fade the path” behavior if Powell pushes back on serial cuts. Quality growth and AI infrastructure remain the leadership.
Dow Jones. Cyclical tilt benefits from easier financial conditions and capex tailwinds tied to energy infrastructure and AI supply chains. Less sensitive to export-control volatility than Nasdaq; vulnerable if Fed leans hawkish and long rates back up.
USDJPY. Direction hinges on the front-end spread. A clean cut with softer guidance should pressure the dollar broadly; however, if the statement leans restrictive for subsequent meetings, the dollar could bounce. Base case: drift lower in USDJPY alongside DXY unless U.S. data re-firm. (Data backdrop: DXY sub-100; euro >$1.16.)
DXY. The path of least resistance is lower into and right after a single cut, especially with several voters already on record as uneasy—language that typically reduces the odds of a rapid easing cycle and flattens rate-vol turns. A hawkish tweak in the statement would cap downside but likely not reverse the trend unless inflation re-accelerates.
Crude oil. Kyiv’s campaign against tankers/terminals and the EU’s gas ban add modest, recurring upside tails to seaborne risk premia. Expect choppy upside in Brent/WTI led by insurance and routing costs in the Black Sea and by longer-dated demand from EU re-gas and storage projects, tempered by global growth concerns.
XAUUSDDO YOU KNOW WHATS BEHIND THIS OR OTHER IDEAS?? in bio..
Preferably suitable for scalping and accurate as long as you watch carefully the price action with the drawn areas.
With your likes and comments, you give me enough energy to provide the best analysis on an ongoing basis.
And if you needed any analysis that was not on the page, you can ask me with a comment or a personal message.
Enjoy Trading ;)
