TIME TO BUY GOLD ... nowXAUUSD (GOLD) was recently in a short term downtrend for a few weeks but has now shown some clear bullish movements ahead. XAUUSD (Gold) has broken out of a downward trend channel that was acting as strong resistance, The price is very likely to head to the next strong resistance level which is marked as the take profit zone (green line). Time to buy gold now.
Trade ideas

Gold: Watch 4228 as the Short-Term Pivot, Focus on Buying DipsUnder the influence of the FOMC’s 25bp rate cut yesterday, gold surged toward the 4248 area with significant volatility. Now that the rate-cut decision has been finalized, the conditions for trading purely on that expectation have passed; however, its subsequent impact will continue to create opportunities in the market. The series of economic releases before the holidays still deserve close attention. At the same time, developments in the Russia–Ukraine situation should be monitored. If peace negotiations progress smoothly and tensions ease, safe-haven demand for gold will weaken, putting short-term pressure on the bullish side.
Technically, fueled by news, the price broke through resistance near 4228 and tested the 4245-4250 area, but encountered significant selling pressure, returning to the 4207-4200 area. This trend is relatively healthy, but it also indicates that the market remains cautious.
Continue to focus on the 4223-28 area. If it can stabilize at this level, it means that the selling pressure has been largely released. With increased capital participation, there may be an opportunity to test the 4300 area before the holiday. If it cannot stabilize, and the Russia-Ukraine peace talks proceed smoothly, the bears may push the price down to around 4100 or even 4050.
Additionally, there is some data to watch in 7 hours.

XAUUSD Trendline Break & Bearish Retest SetupXAUUSD broke the trendline and is now retesting it with a strong rejection from the supply zone, indicating a potential drop toward the lower demand zone (4185–4195)

XAU/USD (Gold) – Market Structure & Liquidity OutlookGold is currently trading in a well-defined consolidation range within my marked blue zone, showing signs of balance after the impulsive move into this area. Price action over the recent sessions indicates compression, with multiple equal highs and lows forming — a classic sign that liquidity is building.
Key Levels
• Current Price Area: ~4,228
• Range High / Liquidity Pool: 4,255 – 4,265
• Range Low / Support: 4,195 – 4,205
• Higher Timeframe Demand (H4 Zone): 4,155 – 4,165
• Invalidation / Stop Loss: Below 4,175
Trade Bias
My bias remains bullish as long as price holds above the H4 demand zone.
The market has respected the blue range multiple times without a clean breakdown, suggesting stronger hands are accumulating positioning below resistance. I’m expecting price to first sweep the resting buy-side liquidity resting above the recent highs around 4,255–4,265, followed by a decisive break and acceptance above the blue zone.
A strong close above 4,265 would confirm a breakout from consolidation and open the door for continuation toward higher highs.
Execution Plan
• Entry Zone: Within the blue consolidation range on confirmation
• Target 1 (Liquidity Sweep): 4,260
• Target 2 (Continuation): New highs above 4,270
• Stop Loss: Below 4,175 (protecting against a deeper H4 demand sweep)
Risk Thesis
A sustained break and close below 4,175 would invalidate the bullish structure and suggest a deeper retracement into the H4 demand zone near 4,160.

XAU / USD 1 Hour ChartHello traders. I did not take the trade,but I just wanted to post that my analysis was spot on for the scalp trade. That is about all I got. Not gloating, just thankful to BIg G. Be well and trade the trend.

XAUUSD Delivered Excellent [ 610 PIPS] PROFITsAs I discussed throughout my TODAY'S Commentary
What was my stance & Postions:
I took buy in my early trade from at London session also shared my Setup and target was 4215 which XAUUSD delivered
Second hiting my first Target i have waited for Gold to deliver decent pullback and respect the previous BOS at $4200 - $4195 Belt I found such on $4194-4195 bos test. I have engaged big Lot set of Buying orders again along (#4185 Stop loss ) and closed my orders on $4220 .
I want to take this moment to congratulate the traders who followed my calls and patiently held their orders. Great job — enjoy the profits and have a great weekend.
Massive win of Day

XAU / USD 1 Hour ChartHello traders. My bad for not posting this morning, got sidetracked. We had some JOLTS news today, and tomorrow we have potential rate cuts when the Fed speaks here in the US. Saying that, the one hour chart is marked with my area of interest. Volume is dying down, so for me, I am just watching. Watching to see if we reject or push up a bit more. Patience is key. Big G gets a shout out. Wishing everyone a great day. Tomorrow is the day i will be looking for a potential trade if I can time it. Let's see how things play out. Be well and trade the trend.

GOLD SELL NOW!!!!!!Gold just hit my poi with a rejections am going shorts from this zone holding till price make a big drop to the sell side.....

Golden Reversal from FVG Zone [XAU/USD]OANDA:XAUUSD Golden Reversal from FVG Zone
Signal: BUY
Entry: 4189.00
TP1: 4203.70
TP2: 4218.10
TP3: 4229.00
SL: 4178.00
Insights:
Price retraced into the 0.618–0.705 Fibonacci zone, overlapping with a Fair Value Gap and high VRVP node—strong confluence for reversal.
RSI is recovering from oversold (44.90), MACD histogram shows bullish divergence with signal line crossing up.
Market structure shows BOS to the upside, suggesting a shift from distribution to accumulation.
#FVGReversal #GoldScalp #HunterSetup#LiquiditySweep #SmartMoneyEntry #BreakoutMomentum
🌟 Trade Like Hunter
✅ High-Probability Setup: Confluence across VRVP (high volume node), MA support, RSI bounce, and MACD crossover.📊 Risk-Reward Ratio: Approx. 1:2.5 to TP3🔑 Liquidity Zone Confirmation: Entry aligns with imbalance zone and prior demand sweep🧠 Market Psychology: Traders likely shifting sentiment toward bullish continuation post-structure break⚡ Probability Score: 80% High Probability📈 Scalability: Setup aligns with H1 and H4 structure—ideal for intraday and swing scalpers🔒 Risk Disclaimer: Always use proper lot sizing and SL discipline. Market conditions can change rapidly.

Report 8/12/25Report summary:
The starting point for this week is the divergence between mood and activity. U.S. consumer sentiment has slumped back toward post-pandemic lows on prices, jobs anxiety, and tariff noise, even as spending holds up into the holidays. The University of Michigan index hovered a little above 53 in early December, far below the 70+ reading that opened the year, highlighting a fragile confidence backdrop even as retailers point to a “solid” season. Equities nonetheless ended last week higher (Dow +0.5%, Nasdaq +0.9%), the 10-year Treasury yield sits near 4.14%, WTI crude rebounded to ~$60, and the euro and yen printed ~$1.1645 and ¥155.37 respectively. That mix, weak sentiment, resilient demand, easier oil, and lower long rates, continues to anchor a “softish landing” narrative, but it’s thin ice: consumers are still looking backward at higher price levels and forward at potential job softness.
The policy tape is unusually consequential for markets this week. First, the Supreme Court will hear a case that could sharply expand the president’s power to dismiss members of independent agencies (e.g., FTC, NRC, CPSC). If the Court embraces robust unitary-executive control, rulemaking could become faster, more pro-cyclical, and more reversable across administrations, altering the risk premia investors assign to regulated industries (tech platforms, healthcare, energy, financials). The immediate equity read-through is mixed: reduced enforcement overhangs can lift mega-cap tech multiples, while the prospect of swifter, less predictable rule swings can raise the policy-volatility discount for rate-sensitive defensives and utilities. Fixed income should read such a ruling as modestly risk-on (tighter credit spreads) but with a fatter “policy tail-risk” skew embedded in option-implied vol around major agency actions.
Second, industrial policy is re-accelerating through U.S.–Japan channels. SoftBank’s Masayoshi Son is working with the administration on “Trump Industrial Parks” on federal land to manufacture AI-infrastructure components, fiber, data-center gear, and eventually AI chips, leveraging billions in Japanese trade-deal funding, with facilities ultimately federally owned. If even a fraction of this blueprint executes, it points to a multi-year capex wave in chips, advanced packaging, power, and logistics, in turn raising structural demand for electricity, specialized real estate, and high-end manufacturing labor. It also strengthens the case that the next U.S. investment cycle remains AI-led even if consumer momentum ebbs. For markets, that mix supports AI supply chains (semis, equipment, power gear, data-center REITs) and favors “quality growth” balance sheets over highly levered cyclicals.
Third, the domestic cost-of-living politics are hardening. The White House has shifted communications to price relief, set up a task force to probe potential food-industry anticompetitive behavior, and is weighing how to handle ACA premium subsidies that lapse absent a deal, now entangled with abortion-coverage language demanded by anti-abortion groups. If subsidies expire, premiums for ~20 million enrollees would jump, risking a first-quarter hit to discretionary spending. If extended with tighter abortion language, expect litigation risk and state-level friction. The “base case” still leans to some stop-gap extension to avoid an insurance-price shock ahead of midterms, but the path is messy and could widen dispersion between staples and discretionary equities in Q1.
Internationally, two threads matter for macro beta. First, China’s growth is increasingly “beggar-thy-neighbor” as exports surge while imports flatline; research summarized this week argues that faster Chinese growth now subtracts a bit from the rest of the world by displacing manufacturing elsewhere. That dynamic helps suppress traded-goods inflation but pressures industrial PMIs in Europe and East Asia, and it intensifies the tariff/quotas spiral (notably in autos and green tech). Second, Russia’s AI ecosystem continues to lag badly due to sanctions and component scarcity, another sign that frontier compute leadership, and the returns that come with it, remain clustered in the U.S., parts of Europe, and the Gulf/Asia capital nexus. Both threads reinforce the medium-term bull case for non-Chinese AI infrastructure and for targeted Western industrial policy, supportive for risk assets tied to compute, power, and logistics, less so for globally exposed old-economy manufacturing.
The security tape adds a modest safe-haven premium rather than a full risk-off impulse. Pentagon controversy around a lethal follow-up strike in the Caribbean, renewed Thai-Cambodian border clashes, and Chinese aircraft locking radar on Japanese jets near Okinawa raise headline risk without, so far, impairing shipping or energy flows. Markets will price these as optionable tail risks: a small positive carry for gold and the dollar on geopolitics, but still secondary to rates and growth.
Asset-by-asset implications
XAUUSD (Gold). With the 10-year near ~4.14% and inflation expectations easing, real yields remain the primary headwind. Countervailing supports are (i) softer oil near $60 easing stagflation fears, which paradoxically narrows the “Fed put” and keeps cuts cautious, and (ii) legal and foreign-policy noise. Net-net, gold holds a bid as a geopolitical hedge, but without a decisive real-rate leg lower, rallies should be faded into strength. Tactical range bias: buy dips toward prior supports on policy headlines; fade spikes absent a clear catalyst such as a dovish shift in rate-path pricing.
S&P 500 / Dow Jones. AI capex visibility (industrial parks, M&A interest such as IBM–Confluent talks), firmer ad-spend forecasts, and stable oil support margins and 2026 EPS trajectories for quality growth and communication services. The Supreme Court case could reduce medium-term antitrust/regulatory overhangs for mega-caps but adds policy-regime volatility to regulated verticals. With the Dow up 0.5% last week and oil contained, dips on consumer-sentiment headlines should find buyers in compute, power gear, software-infrastructure, and logistics automation; be selective in rate-sensitive defensives that face policy recalibration risk.
USDJPY. The pair around ~155 reflects the still-wide U.S.–Japan rate differential. Washington’s industrial buildout and steady U.S. demand argue for a firm dollar into year-end, but any meaningful downtick in U.S. yields or increased MoF rhetoric could trigger sharp yen short-covering. Maintain respect for intervention risk above the mid-150s; downside USDJPY shocks likely come from softer U.S. data or a global risk-off that lifts haven JPY.
DXY (U.S. Dollar Index). With the euro near $1.1645 and oil subdued, the dollar’s broad tone is stable-firm on relative U.S. growth and AI-led capex. A subsidy lapse that crimps Q1 consumption would be dollar-mixed (growth negative, but “risk-off” supportive). Watch CPI/PPI and any subsidy headline this week for a push-pull between cyclical softness and safe-haven bids.
Crude Oil. WTI around ~$60 suggests markets are leaning into adequate supply and cyclically “ok but not hot” demand. U.S. industrial policy does raise medium-term energy demand via data-center electricity needs, but that is a slope, not a step-function in 2026. Near-term, oil trades the growth tape and any supply disruption; absent a shipping or Mideast shock, range-bound with a slight downside skew if consumer data worsens.
Strategic forecast
Baseline into Q1–Q2 2026 is a slow-growth, disinflationary glide with episodic policy shocks. The consumer keeps spending but rotates down the price curve; corporate America keeps investing in compute and automation; oil stays manageable; rates drift lower but remain restrictive in real terms. Supreme Court action that expands presidential control of agencies tilts outcomes toward faster policy swings; that argues for higher relative valuations for firms with low regulatory sensitivity and robust pricing power, and for maintaining optionality (calls on quality growth; puts on policy-exposed defensives).
Fiscal & political implications
Failure to extend ACA subsidies would mechanically raise 2026 insurance premiums, with the heaviest drag in lower-income cohorts; any extension with new abortion-coverage limits would ignite fresh legal disputes and headline risk. The White House’s price-messaging shift and food-sector probe show the political centrality of grocery inflation. Meanwhile, the U.S.–Japan industrial-parks initiative, if funded and permitted, would channel foreign public capital into U.S. federal-land manufacturing, an unusual ownership structure that could accelerate timelines but draw scrutiny over returns, labor standards, and siting.
Risks
Key risks include a policy-regime break from the Court, subsidy lapse hitting Q1 consumption, trade-war ricochets as partners react to U.S. tariffs, and geopolitical miscalculation in East Asia or the Caribbean that shifts risk premia. On the upside, any durable fall in real yields or a broader détente on tariffs would expand equity multiples and steepen the global capex curve.
Actionable takeaways
Hold a barbell: quality AI-infrastructure beneficiaries and power grid names on one side, cash-flow compounders with low regulatory sensitivity on the other. Stay tactically long the dollar and short duration versus JPY until U.S. data convincingly slows. Keep a small gold hedge for tail risks given the legal-policy and East Asia headlines. For crude, favor selling rallies into the low-to-mid-$60s unless supply risk materializes.


GOLD SHORT FROM RESISTANCE
GOLD SIGNAL
Trade Direction: short
Entry Level: 4,337.65
Target Level: 4,266.90
Stop Loss: 4,384.71
RISK PROFILE
Risk level: medium
Suggested risk: 1%
Timeframe: 1h
Disclosure: I am part of Trade Nation's Influencer program and receive a monthly fee for using their TradingView charts in my analysis.
✅LIKE AND COMMENT MY IDEAS✅

Gold: Beware of a Double Top — Sell High, Buy LowLast Friday, gold surged sharply before experiencing a strong pullback, briefly breaking below 4280 and reaching a low near 4257. However, the candle bodies all closed above 4280, indicating that this level remains a solid support. (If a clearer lower wick had formed around 4280, it would have signaled even stronger buying interest.)
At today’s open, gold moved higher amid choppy price action, once again returning to the 4350 area, largely in line with expectations.
Selling pressure remains evident around the 4350 level, which is clearly reflected in recent 30-minute chart closes. The key focus now is whether price can break through this area decisively. If gold continues to face resistance here, or if any breakout proves weak, a pullback is likely.
From a technical perspective, attention should be paid to the potential formation of a double-top pattern. Key support levels are located at 4328–4321 and 4308–4296, while resistance is seen at 4350–4358, followed by 4373 and higher levels above.

GOLD: Bearish Continuation & Short Trade
GOLD
- Classic bearish pattern
- Our team expects retracement
SUGGESTED TRADE:
Swing Trade
Sell GOLD
Entry - 4347.9
Stop - 4363.6
Take - 4318.5
Our Risk - 1%
Start protection of your profits from lower levels
Disclosure: I am part of Trade Nation's Influencer program and receive a monthly fee for using their TradingView charts in my analysis.
❤️ Please, support our work with like & comment! ❤️

XAUUSD H1 Analysis Based on Volume ProfileXAUUSD H1 Analysis Based on Volume Profile
Gold is moving sideways and consolidating around the 4,300 USD/oz area. The short-term direction remains unconfirmed and requires clear reactions at key liquidity zones.
PRIORITY SCENARIO – MAIN SCENARIO
Medium-term trend-following buy strategy at price areas with Volume Profile advantage
Primary buy zone: around 4284 based on VAL
Technical context: this is the lower value area where buying interest is likely to appear as the market continues to consolidate
Price expectation: price holds above VAL, absorbs short-term selling pressure, and gradually rotates back toward the upper balance area
Position management:
If price reacts positively and H1 candles hold above the 4284 level, a medium-term bullish bias in line with the main trend can be maintained.
If price breaks clearly below VAL, caution is required and deeper reaction zones should be monitored.
ALTERNATIVE SCENARIO – SECONDARY SCENARIO
Deeper buy opportunity in the event of additional liquidity sweep
Alternative buy zone: around 4242, based on the VAH of the previous value area
Technical context: this area represents the upper value zone of the prior consolidation and may act as strong support during a deeper pullback
Price expectation: downside liquidity sweep followed by a recovery, restoring market balance
SELL SCENARIO – HIGH RISK
Sell positions should only be considered as short-term trades, not a primary strategy
Short-term sell zone: around 4378, based on the 2.618 Fibonacci extension
Note: sells should only be considered if clear price rejection signals appear. Avoid holding short positions for extended periods while the broader trend remains bullish.
KEY REASONS
On the H1 timeframe, price is consolidating, indicating the market needs additional liquidity before confirming the next directional move
Volume Profile clearly highlights high-probability trading zones, particularly VAL at 4284 and VAH at 4242
The 4378 level represents an extended resistance zone suitable for profit-taking or short-term countertrend sells
MACRO CONTEXT AND MARKET SENTIMENT
Gold continues to hold strong near the 4,300 USD/oz level, supported by expectations of continued monetary easing from the Federal Reserve and rising safe-haven demand.
Meanwhile, silver has faced short-term profit-taking pressure after reaching record highs, reflecting a more cautious market tone.
This week’s focus is on the US Nonfarm Payrolls report. Weak data may reinforce gold’s bullish trend, while strong data could trigger a short-term correction amid ongoing policy uncertainty within the Fed.
RISK MANAGEMENT AND MONITORING
Avoid trading while price remains in the middle of the consolidation range and away from key Volume Profile levels.
The medium-term buy strategy loses its edge if price breaks clearly below 4242 and fails to reclaim the level.
Closely monitor volatility around the Nonfarm release, as sharp spikes and liquidity sweeps are highly likely.

XAUUSD Aggressive bullish. Gold (XAUUSD) – 30M Chart Summary
Gold showed a strong bullish impulse earlier, creating a weak high, followed by an aggressive sell-off that broke market structure, signaling a shift from bullish to bearish momentum.
After the drop, price found demand at the support zone (~4270–4280) and started consolidating.
The current price is reacting inside a Fair Value Gap (FVG) around 4290–4300, acting as a decision area.
Below the FVG: sellers remain in control, and price may revisit the support zone and possibly sweep liquidity below it.
Above the FVG with acceptance: price could retrace toward the premium area / weak high near 4350, but this would be corrective unless structure is reclaimed.
Overall bias is bearish to neutral, with consolidation likely until a clear break above the FVG or below support confirms the next move.


GOLD Is Bullish! Buy!
Take a look at our analysis for GOLD.
Time Frame: 4h
Current Trend: Bullish
Sentiment: Oversold (based on 7-period RSI)
Forecast: Bullish
The market is approaching a significant support area 4,188.16.
The underlined horizontal cluster clearly indicates a highly probable bullish movement with target 4,233.29 level.
P.S
Overbought describes a period of time where there has been a significant and consistent upward move in price over a period of time without much pullback.
Like and subscribe and comment my ideas if you enjoy them!

XAU / USD 30 Minute ChartHello traders. I have marked my area(s) that I am watching. We can see the lone red candle in the line of green candles moving up, and that is the area to watch. Pre NY volume start coming in 15 minutes from this post ( 7:20am est). I am thinking gold will push down to take out any leveraged Long positions and correct the overnight sessions move up. Let's see how it plays out. Big G gets my thanks. Happy Friday, be well and trade the trend.

XAUUSD | Gold Signal |Dec 11,2025Trend Analysis: The price of XAUUSD is currently facing a downtrend, with a clear bearish structure visible on the chart. The trend is supported by the price moving below several key EMAs (34, 89, and 200), which signal a potential continuation of the downtrend. The 200 EMA appears to be the strongest resistance.
Price Action & Volume Profile:
The price is testing the lower range, particularly around 4,198.685, a significant support zone. The market structure suggests that the price may bounce upward, especially if it manages to hold above this support level.
The volume profile shows a higher concentration of activity at around the 4,211.906 level, which is likely to act as a strong resistance. If the price approaches this zone, watch for a possible reversal or continuation, depending on how volume behaves there.
Key Levels:
Support: The critical support area lies around 4,198.685, as indicated by the horizontal blue line. If this level holds, there could be a potential reversal.
Resistance: The price is currently facing resistance around 4,214.210. The volume profile suggests that this area could present a barrier for upward movement.
Indicators:
The EMAs (34, 89, 200) are all aligned in a bearish manner, with the price being below the EMAs. This suggests that the bearish trend is likely to continue, but any reversal will depend on how the price interacts with these key levels.
The market seems to be forming a triangular consolidation pattern, indicating potential indecision. A breakout from this pattern will be key to determining the next major move.
Overall Sentiment: Bearish bias is prevailing, but the price is at a crucial support zone. A breakout above the resistance at 4,211.906 may lead to a short-term bullish retracement. Watch for price action at the support and resistance levels to gain more insight into the next move.

XAU-USDFor today, if USD/INR can break its resistance at 4231, it could be attractive for a buy. Keep an eye on the chart and watch it closely.

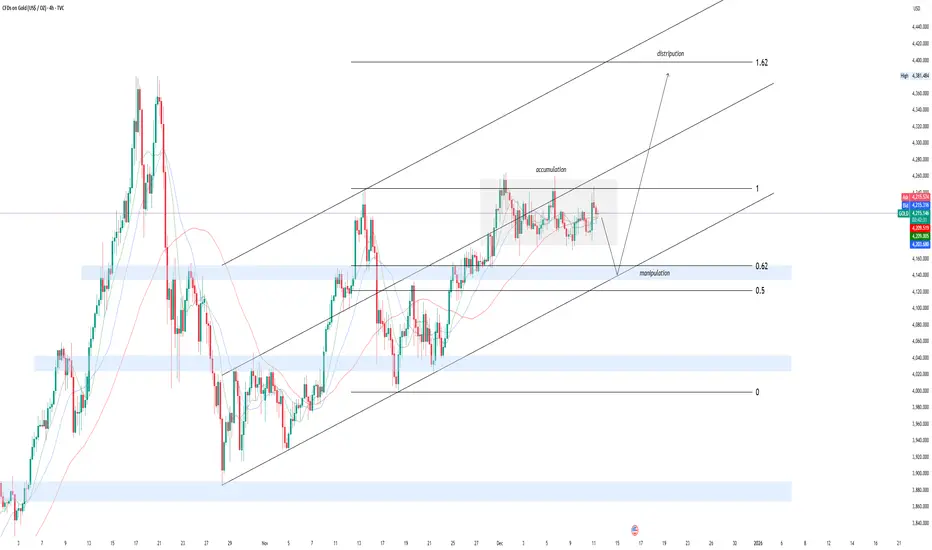
XAUUSD PATHThe possibility that will occur with gold is a temporary surge caused by uncertainty or due to the liquidation of traders who use excessive leverage. We know that after this FOMC meeting, the direction of the US economy will become clear, although there are many other factors such as global tensions between China and Japan, which have recently caused uncertainty, Japan's interest rate hike, the unresolved conflict between Iran and Israel, and the unfinished peace agreement between Ukraine and Russia. However, looking at several catalysts for 2026, I believe gold prices have already been priced in. My analysis may be incorrect if gold manages to break through the $5,000 mark due to increased uncertainty. However, what is currently visible is that 2026-2027 will be a year of weakening and ranging prices for gold. Therefore, take advantage of this for short-term trading with proper money management so that you can beat the bookies.
I hope my analysis is helpful to you.
Please leave your questions and comments.
I will try to respond to them.
Good luck
