XAUUSD: Bullish Push to 4380?As the previous analysis worked exactly as predicted, FX:XAUUSD is eyeing a bullish breakout on the 1-hour chart , with price rebounding from a key support near cumulative buy liquidation, converging with a potential entry zone that could ignite upside momentum if buyers hold against short-term dips. This setup suggests a continuation opportunity amid the recent uptrend, targeting higher resistance levels with excellent risk-reward .🔥
Entry between 4155–4170 for a long position (entry at current levels with proper risk management is recommended. Targets at 4300 (first) , 4380 (second) . Set a stop loss at a close below 4130 , yielding a risk-reward ratio of approximately 1:3 to first target and up to 1:5 overall . Monitor for confirmation via a bullish candle close above entry with rising volume, leveraging gold's momentum near ATH.🌟
Fundamentally , gold is on pace for a fourth consecutive monthly gain in November 2025, rallying toward the $4,400 region amid increased Fed rate cut bets and its safe-haven appeal. As of November 28, prices hover around $4,200 after surging from $4,082 earlier in the week, driven by market expectations of Fed easing and global uncertainties, with forecasts eyeing further upside if resistance at $4200 breaks. 💡
📝 Trade Setup
🎯 Entry (Long):
4155 – 4170
(Entry at current levels also possible with proper risk management.)
🎯 Targets:
• 4300 (first)
• 4380 (second)
❌ Stop Loss:
• Close below 4130
⚖️ Risk-to-Reward:
• ~1:3 to first target
• Up to 1:5 overall
👇 Share your thoughts below! 👇
Trade ideas

XAUUSD – The 4.221 Zone Determines Direction Ahead of Fed ...XAUUSD – The 4.221 Zone Determines Direction Ahead of Fed
From my perspective, gold on 10/12 is in a "waiting to choose direction" phase:
The price is caught between the resistance zone of 4.221–4.239 and strong support at 4.166.
On the 45m chart, the current structure is a sideways top, following the previous upward move.
In the context of the Fed about to announce interest rates, I won't guess but will closely follow these two zones to make decisions.
🎯 Important Technical Zones
Main Resistance:
4.221 – 4.225: Fibo zone 0.236–0.382 and thick volume cluster.
4.239: extended resistance peak – if broken, the target is the 4.25x zone.
Strong Support:
4.166: "Strong support" zone on the chart – current range bottom.
Below 4.166, the 4.12x zone is the extended Fibo 1.618, where liquidity might be attracted if the market sells off deeply.
📌 Scenario 1 – Continued Uptrend (preferred if holding above 4.200)
If the price:
Holds firmly above 4.200,
Clearly breaks the 4.221–4.225 zone and closes a 45m candle above,
I will consider this a confirmation signal that buyers are regaining control.
Trading reference:
Buy when the price breaks & retests 4.221–4.225.
Temporary SL set below 4.210.
TP: 4.245 – 4.258 – 4.270.
As long as gold stands above 4.200, I prioritize the scenario of maintaining a bullish bias, viewing any pullback to 4.20x as a buying opportunity.
📌 Scenario 2 – Short-term Sell within the Range
If the price fails to break 4.221–4.239, leaving a cluster of pin candles with small bodies, I consider this a signal of exhaustion at the resistance zone:
Sell around 4.221–4.225 (up to 4.239 if there's a spike).
SL above 4.239.
TP: 4.190 – 4.176 – 4.166, deeper to 4.130 if selling pressure increases strongly.
This scenario is for short-term scalping/swing, going against the medium-term bullish bias, so volume must be tightly controlled.
1️⃣ Basic Context: Everyone Awaits the Fed
USD/CHF is trading steadily around 0.8060, reflecting the FX market's wait-and-see stance ahead of the Fed's decision.
Investors don't want to bet too heavily in one direction before the news, so gold tends to fluctuate within the range rather than breaking out immediately.
When the Fed announces interest rates and guidance, gold's volatility range can expand very quickly, sweeping through both resistance and support zones.
Therefore, I don't recommend entering large volume orders right before the Fed. The priority is to read price reactions at the 4.221 and 4.166 zones, then decide whether to increase or decrease positions.
2️⃣ My Plan
Above 4.221, holding price well: prioritize buying scenario on break, targeting 4.25x.
Failing to break 4.221, weak candles: consider short selling to 4.19x – 4.166.
If the price falls straight below 4.166, I will temporarily stay out, waiting for the market to create a new balance zone before planning further.
Each trade risks a maximum of 1–2% of the account, no widening SL during strong news phases.
If you find this perspective useful, follow the TradingView channel and leave a comment on whether you lean towards breaking above 4.221 or turning back from resistance – let's update after the Fed news.

Gold 4H: Bearish Scenario
Price is riding a clean rising trendline from the October lows, connecting multiple higher swing lows.
A break and retest of this blue trendline would signal fading momentum and open the door for a deeper correction toward horizontal support.
🧱 Why 3,947 is strong support
3,947 marks the previous consolidation base where buyers stepped in aggressively after the last sharp sell‑off, turning it into a clear demand zone.
It also aligns with the last major 4H swing low, so many stop‑losses and resting buy orders are likely clustered there, making it a natural magnet if the trendline fails.
📉 Bearish divergence
While price made higher highs on the 4H chart, the RSI printed lower highs, creating a clear bearish divergence.
This divergence suggests buyers are losing strength, increasing the probability of a trendline break and a move down into the 3,947 support area before any new major leg higher.

GOLD M15 OUTLOOKGold (XAUUSD) on the M15 timeframe is currently executing a textbook technical maneuver: price is tapping into a key Optimal Trade Entry (OTE) zone. This zone, derived from Fibonacci retracement theory, represents a high-probability reversal area where institutional order flow often clusters. The setup is promising, but the key to transforming this potential into profit lies in one disciplined step: waiting for Lower Time Frame (LTF) confirmation before initiating any buy trade.

Gold Buys only / never SellAs discussed throughout my yesterday's session commentary: 'My position: I have been Buying Gold aggressively from #4,222.80 Support throughout yesterday’s session many times and closing m orders as near as #4,242.80 Resistance. I Bought Gold this morning #4,185.80 aggressively as well with set of Buying orders. I will continue Buying aggressively above #4,208.80 Resistance is invalidated. #4,300.80 and #5,100.80 Medium-term Targets.'
Technical analysis: Practically I have nothing to add to the previous analysis as following the Double Bottom on Hourly 1 chart / Price-action has made a (marginal) new High’s on Hourly 4 chart above #4,227.80 Resistance for the fractal. If #4,227.80 - #4,232.80 gets invalidated on High Volume / on aggressive manner (last #3 attempts have been really anemic) then I can call a test of the #4,242.80 Resistance in extension. With the my instruments on Neutral levels I do not expect Selling sustainability on both Short and Medium-term. #4,230.80 local High’s got hit on my surprise Gold delivered aggressive #4,162.80 take-down which was recovered right away (well used it from #4,167.80 and Bought there), I am expecting the final extension wave of this parabolic run towards #4,300.80 Higher High’s Upper zone Technically. I believe this will be a major Resistance, but will necessarily cause a (# -1.00%) or (# -2.00%) pullback within new Monthly accumulation period. #4,152.80 - #4,162.80 zone is currently posing as an Support on Hourly 1 chart and values I mentioned above Resisting. I should mind our Risk tolerance as like I said this is most likely the final wave of the parabolic run that started recently, small stabilization then #5,100.80 benchmark test ahead.
My position: I am without any orders currently as current Neutral Rectangle belt is too idle to deliver any conclusions however my Profit from both Short and Medium-term orders is already excellent. I will attempt to Buy as Lower as I can from my key entry points.

xauusd buyGold is pulling back after breaking the downtrend line... Expecting an upward move after consolidation

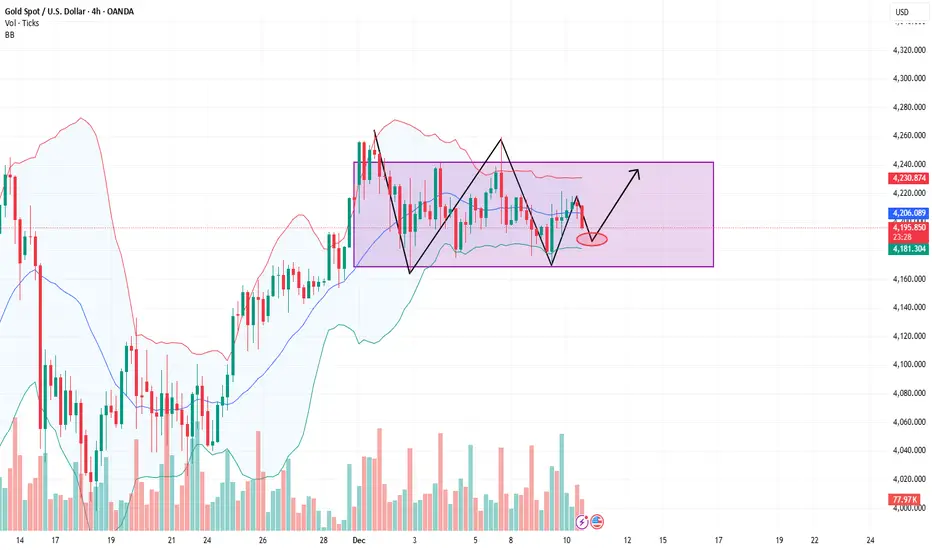
Precise Strategy AnalysisThe daily chart shows the bullish trend remains intact, while the 4-hour chart maintains a range-bound pattern. Currently, the Bollinger Bands are narrowing within the 4170-4230 range, suggesting a potential range-bound trading strategy of buying low and selling high within this area. However, two points need attention: firstly, after Tuesday's rise, the support level may have moved up to around 4200, not necessarily reaching 4180; secondly, a strong break above the upper Bollinger Band at 4230 would open up further upside potential, with a target of 4260 or higher. Therefore, intraday trading should consider placing long orders in the 4190-4180 range, while short positions can be initiated with small positions at the 4230 resistance level. The focus is on the Fed's decision at midnight, with the market widely expecting interest rates to remain unchanged. Attention should be paid to Powell's tone. If his comments are dovish, it could trigger a sharp rise followed by a fall in gold prices; please exercise strict risk management.
Today's gold trading recommendations:
Short positions can be initiated around 4220-4215, with a stop loss at 4230 and a target of 4190.
Long positions can be initiated around 4190-4185, with a stop loss at 4170 and a target of 4210.
XAUUSD: Analysis and Strategy for December 12Gold Technical Analysis:
Daily Resistance: 4382, Support: 4175
4-Hour Resistance: 4382, Support: 4265
1-Hour Resistance: 4343, Support: 4285
Technically, after the European session opened, the price surged upwards, breaking through the 4300 level in the short term. Moving average support has moved upwards, and technical indicators have completed their correction, strengthening confidence in a continued bullish outlook for gold in the medium to long term.
On the daily chart, gold is showing strong performance, exhibiting a continuous upward trend. Moving averages are crossing upwards, support levels are gradually moving higher, and Bollinger Bands are expanding upwards. After this breakout, a new round of upward movement is inevitable. The price is rising. Today's support level to watch is around 4265, the area where the top and bottom have reversed.
On the 1-hour chart, the price is rising in a step-like pattern, breaking through multiple resistance levels in the short term and continuing yesterday's upward trend. The Bollinger Bands are trending upwards, the moving averages are crossing upwards, and the MACD/KDJ indicators suggest that the upward trend will continue. Short-term support is around 4285/4280, and short-term resistance is at the previous historical high. Today is Friday, so be aware of the systemic risks brought by the time window.
Cautious trading strategy:
BUY: 4280near
BUY: 4265near
Selling requires waiting for a bearish pattern to form on the chart.
More analysis →

LONG on XAUUSD (Gold) at 4198.80Entered LONG on XAUUSD (Gold) at 4198.80
Targets: 4220 | 4238 |
Stop Loss: 4185
Leverage: 20x Clean higher-timeframe structure + bullish order block holding perfectly. Expecting continuation to the upside NOT financial advice
DYOR | Trade at your own risk | Protect your capital!#XAUUSD #Gold #GoldTrading #Forex #TradingSignals #PriceAction #DayTrading #SwingTrading #Commodities #Metals #TradingWho’s riding gold with me?

GOLD 4H Chart AnalysisDear Traders – 8 Dec 2025
Please review the updated 4H chart.
Since the start of December 2025, GOLD has been repeatedly testing key levels, with an upside gap near 4262 and a downside gap near 4164. Price is likely to continue testing both sides until one of these levels breaks, confirming the next directional move and range.
On the 4H timeframe, the double bullish symmetrical triangle has broken to the upside, which is a clear bullish signal. However, there is still a possibility of one more retest toward the lower level around 4135 – 4165 zone and potentially to the retracement zone.
If a candle closes and holds below the ifvg zone around at 4135, we could see a deeper retracement toward the 4000 – 4044 area.
IMPORTANT:
This week's news calendar is packed with high impact events. Please be cautious with your trades and positions, as the market are expected to be volatile across the board.
Keep this in mind when looking for buy entries from dips. The updated chart will help you monitor any downward move and catch the potential bullish bounce.
Bullish Targets: 4244, 4278, 4328
Bearish Targets: 4135, 4044

XAUUSD (Gold) – 4H UpdateXAUUSD (Gold) – 4H UpdateCurrent price sitting right on the major horizontal support zone ~4090–4100 (multiple touch + 200EMA dynamic support).Trade Signal Ideas:Bearish Scenario (Preferred if we lose the zone): Trigger: Clean 4H close below 4090 + retest as resistance
Entry zone: 4080–4095 (on retest)
Target 1: 4040
Target 2: 4000–3980 psychological zone
Stop: Above 4130
Potential R:R 1:3+
Bullish Scenario (Breakout): Trigger: Strong 4H close above 4200 resistance zone
Entry: Pullback to 4200–4220 (former resistance → support)
Target: 4300 → 4380 → new ATH 4450+
Stop: Below 4150
Bias right now is slightly bearish while we hold below 4198–4200. A break and hold below 4090 opens the fast road to 4000.#XAUUSD #Gold #GoldSignal #TechnicalAnalysis #TradingView Not financial advice – trade at your own risk. Always use proper risk management.

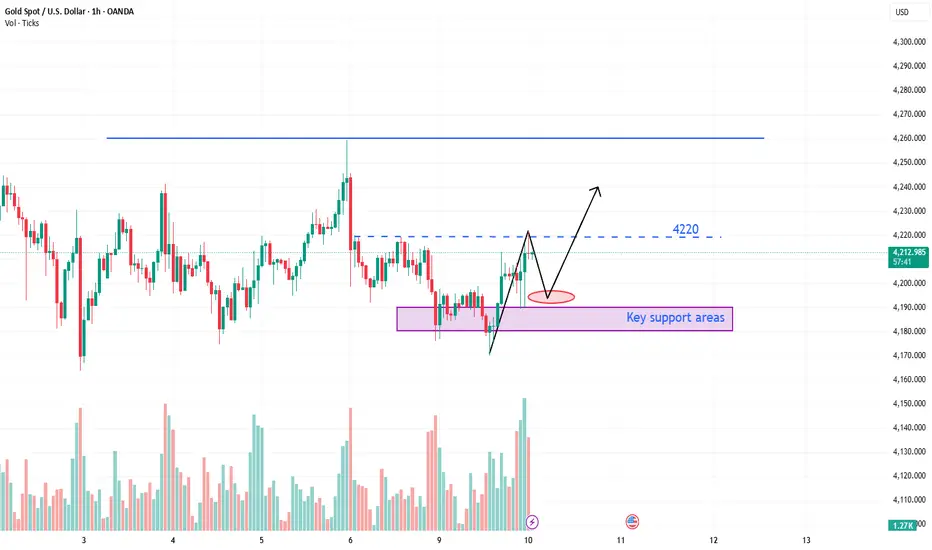
GOLD H1 (XAUUSD) Technical Analysis1️⃣ Market Structure
gold chart shows a Symmetrical Triangle, which usually means price is preparing for a strong breakout.
Since the previous move was bullish, the triangle is likely a bullish continuation pattern.
2️⃣ Important Levels (From Your Chart)
Support Zone
4188
4186
4163
4162 (Major support)
This is the base of the triangle and a strong demand zone.
Resistance Zone
4237
4256
4257
If price breaks 4237, bullish breakout is confirmed.
3️⃣ Expected Move (High Probability Scenario)
✔ Bullish Scenario (Most Likely)
If the price:
Falls slightly to the lower triangle line
Makes a fake breakout (small dip)
Then moves back inside the triangle
Breaks 4237 resistance
➡️ Price can rally toward:
4256 → 4280 → 4400
gold chart’s projection is correct — a strong upside move is possible.
4️⃣ Bearish Invalid Level
If price closes below 4162 on H1,
then bullish setup becomes invalid.
Downside targets in that case:
4137
4100
5️⃣ Best Trading Plan
✅ BUY (Safe Entry)
Entry: Above 4237 breakout
SL: 4210
TP1: 4256
TP2: 4280
TP3: 4400
🔥 BUY (Aggressive Entry)
Entry: Near 4162–4185 support zone
SL: 4145
TP: 4237 → 4256 → 4280
6️⃣ Summary
Triangle shows strong breakout potential.
Bias is bullish as long as 4162 holds.
Break of 4237 = confirmation for upward rally.
Your projected arrows in the chart are accurate and logical.

Intermarket Perspective: Gold – Oil – Dollar IndexThree Markets, One Big Picture
If you want to understand where XAUUSD is now — and where it is likely to move next — you cannot look at gold alone.
In today’s market, Intermarket Analysis is essential to reading real money flow.
The three markets you must watch together are:
Gold – Oil – Dollar Index (DXY).
They interact like three gears in the same machine.
Let’s break down how these markets connect — and how professional traders use them to anticipate gold’s next move.
1. Gold – The Safe-Haven and Market Risk Barometer
Gold reflects expectations about:
Interest rates
Inflation
Geopolitical risk
Safe-haven flows
Important Principle:
Lower rates → weaker USD → lower yields → stronger gold.
Gold is extremely sensitive to the DXY and the U.S. 10-year yield.
But looking at USD alone is not enough — that’s where Oil enters the picture.
2. Oil – The Engine of Global Inflation
Oil is not “just a commodity” — it is the foundation of inflation.
When oil rises sharply:
Transportation costs rise
Production costs increase
Inflation spreads across the economy
This forces central banks to maintain or raise interest rates.
→ Higher rate expectations often pressure gold lower
→ And support the Dollar Index
In short:
Oil ↑ → Inflation ↑ → Fed turns hawkish → USD ↑ → Gold ↓
Not always 1:1, but this is the classic money-flow pattern.
3. Dollar Index (DXY) – The Global Money Compass
DXY measures USD strength against major currencies.
When DXY rises, it usually signals:
Higher interest rate expectations
Risk-off sentiment
Growing demand for USD
This typically:
→ Pressures gold downward
→ Impacts oil prices because oil is USD-denominated
Strong DXY = Weak Gold
Weak DXY = Gold has room to rally
4. How These Three Markets Interact
Scenario 1: DXY Up – Oil Up – Gold Down
→ High inflation, hawkish Fed, strong USD
→ Gold faces pressure due to rising yields
→ Oil may rise from supply issues or geopolitical tension
Scenario 2: DXY Down – Gold Up – Oil Flat or Down
→ Rate-cut expectations rise
→ Gold benefits most
→ Oil may lag due to supply-demand dynamics
Scenario 3: Oil Spikes – Gold & DXY Move Mixed
→ Inflation rises
→ DXY may strengthen
→ Gold can rise due to recession fears
This is usually a volatile phase filled with false signals.
5. As a Gold Trader, What Should You Watch?
(1) DXY
If DXY breaks its bullish structure → gold often prepares for a strong move.
(2) Oil
Rising oil pushes inflation up → gold may fall initially but can surge later if economic risks grow.
(3) Macro Data
Fed policy
OPEC decisions
CPI, PCE
Oil inventory data
U.S. employment numbers
These are the lifeblood connecting all three markets.

XAUUSD NEWEST TODAY 11, DEC 🔹 MARKET BRIEFING – XAU/USD
Market State:
– Price has bounced strongly from the demand zone and is now holding above the support zone, showing clear bullish momentum.
Key Levels:
– Support Zone: 4218
– Target 1: 4236
– Target 2: 4247
– Target 3: 4259
Next Move:
– Bullish bias remains dominant; a retest of the 4218 support zone could trigger the next upward leg toward 4236 → 4247 → 4259.

GOLD IDEA TIME RATE 4H🔹 MARKET BRIEFING – XAU/USD (4H)
Market State:
– Price is compressing inside a symmetrical triangle, respecting both the rising support line and the descending upper boundary, showing balanced but tightening momentum.
Key Levels:
– Triangle Support: ~4185–4195
– Triangle Resistance: ~4250–4260
– Liquidity Zone Below: 4128 – 4135
Next Move:
– A breakout above the triangle resistance could trigger a bullish continuation leg toward higher highs.
– If price rejects at the upper boundary and breaks below the rising trendline, liquidity at 4128–4135 becomes the next downside magnet.

Gold traded within a rangeIn the short term, gold remains range-bound. It's not advisable to chase higher prices before a valid breakout. The recommended strategy is to buy on dips. Consider entering long positions near 4195. If the price breaks through the 4230 resistance level, add to long positions, targeting the 4245-4255 area. This area represents a resistance zone formed by connecting the previous downtrend highs; a break above this level would signal the start of a daily-level rebound in gold.
In the short term, the market will likely continue to trade within a range; the strategy should be to buy on dips.
XAUUSD short term pullbackBased on the MCAD line, i think that price will have a short term pulll back to the marked region

Gold Just Flipped Structure.....The market just transitioned from a bearish sequence into early bullish structure. Most traders will miss this shift but if you understand BOS, ChoCH, and liquidity behaviour, this is where smart money prepares for the next leg up.
1. Market Structure Overview
Your chart shows a full bearish sequence (LH–LL) that has recently transitioned:
-Multiple Lower Highs (LH) and Lower Lows (LL) → clear bearish structure.
-A Change of Character (ChoCH) occurs at the key zone → first signal of reversal.
-A clean Break of Structure (BOS) to the upside confirms buyers stepping in.
-Price then creates a Higher Low (HL) followed by Higher Highs (HH) → early bullish trend established.
This is a textbook reversal from bearish → bullish.
2. Key Zones Identified
Support Zone (Demand)
Located around 4195 – 4174
→ This is where the ChoCH and HL formed, confirming buyer strength.
Resistance Zone (Supply)
Located around 4219 – 4229
→ Price is currently approaching this zone. If it breaks, bullish continuation is expected.
3. Price Behaviour & Expectation
Your yellow projection is correct:
- Price may pull back into the minor support (near current level).
- After that, a bullish leg toward 4219 zone is expected.
- If BOS occurs above 4229, price has room to expand toward new highs around 4238–4244.
This aligns perfectly with the HH → HL structure forming now.
4. Trading Logic
Why bullish?
- Clear BOS on bullish side
- Higher Low forming above support
- Liquidity taken from previous LL
- Price respecting the new bullish structure
Invalidation
If price breaks below 4174, bullish structure is invalidated.
5. Trade Signal
This follows your trading style — structure-based, clean, and logical.
📌 BUY ENTRY: 4203 – 4207
(Retesting minor support + inside new bullish structure)
📌 STOP LOSS: 4178
(Below HL and below ChoCH zone — strong invalidation)
📌 TAKE PROFIT 1: 4219
(Retest of resistance zone)
📌 TAKE PROFIT 2 (Main Target): 4229 – 4233
📌 TAKE PROFIT 3 (Extended Target): 4242 – 4244
Risk–Reward:
1 : 2.5 up to 1 : 4 depending on TP

GOLD ANALYSIS 12/09/20251. Fundamental Analysis:
a) Economy:
USD:
The USD is moving in a narrow range without strong breakout momentum. Investors expect the Fed to cut rates in upcoming quarters, which weakens the USD’s ability to pressure gold downward. However, when SPDR sells, the supportive effect of a weaker USD on gold diminishes significantly.
U.S. Stocks:
U.S. equities remain in a risk-on state, rising on expectations of tax policy changes and speculative capital rotating back into stocks. This creates short-term downward pressure on gold and opens room for deeper corrective waves.
FED:
The Fed maintains a “data-dependent” stance but leans toward rate cuts if inflation continues to ease. This supports gold in the mid-term, though in the short term, it’s not strong enough to prevent price declines when ETFs are selling.
TRUMP Administration:
Trump’s administration prioritizes tax cuts and support for businesses → bullish for equities.
Conversely, this pressures gold unless geopolitical risks emerge.
Trade-war-style tensions with China still form a background long-term risk that can support gold.
Gold ETF – SPDR:
SPDR has sold lightly for two consecutive sessions, weakening institutional demand.
→ This is an important signal that makes gold more vulnerable and increases the probability of scenario 02 on the chart.
b) Geopolitics:
Tensions in the Red Sea, the Middle East, and Ukraine remain unresolved. While not causing major market shocks, these risks maintain a latent risk-off environment where gold can spike sharply on any negative headline.
c) Market Sentiment:
Market sentiment is currently neutral-to-bearish, making gold more likely to follow a corrective pattern. Traders are waiting for clearer signals from economic data and geopolitics.
2. Technical Analysis:
15-minute timeframe:
Price is hugging the ascending trendline, but selling pressure is dominant.
RSI is in a short-term neutral zone → potential for a minor pullback.
Market structure leans toward breaking support at 4,174 – 4,163 if selling continues.
Two main scenarios:
01 – Technical pullback then continuation down toward 4,193 and a rebound if this level holds.
02 – Deep decline into major accumulation zone (if risk-on strengthens):
• A break below 4,174 opens the path to:
4,147
4,120
→ This is the strongest BUY zone of the day.
RESISTANCE: 4,219 – 4,239 – 4,263
SUPPORT: 4,174 – 4,163 – 4,120
3. Yesterday’s Market (8/12/25):
Gold moved in a narrow sideways range as expected.
No strong bullish momentum due to lack of catalysts.
SPDR’s light selling allowed gold to maintain its upward structure.
Low volume → price action prone to noise and false breaks.
4. Trading Strategy for Today (8/12/25):
🪙 SELL XAUUSD | 4221 – 4219
SL: 4225
TP1: 4213
TP2: 4207
🪙 BUY XAUUSD | 4160 – 4162
SL: 4156
TP1: 4168
TP2: 4174

Gold Technical Outlook: Support at 4197, Resistance at 4220Gold Market Analysis — Key Levels in Focus
Gold is currently trading around 4208, staying within a tight range as the market processes shifting expectations around potential Fed rate cuts. Recent price behavior shows buyers defending the 4197 support, while the 4220 zone continues to act as a notable resistance area on the intraday structure.
From a broader perspective, the market may still look to sweep deeper liquidity toward the 4080 zone before establishing a clearer bullish continuation, especially if sentiment remains sensitive to macroeconomic developments. For now, 4220 remains the level to watch — how price reacts here may help shape the next directional move.


GOLD Setup: Buy First, Sell at 4316 ReactionHey guys,
I have a two-way analysis on gold today. First, I expect a bullish move, and I’ve already set a buy position.
After that, I’m anticipating a reaction to the 4316 level, where I’ve placed a sell position as well.
Let’s watch the chart together and see how this analysis plays out.

Title: Trendline Break Setup – Gold Opportunity SHORTGold has moved into a key supply zone and broken the trendline, presenting a high-probability setup. Entry on trendline confirmation offers a strong risk/reward, targeting at least 4R.
Partial positions help manage risk,
with stops shifted to break-even after initial gains.
The combination of zone confluence and trendline break increases the chance of continuation, while monitoring price reaction allows for adaptive management.
