XAUUSD M30 | Bearish Reversal Off 50% Fibonacci ResistanceMomentum: Bullish
The price is reacting off the sell entry, which is a pullback resistance that aligns with the 23.6% Fibonacci retracement, which adds significant strength to this level.
Sell entry: 4,216.84
Pullback resistance level
23.6% Fibonacci retracement
Stop loss: 4,225.86
Pullback resistance
50% Fibonacci retracement
Take profit: 4,193.51
Pullback suport
High Risk Investment Warning
Stratos Markets Limited (tradu.com ), Stratos Europe Ltd (tradu.com ):
CFDs are complex instruments and come with a high risk of losing money rapidly due to leverage. 70% of retail investor accounts lose money when trading CFDs with this provider. You should consider whether you understand how CFDs work and whether you can afford to take the high risk of losing your money.
Stratos Global LLC (tradu.com ): Losses can exceed deposits.
Please be advised that the information presented on TradingView is provided to Tradu (‘Company’, ‘we’) by a third-party provider (‘TFA Global Pte Ltd’). Please be reminded that you are solely responsible for the trading decisions on your account. Any information and/or content is intended entirely for research, educational and informational purposes only and does not constitute investment or consultation advice or investment strategy. The information is not tailored to the investment needs of any specific person and therefore does not involve a consideration of any of the investment objectives, financial situation or needs of any viewer that may receive it. Past performance is not a reliable indicator of future results. Actual results may differ materially from those anticipated in forward-looking or past performance statements. We assume no liability as to the accuracy or completeness of any of the information and/or content provided herein and the Company cannot be held responsible for any omission, mistake nor for any loss or damage including without limitation to any loss of profit which may arise from reliance on any information supplied by TFA Global Pte Ltd.
Trade ideas

Golden Reversal from FVG Zone [XAUUSD]OANDA:XAUUSD Golden Reversal from FVG Zone
Signal: BUY
Entry: 4,206.50
TP1: 4,217.00
TP2: 4,229.00
TP3: 4,240.00
SL: 4,188.00
Insights:
Price retraced into a Fair Value Gap (FVG) near 4,206, aligning with a high-volume node on VRVP and previous BOS level.
RSI is neutral (51–53), suggesting room for upside; MACD shows bullish crossover with widening histogram.
Red MA (likely short-term) is flattening while blue MA (longer-term) supports upward bias—confluence for reversal.
#FVGReversal #SmartMoneyBuy #GoldScalpSetup#VRVPConfluence #MACDCrossover #RSINeutralMomentum
🌟 Trade Like Hunter
✅ High-Probability Setup: Strong confluence across VRVP (volume node), MA (flattening short-term), RSI (neutral), MACD (bullish crossover).📊 Risk-Reward Ratio: ~1:2.5 (TP2), ~1:3.5 (TP3) — solid for scalping and swing.🔑 Liquidity Zone Confirmation: Entry sits inside FVG and near BOS, indicating smart money accumulation.🧠 Market Psychology: Price shows signs of accumulation post-structure break; sentiment shifting toward bullish retracement.⚡ Probability Score: 80% High Probability📈 Scalability: Setup aligns with 1H and 15M zones for intraday confirmation.
🔒 Risk Disclaimer: Always use proper lot sizing and risk management. Market conditions can change rapidly — trade responsibly.

XAUUSD – Bullish Continuation Setup ExplainedAs we can see, Gold has been respecting every important structural point on the 4H chart. The entire move from early November until now can be divided into accumulation, expansion, correction and reaccumulation.
The first phase started with accumulation in early November. Price built a base with controlled higher lows, engineered liquidity and a slow rise under a descending structure. Liquidity was taken from the downside multiple times, which showed that the market was preparing for a stronger directional move.
The second phase was expansion. Price broke the descending structure with strong displacement candles, left behind a fair value gap and continued upward until it reached the upper supply order block. That zone reacted immediately, proving it was a valid OB. The breakout phase also created imbalances and unmitigated demand pockets, confirming that institutional money pushed the move.
After tapping the supply zone, the market moved into the correction phase. This correction formed a clean descending path into a bullish order block. Price reacted strongly from this zone and entered a consolidation range. This consolidation acted as reaccumulation, showing that buyers were not done yet and were absorbing all selling pressure inside the range. The internal structure inside this box remained bullish with protected lows.
Recently, price returned to the same bullish order block and rejected again. This rejection is important because it confirms that the OB is still active and that buyers continue to defend it. With price holding above the OB, the market structure remains in a bullish state.
Currently, price is compressing toward the upper imbalance region. Liquidity sits above the recent equal highs, and the fair value gap above is still unmitigated. As long as price remains above the bullish order block, the expectation is a continuation move to fill the imbalance first and then reach back toward the upper supply order block around the 4300 area.
If price breaks below the OB, the structure shifts into deeper correction, but at the moment there is no clear evidence of that scenario. Buyers are still maintaining control through consistent reactions and protected lows.
The overall bias remains bullish while price trades above the order block. Gold appears to be preparing for the next impulsive leg toward the imbalance and upper supply zone.

Going Short On Gold.Yesterday into today, we saw an explosive move straight to the upside on gold. But right now, I am going short. I am also testing out a new approach which is the Malaysian Support and Resistance strategy, and as you can see, I have caught a proper sniper entry. My risk to reward on this setup is 1 to 13, so the upside on this trade is serious. Let us see how it plays out.

XAUUSD: Uptrend to ContinueGold is moving exactly as analyzed. Following a period of consolidation, the market has resumed its bullish trajectory. The 4170-4180 zone remains the optimal range for entering long positions. Stick to a long-biased trading strategy as long as the uptrend stays intact.
All signals have been 100% accurate for two consecutive weeks. I’ll keep delivering pinpoint signals — act fast to get yours now.

Gold Trade Set Up Dec 10 2025Price has swept PDL already and is approaching London highs, if price sweeps it and makes internal 5m-15m engulfing/CISD to the downside i will look for a continuation down to demand and lower SSL

GoldXAUUSD
- Completed " 1234 " Impulsive Waves
- Bullish Channel as an corrective pattern in Long Time Frame
- Fair Value Gap
- Symmetrical Triangle in Short Time Frame
- Order Block

BULLISH MOVEPrice is generally on a bullish trend, a reversal occured bringing the price back to the demand zone. We expect buys to continue the uptrend

Holding Breath for FOMC News - Will History Repeat?XAUUSD Trading Idea Today (FOMC - Big News)
Will history repeat:
Before the news: Sideway | News release: prioritize SELL
Today's range: 417X–423X
Expectation: FOMC release leads to selling (Powell is usually hawkish → price drops like in September & October)
1) Intraday Trading (catching the Sideway range)
Upper range:
4218–4220
4230–4233
Lower range:
4170–4173
4180–4182
→ Morning & afternoon prioritize catching the range – trade within the range for safety before the news.
2) During the news (for those who trade the news)
Not suitable for those who are risk-averse, so you can skip if you can't handle it. Limit if you want to learn and profit using a very small account.
1) 4218–4220 (Risk-only) (if it doesn't break all day)
• High reaction area
• Safe → skip
• Risk → Probe sell, small SL
2) 4230–4233 (Main Sell)
• Strong resistance within the range
3) 4240–4244–424X (Best Sell)
• Liquidity zone
• If spike during/before news → High RR sell
3) Target down
TP1: 418X
TP2: 416X-5x
TP3: 409X (main target – swing + FVG + fibo)
4) BUY?
Attention area:
4150-52
4128-32
4102-96
5) Note on the news
This scenario holds if Powell maintains a hawkish tone.
If Powell is more "dovish" → it may go against expectations.
Risk-averse traders → do not trade the news.
News traders → use a small account to test market reactions.
Quick Summary
Before the news → Sideway, catch the range 417X–423X
News release → prioritize SELL
SELL zone: 4218, 4230–4233, 4240–4244
Main target: 409X
The price will move with each statement from the Fed Chairman and keep an eye on Trump too.
Wishing everyone a victorious day.

Gold ahead of FED decisionGold has completed a Wave 4 triangle and has now broken out decisively, confirming the start of Wave 5. After the breakout, price action has formed a rectangle consolidation, which reflects investor indecision, understandable ahead of tomorrow’s Fed rate decision.
If the Fed cuts rates, gold would likely rally, with Wave 5 breaking out of the rectangle and pushing toward the upper boundary of the rising purple channel, which comes in around $4,500.
If the Fed does not cut, we could see a deeper correction, potentially pulling gold back toward the $3,800 level, a major historical support.

Carry Trade in the Global Market 1. What Is a Carry Trade?
A carry trade works on a basic principle:
Borrow cheap, invest expensive.
(Borrow a currency with low yields → Convert it → Invest in assets with higher yields.)
For example, if Japan has a near-zero interest rate and Brazil has a rate of 8%, a trader may borrow Japanese yen (JPY), convert to Brazilian real (BRL), and invest in BRL bonds. The trader earns the interest difference — provided the BRL does not depreciate significantly.
Carry Trade Formula
Profit ≈ (Interest Earned from High-Rate Asset) – (Interest Paid on Borrowing) ± (Currency Appreciation/Depreciation)
Currency movement plays a massive role — it can multiply profits or wipe them out.
2. Why Carry Trade Exists?
Carry trades are possible because countries have different economic conditions, which lead to different interest rates:
Developed countries (Japan, Switzerland, US historically) often have lower interest rates.
Emerging markets (Brazil, Turkey, India, South Africa) usually offer higher interest rates to attract capital.
This rate divergence creates opportunities for traders seeking yield.
3. Popular Funding Currencies in Carry Trade
Some currencies consistently play the role of “funding currencies” due to their long-term low interest rates:
1. Japanese Yen (JPY)
Japan has kept near-zero or negative interest rates for decades. The “Yen Carry Trade” is the most famous globally.
2. Swiss Franc (CHF)
Known for stability, Switzerland typically has very low interest rates.
3. Euro (EUR)
During slow-growth phases, the euro becomes a funding currency via ECB’s low-rate policies.
4. US Dollar (USD)
At times of low Federal Reserve rates (QE periods), the USD becomes a funding currency.
4. Popular Target Currencies and Assets
Carry traders look for higher yields:
Emerging market currencies: INR, BRL, MXN, ZAR, TRY
Government bonds: High-yield bonds in emerging economies
Corporate bonds with attractive coupons
Stock markets with high dividend yields
Commodities linked to high-yield economies (e.g., AUD and NZD are linked to commodity cycles)
AUD (Australian Dollar) and NZD (New Zealand Dollar) have historically been favorite carry trade target currencies due to higher interest rates compared to Japan or the US.
5. How Traders Execute Carry Trades
Step 1 — Borrow in Low-Interest Currency
Example: Borrowing 1 million JPY at 0.10% interest.
Step 2 — Convert to High-Interest Currency
Convert JPY → AUD or BRL or INR.
Step 3 — Invest in Higher-Yielding Asset
Purchase:
Government bonds
Interest-bearing deposits
High-yield stocks
Forex positions
ETFs or futures in emerging markets
Step 4 — Earn Carry
The trader earns the interest rate differential, and if the target currency appreciates, gains are even higher.
Step 5 — Exit the Trade
Convert back to original funding currency and close positions.
6. Why Carry Trades Are Extremely Popular
1. Predictable Income
Interest differentials provide steady returns even without market movement.
2. Leverage Enhances Profit
Banks and hedge funds use high leverage (sometimes 10x–50x), multiplying returns.
3. Trend Reinforcement
When too many traders join the trade, the target currency strengthens, making the carry trade even more profitable — creating powerful trends.
4. Easy Access in FX Markets
Forex markets operate 24/5 with deep liquidity.
7. Risks of Carry Trades
Carry trades can be highly profitable, but they also carry significant risks, primarily due to currency volatility, global economic shocks, and central bank decisions.
1. Exchange Rate Risk
The biggest risk is the currency you invested in sharply depreciates.
Example:
You borrow JPY → buy AUD.
If AUD crashes, your profits vanish instantly.
2. Sudden Policy Shifts
Central bank changes can destroy carry trades:
Japan ending negative rates
ECB increasing interest unexpectedly
Fed tightening monetary policy
Such shifts can rapidly reverse currency flows.
3. Flight to Safety
During global uncertainty, investors rush to safe currencies (JPY, CHF, USD):
Geopolitical crises
Recession fears
Financial instability
This causes high-yield currencies to collapse.
4. Leverage Risk
High leverage increases profits but also magnifies losses.
Even a small 1% adverse move can wipe out leveraged traders.
8. Historical Examples of Carry Trade Movements
1. Yen Carry Trade (1995–2007)
Japan kept interest near zero, leading investors to borrow yen and invest globally.
For years, it boosted markets in:
Australia
Brazil
India
Eastern Europe
This flow helped fuel global asset inflation.
2. Global Financial Crisis (2008)
Mass unwinding of yen carry trades caused:
Yen appreciation
Emerging market currency crashes
Global liquidity shortage
Carry trades collapsed as investors fled to safety.
3. Post-COVID Period (2020–2023)
Ultra-low rates encouraged carry trades again, especially involving USD and JPY.
9. Modern Carry Trade Strategies
1. FX Carry Trade
The traditional model: borrowing one currency and investing in another.
2. Bond Carry Trade
Buying high-yield government or corporate bonds using borrowed funds.
3. Commodity Carry
Investing in commodity currencies (AUD, CAD, NZD) tied to global demand.
4. Crypto Carry Trade (New Trend)
Borrowing stablecoins at low rates → staking in high-yield crypto platforms.
Extremely risky and volatile.
10. Factors Influencing Profitability
Interest Rate Differential
Wider the gap, higher the potential profit.
Inflation Outlook
Low inflation → stable currency → good for carry trades.
Economic Stability
Stable countries attract carry trade capital.
Commodity Prices
Commodity-rich countries (Australia, Canada) benefit from rising global demand.
Risk Sentiment
Carry trades thrive during risk-on markets
and collapse during risk-off phases.
11. How Retail Traders Use Carry Trades
Retail traders use:
Forex trading accounts
Currency ETFs
High-yield international funds
Futures & options on currencies
Carry trade opportunities often show up in pairs like:
AUD/JPY
NZD/JPY
USD/ZAR
USD/INR
USD/BRL
These pairs reflect strong interest rate differences.
12. When Carry Trades Work Best
Carry trades perform well when:
Global volatility is low
Central banks’ policies are predictable
High-yield countries show stable growth
Commodity markets are strong
Investors have appetite for risk
In such conditions, currencies appreciate, and the interest differential adds extra profit.
13. When Carry Trades Collapse
They collapse when:
Risk sentiment turns negative
Markets experience shock events
Central banks shift policies suddenly
Global recession fears rise
Such conditions cause mass unwinding.
Conclusion
Carry trade is a powerful and influential global-market strategy built on borrowing in low-interest currencies and investing in high-interest assets. It thrives on interest rate differentials, global stability, and investor risk appetite. Although potentially highly profitable, it is equally risky due to currency volatility, economic shocks, and leverage. Understanding the macroeconomic environment, policy cycles, and capital flows is essential for anyone engaging in carry trades.
When executed with proper risk management, carry trades can be a sustainable, long-term source of returns — but they require deep awareness of global market dynamics.

XAUUSD | Bullish Reversal From Demand Zone🔥 XAUUSD | Intraday Reversal Setup – Buying From Demand Zone 🔥
Gold (XAUUSD) just tapped a fresh intraday demand zone, showing a sharp rejection wicks and a strong bullish push back above structure. Price is forming a potential short-term reversal, giving a clean BUY setup with multiple Take-Profit levels.
🟢 Why This Buy Setup?
Price respected a key support zone with aggressive buyer reaction.
Strong bullish engulfing candle after liquidity sweep.
Market structure turning bullish on lower timeframe.
Clear RR with defined TP1, TP2, TP3.
🎯 Targets (TP Levels)
TP1: Safe scalper target
TP2: Trend continuation target
TP3: Final extension target
🛡️ Stop Loss
SL placed below the rejection wick — protecting the setup while keeping RR favorable

XAUUSD – Bearish Reversal Setup With Liquidity Sweep and Sell-OfAnalysis:
The chart shows a bearish setup on XAUUSD where price has tapped into a supply zone (highlighted in red) and is expected to reverse downward.
Key elements visible:
Supply Zone (SL area): Price recently reached a premium area where sellers previously stepped in. This is marked as the stop-loss region.
Distribution Pattern: The zig-zag sketch indicates expected consolidation / distribution before the drop.
Entry Zone: The current level sits just below the supply, suggesting a short opportunity after confirmation.
TP 50% Level: A midpoint partial take-profit level is marked around 4193.439, indicating a measured extension.
Final Target: The dark teal zone at the bottom represents the larger bearish target, aligning with previous demand / liquidity areas.
Overall, the chart expresses a short bias, expecting price to form a top structure and then sell off toward the deeper target zone after taking liquidity above.

GOLD The Target Is UP! BUY!
My dear subscribers,
GOLD looks like it will make a good move, and here are the details:
The market is trading on 4206.0 pivot level.
Bias - Bullish
My Stop Loss - 4196.6
Technical Indicators: Both Super Trend & Pivot HL indicate a highly probable Bullish continuation.
Target - 4221.3
About Used Indicators:
The average true range (ATR) plays an important role in 'Supertrend' as the indicator uses ATR to calculate its value. The ATR indicator signals the degree of price volatility.
Disclosure: I am part of Trade Nation's Influencer program and receive a monthly fee for using their TradingView charts in my analysis.
———————————
WISH YOU ALL LUCK


Theory: Dec 8 candle downward continuation?This trade is a hypothetical, solely based on following momentum.
Daily open 13 points right off the gate,
entry was based on H1 bearish engulfing candle indicating a downside continuation.
if a candle close below the open, this will confirm the downside.
however, if there is a close below open and then a close above open, this indicates a uncertain environment with potential of false signals.
all this is hypothetical, Ranges are messy and can give a false assessment, but it is great for data collection.
DO NOT RISK UNLESS RISK IS UNDERSTOOD.
Do not be afraid, it is not real.

gold going long!! but not yetmy thoughts on gold is that we are going to continue bullish momentum but first we need a slight pull back . gold already confirmed a change of character when it slightly broke the previous highs last week around 4260 . that is also at a daily supply area and price is once again showing weakness once reaching that area. I see gold pushing back down to 4087 which would create relatively equal highs at that supply area. once price rejects 4087 we can anticipate buys up to 4377 area.

Bullish trend gold its still bullish . its consolidation 4190-4200
Next step is 4300-4380 before cut rates .

$XAUUSD BULLISH ANALYSIS ( READ CAPTION)Hi traders ! Today is 04 December 2k25 here is my analysis chart please read it and send me your ideas about this chart in comment section.
OANDA:XAUUSD running around with pivot point $4190 and market not make a bearish trend in any H1 or H4 candle and it is breakout bearish trend. market pull up bullish again and again, If market break 4200 and H1 candle close above the 4200 then market never comeback down side.
The bullish trend is intact, with potential for further gains 4200, 4210,and 4220. A break above rejection point 4206 could strong signal continued bullish momentum.
Bullish Scenario:
Target 1: ($4200)
Target 2: ($4210)
Target 3: ($4220)
Rejection point:($4206)
Support : ($4180) Key level to hold
please dont forget like and comment for more latest updates
this analysis for informational purposes only. trade is own your risk

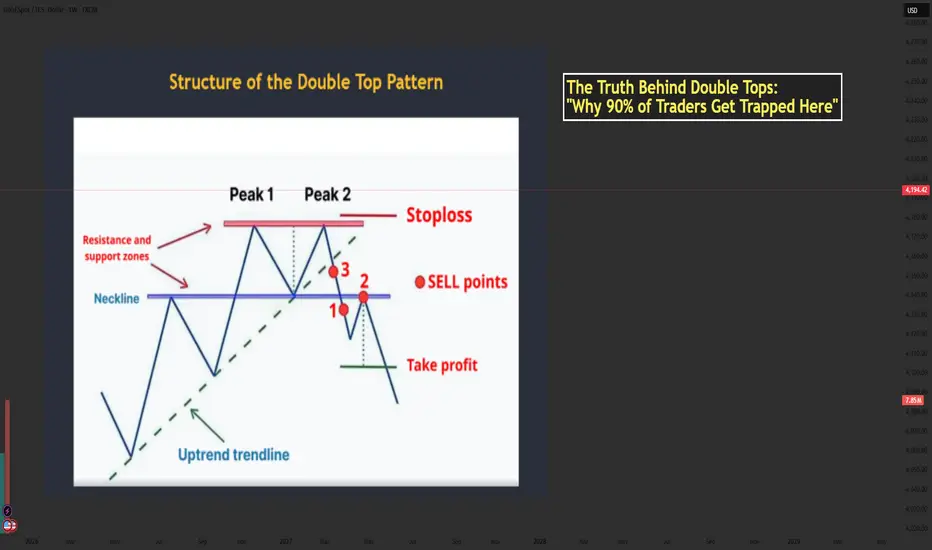
The Truth Behind Double Tops: Why 90% of Traders Get Trapped...📘 Mastering the Double Top Pattern — Structure, Psychology & How Smart Money Uses It
- The Double Top is one of the most powerful reversal patterns in technical analysis. When used correctly, it helps traders catch the transition from bullish momentum → bearish reversal with high accuracy.
- Let’s break down the structure using the chart you provided and enhance it with professional-level insights.
🔶 1. Structure of the Double Top
1️⃣ The First Top
- Price pushes upward strongly during an uptrend.
- Buyers are in full control and create the first peak.
- After reaching resistance, price pulls back → forming the neckline.
This pullback is normal and represents the market taking profits.
2️⃣ The Second Top
- Price rallies again but fails to break above Peak 1.
- This failure is extremely important — it shows bulls are losing strength.
- The second top traps late buyers who expect a breakout.
3️⃣ The Neckline Break
- Once price breaks below the neckline, the structure is officially confirmed.
- This represents sellers overwhelming buyers.
- A break of structure → shift in market control.
📌 Professional traders only consider the pattern valid AFTER the neckline break.
🔶 2. Market Psychology Behind the Double Top
Understanding the pattern’s psychology is what separates beginners from professional traders.
1️⃣ At Peak 1
Bulls believe the trend will continue.
Retail traders buy aggressively.
2️⃣ Pullback to Neckline
A healthy correction occurs; no one expects a reversal yet.
3️⃣ At Peak 2
This is where emotions start to shift:
- Retail buyers expect a breakout.
- Smart Money uses this area as a liquidity zone to trigger buy stops.
- Institutions often sell into this liquidity, creating the foundation for reversal.
4️⃣ Neckline Break
Panic begins:
Buyers trapped at Peak 2 start closing positions.
Sellers enter aggressively.
Momentum shifts — the trend has reversed.
5️⃣ Retest
The retest is a psychological trap:
- Trapped buyers hope for “one more push up.”
- Sellers add positions at better prices.
- When price rejects the neckline → the downtrend accelerates.
💡 This is why the retest is the safest sell entry.
🔶 3. Conditions for a High-Quality Double Top
To avoid fake patterns, check these criteria:
✔️ Must appear after a clear uptrend
✔️ Both tops should be similar in height
✔️ Volume should decrease on the second top
✔️ Neckline breakout must be decisive and clean
✔️ Better if second peak creates a stop-hunt wicking above Peak 1
✔️ Even more powerful when aligned with:
- HTF resistance
- Institutional zones
- Liquidity sweeps
- Overbought RSI
- Divergence
🔶 4. How to Trade the Double Top
1️⃣ Entry (Sell Zone)
Best Entry:
👉 SELL on the neckline retest after the breakout.
This gives:
- Best accuracy
- Best risk–reward
- Confirmation that the market has shifted bearish
2️⃣ Stop Loss Placement
Place SL:
- Above Peak 2
- Or above Peak 1 (more conservative)
🛑 SL must sit outside the structure to avoid fake moves.
3️⃣ Take Profit Target
The classic measurement:
- Distance from Peak → Neckline
- Projected downward
This gives the first TP.
TP2 can be placed at:
Next support zone
- Fib 1.618 extension
- HTF demand area
🔶 5. Real Market Example
Your image shows:
- Two clear peaks forming under a resistance zone
- Neckline support holding price
- A strong break below the neckline
- Sell entries at the ideal points:
+ Point 1 → aggressive breakout trader
+ Point 2 → safest retest entry
+ Point 3 → early anticipation entry (riskier)
The downward projection after the pattern aligns perfectly with the expected target zone.
🔶 6. Trader Psychology: Why People Lose with Double Tops
Most traders get trapped because they:
❌ Sell too early (before neckline break)
❌ Expect the second top to drop immediately
❌ Ignore volume or candle strength
❌ Enter without waiting for retest
❌ Fear missing out and chase price after the big drop
Smart Money uses these emotions:
- Greed → traps buyers at Peak 2
- Fear → forces panic selling at neckline break
- FOMO → attracts late sellers at the worst price
Your job is to stay patient and enter only at the retest, where probability is highest.
🔶 7. Professional Tips to Master the Double Top
✔️ Wait for structure confirmation → neckline break
✔️ Don’t sell inside the range between the two peaks
✔️ Use RSI divergence to strengthen accuracy
✔️ Look for stop-hunt wicks above Peak 2
✔️ Combine with trendline breaks for timing
✔️ Use a top-down approach (H4 + H1 → M15 entry)
✨ Final Message for Traders
The Double Top is not just a pattern it is a reflection of fear, greed, and trapped liquidity.
Master the psychology behind it, and it becomes one of your most reliable reversal tools.
If this helped your trading, drop a comment and share your thoughts!
Let’s grow together. ❤️📈
GOLD MONTHLY CHART LONG TERM/RANGE ROUTE MAPHey Everyone,
We’ve just released our new Monthly Chart idea, which we’ll now be tracking following the completion of our previous long term monthly chart idea. It’s time to shift focus to the next big setup.
Currently, price is trading above the channel midline, and we’ve also seen a candle body close above 4000 for November month opening a long range gap to 4436 AXIS.
EMA5 cross and lock would further confirm this but its lagging on the longer time frame and therefore not enough time to action if waiting for ema5 confirmation. A candle body close is suffice for us to use to track the levels on this timeframe when EMA5 lags behind.
While the candle body close above 4000 confirms the bullish long term structure, we’re also mindful of the potential for a short term retracement, particularly around the EMA5 detachment zone (highlighted with a circle on the chart). This would offer a healthy dip opportunity, aligning perfectly with our strategy to buy into weakness on the way up.
For the bigger structure to remain intact, we’ll be looking for 4000 to continue holding as key primary structural support. As long as that level is respected, the long term gap toward 4436 remains firmly in play. 3532 remains our secondary structural support, also our swing range inline with the channel half line, providing a long term pivotal structural level of support.
This is a higher timeframe idea that we’ll be building on as structure continues to unfold.
We will continue to use all support structures, across all our multi time frame chart ideas to buy dips also keeping in mind our long term gaps above. Short term we may look bearish but looking at the monthly chart allows us to see the bigger picture and the overall long term Bullish trend.
As always, we will keep you all updated with regular updates throughout the week and how we manage the active ideas and setups. Thank you all for your likes, comments and follows, we really appreciate it!
Mr Gold
GoldViewFX

GOLD | ANALYSIS📌 Trade Plan:
* Entry Level: 4,297
* Bullish Scenario: If price breaks above the resistance, the next target is 4,345.
* Bearish Scenario: If support breaks, price may extend downward toward 4,247.
Gold is sitting at a strong decision point where buyers and sellers are both active. A clear breakout from this zone will likely determine the next move. If momentum shifts upward, a clean push toward 4,345 is possible. But if price fails to hold support, a corrective drop toward 4,247 may follow.
This post highlights both sides of the market so traders can stay prepared for whichever direction unfolds.
Disclaimer: This is not financial advice; it reflects only my personal market analysis. Please do your own research before trading.

XAU/ USD 1 Hour Chart Scalp Trade Buy In ProgressHello traders. Well, I could not have gotten a better entry, as per my last analysis. I marked my entry point as well as where I closed the majority of the trade, in profit. The remaining 25% of the trade, my runner, is still running and my Stop Loss is above my entry point so there is no loss as profit is secured. Be well and trade the trend. Nice way to end the week. Big G gets all my thanks. Be well and have a great weekend.
