Gold Holds Its Bullish StructureGold Holds Its Bullish Structure as Support Zone Proves Its Strength
From the analysis shared earlier this week, GOLD moved from 4194 to 4247 after retesting the support zone once again.
The chart clearly shows that this support area remains extremely strong, even during the volatility of the FOMC meeting.
Gold was rejected multiple times near the 4180 region, reinforcing the probability of a continued bullish wave.
As mentioned before, Gold has lost its traditional correlation with DXY and USD for quite some time. The market is driven heavily by speculation and manipulation, making GOLD a risky instrument.
However, as long as the price holds above the support zone and maintains its bullish structure, further upside remains possible.
You may find more details in the chart!
Thank you and Good Luck!
❤️PS: Please support with a like or comment if you find this analysis useful for your trading day❤️
✅ Previous analysis:
Trade ideas

XAUUSD Long: The 4,160 Support Holds – Path to 4,260 is OpenHello, traders! The price action for XAUUSD is currently developing within a well-defined ascending trend structure, supported by a rising major Trend Line from the lows. The market previously showed multiple rejections from the Triangle Supply Line, each marked by clear breakout attempts followed by corrective pullbacks. These reactions formed a sequence of higher lows, confirming that buyers remain in control of the broader structure.
Currently, after the last strong impulsive move upward, Gold reacted from the Supply Zone around 4,260, forming a short-term corrective phase while respecting the rising Triangle Demand Line near the 4,160 demand level. Price is now compressing between the descending supply line and the ascending demand line, creating a tightening triangle structure that signals growing pressure for a directional expansion. This compression reflects a balance between profit-taking sellers at resistance and aggressive dip-buyers along demand.
My scenario for the further development is bullish continuation as long as price holds above the Triangle Demand Line and the 4,160 demand zone. I expect a rebound from current levels, followed by a renewed attack on the 4,260 Supply Zone. If buyers manage to produce a clean breakout above this resistance, Gold may accelerate toward higher targets with strong momentum continuation. However, if the supply zone holds and price breaks below the demand line, a deeper corrective pullback toward the main rising Trend Line could develop. For now, the structure favors buyers, with the key focus on a breakout attempt toward 4,260. Manage your risk!

GOLD is bullish now & many Traders don't see it !!!The price on the 4h timeframe is within an ascending triangle, which can be promising. If the price breaks this pattern with bullish candles, it could easily rise by the distance of AB=CD.

Gold Trade ideaGold (XAUUSD) is holding above the rising trendline support. A pullback toward the support zone is expected before a bullish continuation. A breakout above 4245 resistance could open the way toward the 4275–4299 levels.

Gold 1H – Will 4232 Trap Liquidity or 4170 Spark Expansion?🟡 XAUUSD – Intraday Smart Money Plan | by Ryan_TitanTrader (08/12)
📈 Market Context
Gold trades inside politically-driven liquidity as Donald Trump signals that the current method of tariffing through the US Supreme Court is “more direct, less cumbersome, and much faster.”
This introduces fresh uncertainty for USD flows, increasing short-term volatility across commodities.
Expect engineered sweeps on both sides as institutions react to policy-sensitive sentiment shifts.
On H1, price compresses between premium supply (4230–4232) and discount demand (4170–4168).
A confirmed MSS + BOS + displacement is required before any directional leg becomes valid.
🔎 Technical Framework – Smart Money Structure (1H)
Current Phase: Liquidity-rich compression inside a minor bullish channel
Key Idea: Sweeps first, real move later
Liquidity Zones & Triggers
• 🔴 SELL GOLD 4230 – 4232 | SL 4240
• 🟢 BUY GOLD 4172 – 4170 | SL 4162
Bias shifts only via structural break + clean displacement.
Expected Institutional Sequence:
sweep → MSS/CHoCH → BOS → displacement → FVG/OB retest → expansion
🎯 Execution Rules (matching your exact zones)
🔴 SELL GOLD 4230 – 4232 | SL 4240
Rules:
✔ Price taps 4231–4232 → bearish MSS/CHoCH on M5–M15
✔ BOS down + strong displacement candle
✔ Entry on bearish FVG fill / supply OB retest
Targets:
1. 4200
2. 4185
3. 4170
🟢 BUY GOLD 4172 – 4170 | SL 4162
Rules:
✔ Sweep below 4169 → bullish MSS/CHoCH
✔ BOS up + displacement from discount
✔ Entry on FVG fill or refined OB retest
Targets:
1. 4186
2. 4210
3. 4230 – 4232
⚠️ Risk Notes
• Headlines may induce fake sweeps; do not pre-commit without BOS + displacement
• No averaging inside compression
• SLs must sit at structural invalidation
• Reduce risk during tariff-related spikes
📍 Summary
Today’s playbook offers two institutional paths:
• 4231 sweep → bearish MSS → BOS → retest → delivery into 4170
or
• 4169 sweep → bullish MSS → BOS → retest → expansion back toward 4230+
Trade confirmations only.
Let gold show its hand — patience is your edge. ⚡️
📌 Follow @Ryan_TitanTrader for daily Smart Money breakdowns.

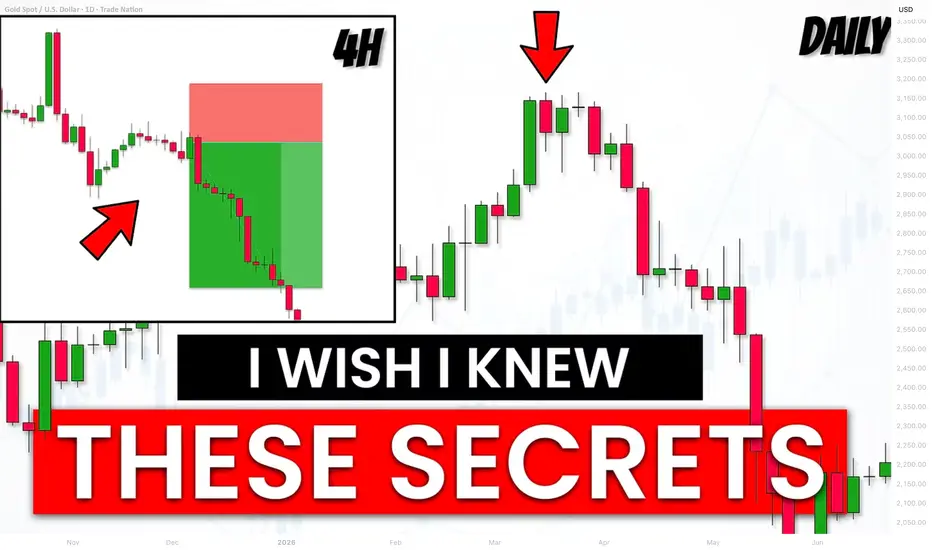
Top-5 tips for Top-Down Multiple Time Frame Analysis Trading
I am trading multiple time frame analysis for many years. After reviewing trading ideas from various traders on Tradingview, I noticed that many traders are applying that incorrectly
In this article, I will share with you 5 essential tips , that will help you improve your multiple time frame analysis and top-down trading.
The Order of Analysis Matters
Multiple time frame analysis is also called top-down analysis for a reason. When you trade with that, you should strictly start your analysis with higher time frames and then dive lower, investigating shorter-term time frames.
Unfortunately, most of the traders do the opposite . They start from a lower time frame and finish on a higher one.
Above are 3 time frames of EURGBP pair: daily, 4h, 1h.
To execute multiple time frames analysis properly, start with a daily, then check a 4h and only then the hourly time frame.
Limit the Number of Time Frames
Executing multiple time frame analysis, many traders analyse a lot of time frames.
They may start from a weekly and finish on 5 minute time frame, going through 5-8 time frames.
Remember that is it completely wrong . For execution of a multiple time frame analysis, it is more than enough to analyse 3 or even 2 time frames. Adding more time frames will overwhelm your analysis and make it too complex.
Analyse Particular Time Frames
Your multiple time frame analysis should be consistent and rule-based. It means that you should strictly define the time frames that you analyse.
For example, for day trading, my main trading time frames are daily, 4h, 1h. I consistently analyse ONLY these trading time frames and I look for day trades only analysing this combination of time frames.
Higher is the time frame, stronger the signal it provides
Trading with multiple time frame analysis, very often you will encounter controversial signals: you may see a very bullish pattern on a daily and a very bearish confirmation on 30 minutes time frame.
Always remember that the higher time frames confirmations are always stronger , and their accuracy and probability is always higher.
Above there are 2 patterns:
a head and shoulders pattern on a daily time frame with a confirmed neckline breakout, and an inverted head and shoulders pattern on a 4h time frame with a confirmed neckline breakout.
2 patterns give 2 controversial signals:
the pattern on a daily is very bullish and the pattern on a 4h is very bearish.
The signal on a daily time frame will be always stronger ,
so it is reasonable to be on a bearish side here.
You can see that the price dropped after a retest of a neckline of a head and shoulders on a daily, completely neglecting a bullish pattern on a 4H.
Each Time Frame Should Have Its Purpose
You should analyse any particular time frame for a reason.
You should know exactly what you are looking for there and what is the purpose of your analysis.
For example, for day trading, I analyse 3 time frames.
On a daily, I analyse the market trend and key levels.
On a 4H time frame, I analyse candlesticks.
On an hourly time frame, I look for a price action pattern as a confirmation.
On GBPAUD on a daily, I see a test of a key horizontal resistance.
On a 4H time frame, the price formed a doji candle.
On an hourly, I spotted a double top, giving me a bearish confirmation.
These trading tips will increase the accuracy of your multiple time frame analysis. Study them carefully and adopt them in your trading.
❤️Please, support my work with like, thank you!❤️
I am part of Trade Nation's Influencer program and receive a monthly fee for using their TradingView charts in my analysis.
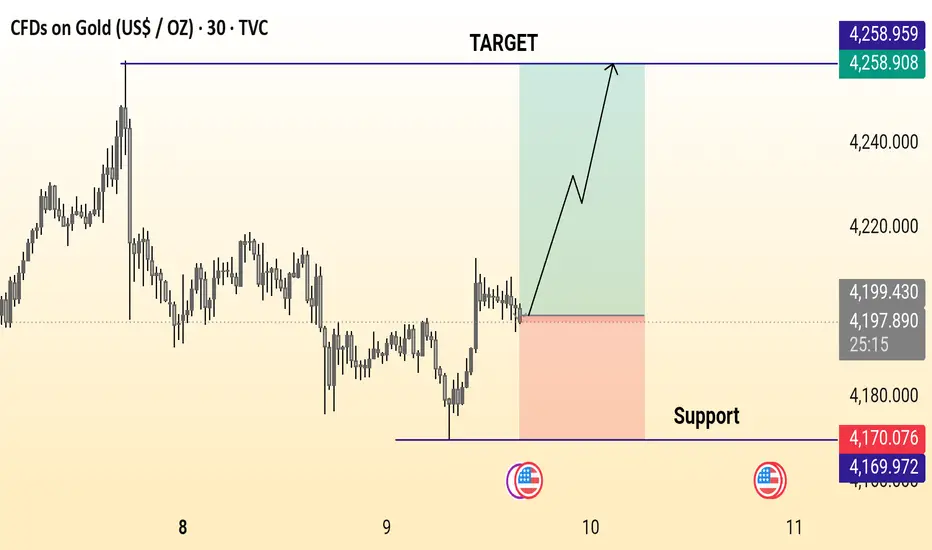
Gold bullish breakout setupGold (30-min) shows a bullish setup, bouncing from support near 4170 and aiming for an upside target around 4259 if price holds above the breakout zone.
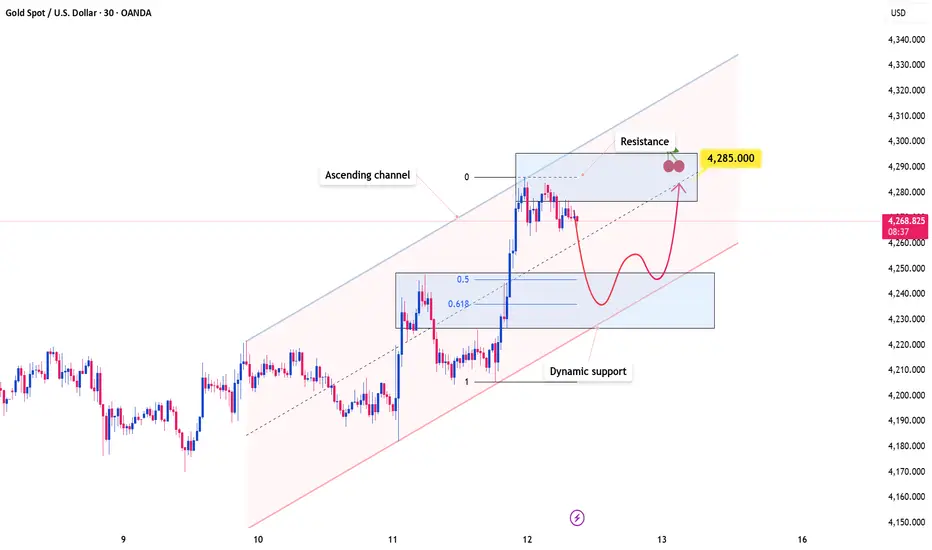
Gold Holds a High Ground While the Market Reprices RiskOANDA:XAUUSD continues to trade within a well-defined ascending channel, with price action consistently respecting both the upper and lower boundaries. This structure highlights strong bullish control, suggesting that buyers remain firmly in charge and that upside continuation is still favored.
Price has recently broken above a key resistance zone and may return to retest this level. If it holds as support, it would further validate the bullish structure and significantly increase the probability of a move toward the 4,285 target. This level aligns closely with the midline of the ascending channel as well as a previous resistance area, reinforcing its technical importance.
As long as price remains above this support zone, the bullish outlook stays intact. However, a failure to hold this level could weaken the current structure and open the door for a deeper pullback toward the lower boundary of the channel.
On the fundamental side, gold’s recent surge has been driven by an unexpected shift from the U.S. Federal Reserve toward monetary easing, including a return to bond purchases. This move pressured the U.S. dollar and effectively removed prior concerns over a prolonged hawkish policy stance, prompting renewed inflows into gold.
While short-term pullbacks remain possible due to overbought conditions, the broader trend continues to look constructive, supported by ongoing central bank buying and sustained demand for safe-haven assets.
GOLD → Consolidation above 4220. Bullish structureFX:XAUUSD is trading in a narrow range around $4,200, maintaining sideways momentum ahead of US inflation data. The market confirms a bullish structure...
The probability of a Fed rate cut in December remains at ≈90%.
Mixed US employment data:
– Jobless claims fell to their lowest level since September 2022.
– Layoffs in November reached a two-year high.
The key benchmark today is the PCE index for September (data delayed due to the government shutdown).
Gold is awaiting new signals on inflation. Range trading is likely until the release of PCE data, which may set the direction of movement ahead of the Fed's decision.
Resistance levels: 4238, 4262
Support levels: 4220, 4183
If the bulls hold their ground above local support at 4220, we will have a chance to break through 4238 and retest 4262. However, a breakout of the trading range resistance could trigger a continuation of the rally towards the ATH.
Best regards, R. Linda!

Gold Bear Flag Ready for a Bullish BreakoutHello everyone, Helene here! XAUUSD is currently showing a more positive outlook as price structure starts shifting into a bullish direction.
The latest market interaction is particularly interesting. We’re seeing an early recovery phase, weakening bearish momentum, and low-volume candles suggesting seller exhaustion. This often acts as an early signal for a potential bullish move developing.
Based on the current pattern, my target is around 4,330 – a reasonable level aligned with the market structure. Should price continue in this direction, the next move could become a beautiful extension of the bullish story in Gold we’ve been following.
This setup looks very appealing. It’s a developing scenario, although it still requires patience and proper confirmation before fully validating the upside.
Even though a bearish scenario is still possible due to the clear support zone below, I personally lean toward additional bullish continuation as the pattern forming here supports that outlook.
Wishing you a successful trading session and the best of luck.

XAUUSD: Bulls Hold Structure - Targeting 4,300 Resistance RetestHello everyone, here is my analysis of the current XAUUSD setup.
Market Analysis
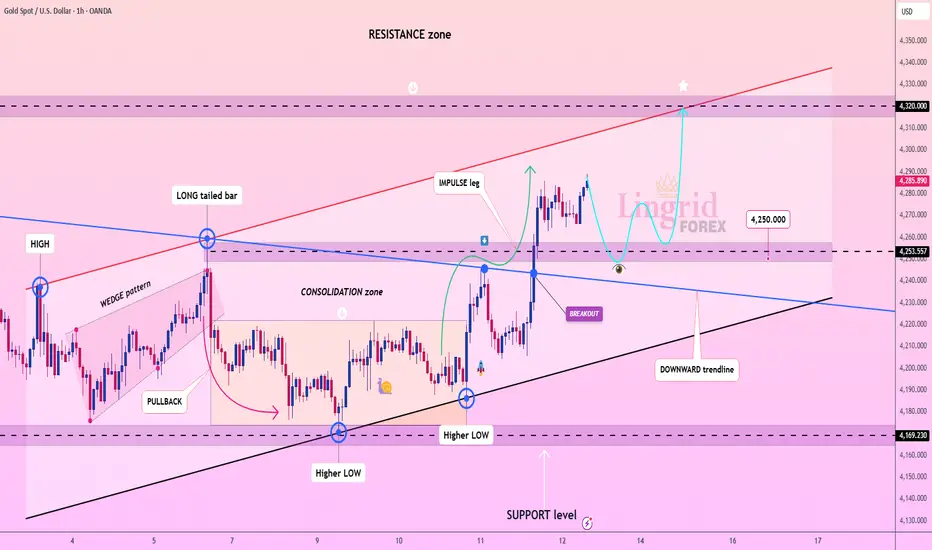
XAUUSD is trading within a broader ascending structure, supported by a well-defined trend line that continues to drive the market upward. Recent price action shows several successful breakouts from previous consolidation zones, confirming sustained bullish pressure. After an extended period of ranging, buyers regained control and pushed the market higher, respecting the overall upward trajectory.
Currently, price is moving within a narrowing formation defined by an upper resistance line and a lower support line. This developing wedge formation suggests that bullish momentum remains intact, but the market is consolidating before its next significant move. The 4,170 support zone continues to serve as a key demand area, where buyers previously stepped in and defended the bullish trend. On the other hand, the 4,300 resistance zone limits the upside and remains the primary barrier for buyers. Overall, the structure indicates that the market maintains a bullish bias as long as price stays above the support line and holds above the 4,170 support level.
My Scenario & Strategy
My scenario remains bullish as long as XAUUSD trades above the 4,170 support zone and continues to respect the rising support line within the current formation. I expect the price to attempt another move toward the 4,300 resistance zone, which aligns with the upper boundary of the wedge structure. A strong breakout above 4,300 would confirm bullish continuation and could open the path for further upward expansion.
However, if the price fails to hold the support line and breaks below the 4,170 level with clear momentum, the bullish scenario would be invalidated, potentially signaling the start of a deeper corrective phase. For now, the market structure favors a long bias, with focus on a potential movement toward the 4,300 resistance area.
That is the setup I am currently monitoring. Thank you for your attention, and as always — manage your risk!

Lingrid | GOLD Possible Price Acceleration After Range BreakOANDA:XAUUSD perfectly played out my previous trading idea . Price could be transitioning from pullback into continuation, following a clean expansion above the prior consolidation zone. The recent surge developed after a series of higher lows along rising support, while the breakout candle shows strong follow-through rather than exhaustion. Price behavior suggests the earlier pullbacks were corrective pauses, not distribution.
If buyers continue to defend the 4,250 demand pocket and volatility remains compressed above the former ceiling, TVC:GOLD may extend toward the upper channel boundary around where supply previously emerged. That zone may act as the next reaction point as momentum stretches.
➡️ Primary scenario: hold above 4,250 → advance toward 4,320.
⚠️ Risk scenario: a sustained slip below 4,235 may weaken bullish structure and reopen the 4,170 support area.
If this idea resonates with you or you have your own opinion, traders, hit the comments. I’m excited to read your thoughts!
GOLD Current Consolidation range remains bullishGold Consolidation bullish range after price holds the support manage bulls the signal the end of consolidation and start of the next up side.
Gold prices hovered near $4,200/oz on Monday, stabilizing after last week’s decline as traders awaited the Federal Reserve’s final policy meeting of the year. Markets widely expect the Fed to begin cutting rates, while mixed U.S. employment data and core inflation in line with expectations have strengthened the case for additional monetary easing.
From a technical perspective, the current range remains bullish. If bulls manage to defend the 4,200 support zone, if the break the support then again for bullish chance 4190 then gold may regain upward momentum. A sustained hold above this level opens the door for a potential move toward the 4,242 / 4,282 resistance area.
You may find more details in the chart.
Trade wisely best bod Luck.
Ps; Support with like and comments for better analysis thanks for supporting.

XAU/USD | Gold Testing Key Zones After Hitting Multiple Targets!By analyzing the #Gold chart on the 4 hour timeframe, we can see that price continued its bullish move and successfully reached the targets at $4240, $4250, and $4255, even spiking to $4259 before pulling back. After grabbing liquidity above those levels, gold corrected sharply down to $4192 and is now trading around $4209.
The next supply zones to watch are $4219 to $4244 and $4272 to $4293. Monitor how price reacts to these areas. If gold fails to hold above $4200 within the next 4 hours, we could see a deeper drop toward $4166.
Please support me with your likes and comments to motivate me to share more analysis with you and share your opinion about the possible trend of this chart with me !
Best Regards , Arman Shaban

Selena | XAUUSD 30m –Fresh Demand Inside Channel Monday OutlookPEPPERSTONE:XAUUSD
The left-hand range zone provided accumulation before price broke out and built this bullish structure. Each major dip into the rising trendline has produced strong upside continuations. The latest move created a new swing high and then a controlled, corrective decline inside a descending channel. That correction is now testing the fresh demand area, suggesting a potential reaction higher while the broader channel structure remains intact.
Key Scenarios
✅ Bullish Case 🚀
Bulls defend the 4188–4198 demand zone and hold above 4175.
Price reclaims short-term structure and pushes back towards:
🎯 Target 1: 4237–4240 (previous high / mid-range resistance)
🎯 Target 2: 4264–4265 (recent spike high / buy-side liquidity)
🎯 Target 3: 4285–4295 (channel high and final target zone)
❌ Bearish Case 📉
A clean 30m close below 4175 would show demand failing.
In that case, downside continuation could open the way towards:
🎯 Downside Target 1: 4145–4155
🎯 Downside Target 2: 4105–4110 (deeper liquidity and major support zone)
Current Levels to Watch
Fresh Demand / Support: 4188–4198
Intermediate Resistance: 4237–4240
Invalidation for bullish idea: sustained break and hold below 4175
⚠️ Disclaimer: This analysis is for educational and informational purposes only. It is not financial advice. Please do your own research and manage risk before trading.

Gold’s Next Big Move: 4,350 Is Within Reach!Hello everyone, it's Helene here!
Gold is looking pretty interesting right now. As mentioned in the previous analysis, the price shot up. But guess what? Right now, it's slightly pulling back, moving in the opposite direction to the previous uptrend, which looks like a familiar bullish flag pattern. In this case, there's a scenario that could play out, and considering the market conditions are still bullish, I'm leaning toward the possibility that the price will break the flag pattern to the upside.
My target is 4,350.
Do you agree? Leave a comment below. Joining the TradingView community is always helpful to improve and develop your trading skills.

GOLD MARKET UPDATEHey Everyone,
As we close out the week, price action on the 1 hour chart continues to consolidate within the defined Goldturn range between 4193 and 4233. The 4193 weighted Goldturn has held as a structural support level, generating the rebound that carried price back into 4233.
Earlier in the week, we observed a cross and lock above 4233, which leaves the 4275 gap unfilled. This upside inefficiency will remain on our radar as long as price holds above the mid range structure.
We will return Sunday with a full multi-timeframe breakdown and detailed trade tracking plan for the upcoming week.
Mr Gold

XAUUSDHello Traders! 👋
What are your thoughts on GOLD?
Gold continues to trade within a short-term ascending channel and is now approaching the upper boundary of this structure. This region also aligns with a major resistance zone formed by the previous swing high, creating a strong confluence area.
As price enters this resistance cluster, we expect selling pressure and a potential rejection. Based on the current momentum, it does not appear likely that gold will easily break above this zone in the short term.
Therefore, the more probable scenario is:
1-A pullback toward the lower boundary of the ascending channel
2- If the channel breaks to the downside, an extended decline toward the next key support level becomes likely
Don’t forget to like and share your thoughts in the comments! ❤️

Breakout Trading: How Low Win-Rate Systems Beat the Market█ Breakout Trading: How Low Win-Rate Systems Beat the Market
Most traders misunderstand breakout strategies. They expect high win-rates, smooth equity curves, and clean continuation.
But real breakout systems operate differently:
Low win-rate
Many small losses
Occasional massive winners
And long periods of nothing
A breakout strategy is not about predicting direction. It is about exploiting asymmetry, volatility expansion, and structural price imbalances. It is not about being right often; it is about being paid well when you are right.
█ What a Breakout Really Is
A breakout occurs when the price finally moves out of a range or breaks through a key level. It is not magic, and it is not random. It is mechanics, liquidity, and pressure.
Inside a range or right at a major level:
Liquidity builds on both sides
Stops accumulate above resistance and below support
Traders wait for confirmation
Algorithms sit idle during volatility contraction
When price pushes through a key level, it triggers a chain reaction:
stop orders → breakout entries → momentum algos → forced exits. This cascade is what creates the explosive leg everyone tries to catch.
In simple terms , a breakout happens when the price moves outside a well-defined support or resistance zone with strong momentum. This surge often marks the beginning of a new trend, a volatility expansion, or a major shift in market sentiment.
Breakouts appear in every asset class: stocks, futures, crypto, forex, and commodities, and on every timeframe from minutes to weeks. They are popular because when they succeed, they can deliver large, rapid moves and outsized profits.
But here is the part most traders ignore:
Most breakouts do not follow through. False breaks are common, and markets have become more efficient over time. Only breakouts with the right conditions, such as momentum, liquidity imbalance, and volatility expansion, have a high probability of running.
█ The Truth Most Traders Don’t Want to Hear
Most breakouts fail. Even strong breakout systems may only win 20 to 40 percent of the time.
Why does this happen?
Many breakout levels are weak
Liquidity is thin around obvious highs and lows
Algorithms hunt stop clusters before the real move
Price often snaps back into the range before expanding
But here is the part that actually matters:
Breakouts do not need a high win rate.
They need high asymmetry.
Small, controlled losses.
Occasional large, runaway winners.
This is the core structure behind every profitable breakout strategy.
⚪ Win-Rate and Risk/Reward: What Traders Should Actually Expect
The simple overview above is backed by decades of quantitative research. Breakout systems consistently show low win-rates but high R-multiple payoffs, and this is not an opinion. It is a measurable statistical pattern across markets and timeframes.
1. Low Win-Rate Is Normal and Expected
Across studies, breakout strategies typically win between 20 and 40 percent of the time.
Research by Bulkowski, academic momentum studies, and intraday ORB tests all show the same thing:
Breakouts frequently fail
Modern markets generate more false breaks than in the past
Algorithms exploit obvious levels and stop clusters
Short-term price action is dominated by mean reversion
A low hit rate is not a flaw. It is the natural behavior of breakout mechanics.
2. The Edge Comes From Asymmetric Payoff Distribution
A breakout strategy becomes profitable not by winning often, but by winning big relative to the risk taken.
Historical performance shows:
Losers: usually −1R
Winners: often +3R, +5R, +10R and beyond
When a system captures even a few of these extended moves, it more than pays for the many small stop-outs.
3. Breakout Systems Exploit Fat Tails and Volatility Expansions
Financial returns are not normal. They are fat-tailed. Breakouts are designed to capture these rare, outsized price moves.
The return distribution typically looks like:
Many small losses from failed breaks
A few large wins during volatility expansion
Long flat periods during range-bound conditions
Occasional massive trends that define the entire year
This right-skewed distribution is well-documented in momentum and trend-following research.
4. Academic and Quant Research Confirms the Pattern
Multiple studies validate the same expectations:
Zarattini, Barbon & Aziz (2024): ORB strategy on “stocks in play” produced over 1,600 percent return with modest win-rates
Moskowitz, Ooi & Pedersen: Trend-following (a breakout variant) shows positive expectancy across a century of data
Bulkowski: Breakout failure rates increase over time, confirming the need for filters and asymmetry
CTA/Managed Futures: Long-term breakout systems show strong convexity; a few big winners generate the majority of returns
The conclusion is clear:
Breakout strategies work when they harness asymmetry, not prediction.
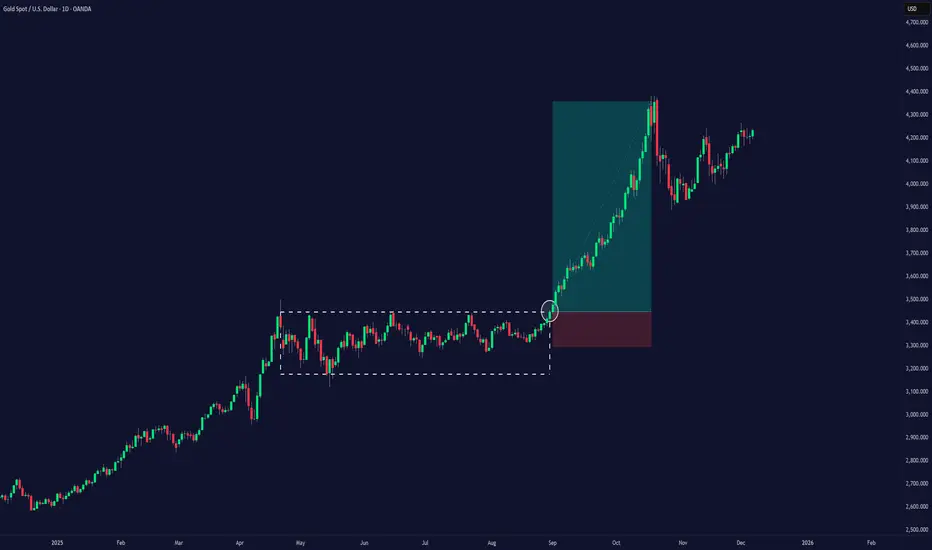
█ Example: Breakout System 1
Win-rate: 20.28%
Breakout System Gain: +274%
Buy & Hold Gain: +96%
Explanation of the chart:
Flat periods → range markets
Dips → false breaks and stop-outs
Explosive steps upward → successful breakouts that trend hard
This step-like equity curve is the fingerprint of all trend-and-breakout systems.
█ Example: Breakout System 2
This system shows the same profile:
Many trades fail, but losses stay small
Occasionally a breakout runs far enough to cover dozens of losses
The equity curve’s “zig-zag then spike” pattern is normal behavior
The system wins big because the winners are massive R-multiples, not because it’s right often
This is the signature of low win-rate, high reward asymmetry.
█ The Real Mechanics Behind a Successful Breakout
A real breakout is powered by multiple forces hitting at once:
New longs entering / new shorts entering (initiative flow)
Stops being triggered (forced participation)
Short covering or long liquidation (fuel)
Algos joining the momentum (acceleration)
Volatility expansion is making moves larger
⚪ Read more about what makes prices move up and down:
█ What Makes Breakout Strategies Hard for Humans
Breakout trading is psychologically painful because:
You lose often
You sit through boring periods
Most trades look like “nothing happens”
Only a few trades create 80–90% of the long-term profits
To succeed, you need:
Patience
Small, consistent risk
The discipline to let winners run
The acceptance that many trades will fail
Breakout success = emotional resilience + asymmetry, not prediction.
█ The Takeaway
Breakout strategies are simple in theory and brutal in practice:
Low win-rate
High reward
Long quiet periods
Occasional massive expansions
Step-like equity curves
Outperformance through asymmetry
In the end:
You don’t trade breakouts to be right often — you trade breakouts to get paid big when the market finally moves.
-----------------
Disclaimer
The content provided in my scripts, indicators, ideas, algorithms, and systems is for educational and informational purposes only. It does not constitute financial advice, investment recommendations, or a solicitation to buy or sell any financial instruments. I will not accept liability for any loss or damage, including without limitation any loss of profit, which may arise directly or indirectly from the use of or reliance on such information.
All investments involve risk, and the past performance of a security, industry, sector, market, financial product, trading strategy, backtest, or individual's trading does not guarantee future results or returns. Investors are fully responsible for any investment decisions they make. Such decisions should be based solely on an evaluation of their financial circumstances, investment objectives, risk tolerance, and liquidity needs.
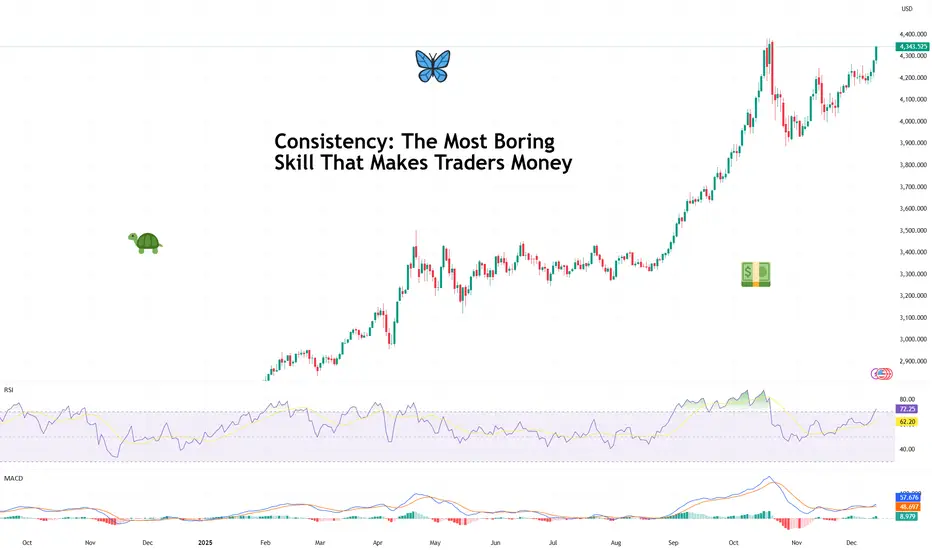
Consistency: The Most Boring Skill That Makes Traders MoneyAsk traders how they made their money and you’ll hear stories about perfect entries, heroic conviction, and that one legendary going-for-the-jugular trade they’ll mention at every dinner party.
What you almost never hear about is consistency — because it’s not glamorous, it doesn’t screenshot well, and it definitely doesn’t come with fireworks.
But consistency is the skill that turns trading from an emotional roller coaster into a durable business. It’s boring. It’s repetitive. And it’s responsible for more profitable careers than any secret indicator ever will.
🧠 Why the Market Rewards the Unexciting
Markets don’t pay you for being clever. They pay you for being repeatable.
Consistency works because markets are probabilistic systems. No single trade matters in the long run. What matters is what happens over time, across dozens or hundreds of decisions. (Good time to look back and see how you did this year.)
The trader who makes reasonable decisions again and again — even without brilliance — will eventually outperform the trader who occasionally nails a perfect call but can’t stop freelancing.
Think of it less like poker and more like compound interest. It doesn’t wow you at first. Then one day, you realize you’ve done pretty darn well.
📊 The Myth of the Big Trade
Every trader remembers their biggest win. And there’s nothing wrong with that. Some big trades can pay for a lot of small mistakes .
Big wins feel validating. They trigger confidence. But they also create dangerous expectations. Traders start chasing that feeling — trading bigger, faster, looser — and consistency quietly exits through the back door.
Professional traders know that a great trade doesn’t prove skill. A series of disciplined trades does.
The market doesn’t care how exciting your best trade was. It cares how well you behaved on the other ninety-nine.
🧮 Consistency Is Math, Not Motivation
Consistent traders don’t wake up feeling like it’s their lucky day.
They operate within a framework that reduces randomness in their decisions. They trade fewer setups, not more. They accept that being flat for the week is a position. They understand that not every day is designed to reward them.
This isn’t about grinding harder. It’s about removing unnecessary choices so execution becomes automatic.
Ironically, the less you try to be exceptional, the more real and reliable your results become.
📉 Losing Is Part of the Job
Consistency shows up most clearly during losing streaks. Anyone can look disciplined after a winning week. The test comes when trades stop working, narratives shift, and the urge to “make it back” creeps in.
Consistent traders don’t panic. They don’t revenge trade . They don’t rewrite their strategy after three red days.
Instead, they understand that drawdowns are not failures — they’re rent paid for staying in the game. The goal isn’t to avoid losses. It’s to keep losses from changing behavior.
🧠 Confidence Comes from Repetition
One of the quiet benefits of consistency is confidence — the real kind. Not the loud, chest-thumping confidence that comes from a hot streak. But the calm assurance that comes from knowing you’ve executed your plan a hundred times before.
That confidence allows traders to stay neutral when others get emotional. To reduce size when conditions change. To wait without feeling left out.
It’s the difference between reacting to the market and responding to it. Regardless if it’s fever-pitch earnings season or the Economic Calendar is jam-packed with events.
🕰️ The Long Game Always Wins
With that in mind, trading careers aren’t built in viral moments. They’re built in years upon years of working on your craft.
The traders who last aren’t necessarily the smartest or fastest. They’re the ones who made it boring enough to sustain it. And eventually, almost accidentally, the process builds itself into something that looks a lot like success.
Off to you : What’s your consistency strategy saying? Is boring beautiful or is risk-taking maxed out in your portfolio? Share your thoughts in the comments!
XAUUSD - SELLER MOVE IN The chart shows my view of the next move. Market direction depends on holding this zone.

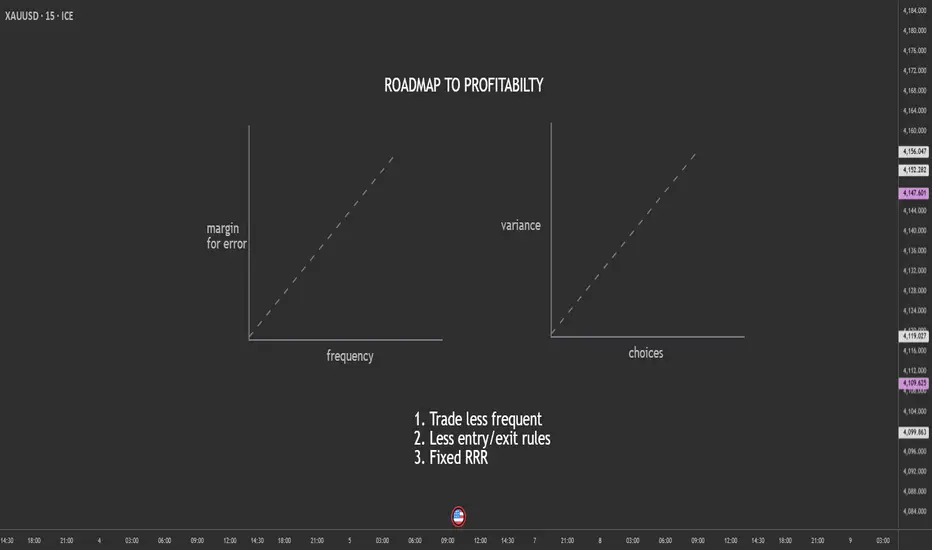
Trade Less, Choose Less, Profit More: The Counterintuitive Edge.Most retail traders believe they need more—more trades, more setups, more indicators, more signals. But in reality, the traders who survive (and thrive) do the opposite. They trade less frequently, reduce the number of decisions, and lock in a fixed risk-to-reward ratio that keeps their edge stable.
Here’s why simplifying your trading increases your chances of long-term profitability.
1. Trading Less Reduces Mistakes
Every trade is a decision.
Every decision carries emotional and cognitive load.
The more trades you take:
the more tired your brain becomes
the more emotional impulses creep in
the more likely you are to overreact to noise
the more commissions/spreads you pay
the more small errors compound into big losses
By reducing trading frequency, you automatically reduce the number of opportunities for mistakes.
Fewer trades → Higher quality → More consistency.
Elite traders don’t take every “okay” trade.
They wait for the A+ setups that align perfectly with their plan.
2. Fewer Choices = Lower Variance in Outcomes
When you have too many signals, too many strategies, or too many timeframes, your decision-making becomes inconsistent. Choice overload raises the variance in outcomes—you might catch a big win today and then give it all back tomorrow on impulsive trades.
Reducing choices tightens your performance curve.
When you:
trade one setup type
focus on one pair or market
use one timeframe
follow one clear trigger
…your results stabilize. The randomness disappears, and your edge becomes measurable.
A stable edge is a profitable edge.
3. A Fixed RRR Protects You From Yourself
Most traders blow accounts not because of strategy, but because of inconsistent risk-to-reward ratios.
Sometimes they take 1:3, sometimes they settle for 1:1, sometimes they hold for 1:6 and give it back. This inconsistency destroys expectancy.
A fixed RRR:
forces discipline
keeps losses small
standardizes wins
makes your edge mathematically trackable
creates predictable long-term performance
Your job is NOT to predict the market.
Your job is to control the asymmetry between risk and reward.
A consistent 1:2 or 1:3 turns even a 40% win rate into profitability.
Final Thought
If you feel stuck, overwhelmed, or inconsistent, don’t add more tools.
Remove them.
The fewer decisions you have to make, the fewer mistakes you make.
The fewer trades you take, the higher your quality becomes.
And the more consistent your RRR, the more likely you are to stay profitable.
In trading, less really is more.
Gold 30-Min — Volume Buy Reversal Triggered⚡Base : Hanzo Trading Alpha Algorithm
The algorithm calculates volatility displacement vs liquidity recovery, identifying where probability meets imbalance.
It trades only where precision, volume, and manipulation intersect —only logic.
✈️ Technical Reasons
/ Direction — LONG / Reversal 4200 Area
☄️Bullish momentum confirmed through strong candle body.
☄️Structure shifted with higher-low near key demand base.
☄️Volume expanding confirms order-flow alignment upward.
☄️Buyers reclaimed imbalance with sustained clean break.
☄️Algorithm detects rising momentum under low liquidity.
⚙️ Hanzo Alpha Trading Protocol
The Alpha Candle defines the day’s real control zone — the first battle of momentum.
From this origin, the Volume Window reveals where the next precision strike begins.
⚙️ Hanzo Volume Window / Map
Window tracked from 10:30 — mapping true market behavior.
POC alignment exposes institutional bias and breakout potential zones.
⚙️ Hanzo Delta Window / Pulse
Delta window monitors real buying vs. selling power behind each move.
Tracks volume aggression to expose who controls the candle — buyers or sellers.
When Delta aligns with Volume Map, momentum becomes undeniable.
