XAU-USD15-minute candlestick
It has a descending trendline that needs to be broken 📣🕯
If that trendline breaks, there's a trading cluster above 4220 that it could hit ✔️
You can place a buy there 🔼🔼
Trade ideas


XAUUSD 3-Month to 1-Year PredictionThe XAU to USD exchange rate is forecasted to increase by 58.20% in the next three years, rising from the current rate of $ 4,208.48 to $ 6,657.85.

XAUUSD | Gold Signal |Dec 8,2025📌 MARKET ASSESSMENT
1. General Context
Gold continues to fluctuate within the medium-term range on the H1 chart with a slight downward correction structure. The price is currently moving between the upper supply zone and the lower support trendline, indicating that the market is waiting for more momentum to break out.
2. Current Trend
The H1 chart maintains an overall uptrend but is in a correction phase.
The supply and demand zones are clearly formed, creating conditions for trading according to the technical reaction zone.
The uptrend trendline plays an important support role and has not been penetrated yet.
3. Important Observation Zone
H1 Supply Zone (Sell Zone): 4225 – 4230
The position of confluence with the recent peak.
If the price approaches and is rejected, it is likely to fall back to the support zones.
Support Zone/Entry Buy: 4167 – 4175
Confluence between the uptrend line + H1 bottom + demand zone.
This is the zone with a high probability of forming a bullish reaction.
4. Trading Scenario
Scenario 1 – Sell at Supply Zone
Entry: 4225 – 4230
SL: Above 4235
TP:
Target 1: 4200
Target 2: H1 Trendline
Scenario 2 – Buy at Support Zone
Entry: 4167 – 4175
SL: Below 4160
TP:
Target 1: 4198 – 4205
Target 2: 4220
5. Conclusion
Gold is approaching important technical zones and is suitable for trading on price reaction instead of chasing the market. Both scenarios are highly plausible given the H1 structure remains intact. Prioritize waiting for the price to touch the supply and support zones to avoid the risk of fluctuations between zones.

Gold Price Outlook – Trade Setup (XAU/USD)📊 Technical Structure
TVC:GOLD Gold continues to trade steadily above the $4,163–$4,147 support zone, holding within a broader consolidation while respecting the mid-term bullish structure. Price has repeatedly rejected the support band, showing that buyers are still defending the lower boundary. On the topside, the $4,251–$4,268 resistance zone remains the key ceiling—this is where sellers have consistently stepped in.
The current 4H structure shows a potential pullback into support before buyers attempt another run toward the resistance zone. As long as gold holds above $4,163, the bullish bias remains intact. A clean break below this level would flip the structure bearish and expose
deeper downside.
🎯 Trade Setup
Idea: Buy from support, targeting a retest of the resistance zone.
Entry: $4,163 – $4,147
Stop Loss: $4,138
Take Profit 1: $4,251
Take Profit 2: $4,268
Risk–Reward Ratio: ≈ 1 : 3.45
Bias stays bullish as long as price holds above the support zone. A 4H close below $4,138 invalidates this upside scenario.
🌐 Macro Background (Simple Version)
Markets broadly expect the Federal Reserve to cut interest rates this Wednesday, with traders pricing in almost a 90% probability of a 25 bps cut. Lower interest rates reduce the opportunity cost of holding gold, so rate-cut expectations naturally support the metal.
At the same time, China continues increasing its gold reserves, marking a 13-month buying streak. This steady central-bank demand adds an extra layer of support beneath gold prices.
U.S. data, such as the stronger-than-expected University of Michigan Consumer Sentiment Index (53.3), briefly lifted the USD, but not enough to offset the broader rate-cut narrative. Overall, the macro tone remains mildly supportive for gold as long as markets believe the Fed will ease policy this week.
🔑 Key Technical Levels
Resistance Zone: $4,251 – $4,268
Support Zone: $4,163 – $4,147
📌 Trade Summary
Gold holds steady above key support as markets wait for the Fed’s decision. With rate-cut expectations high and China continuing to buy gold, dips into support remain attractive for buyers targeting the $4,250–$4,270 zone. The setup stays constructive unless price closes below $4,138.
⚠️ Disclaimer
This analysis is for reference only and does not constitute trading advice. Trading involves significant

$ell XAUUSD*I am in no way a financial advisor and you should always do your own due diligence before placing any trade. Do not trade what you are not comfortable with losing. No trade is guaranteed.
Price weakening on the buy, triple top , price falling, let’s ride the wave.
Conservative tight stop loss for small accounts: 4216
Large stop loss for large accounts: 4236
Take profit: 4005

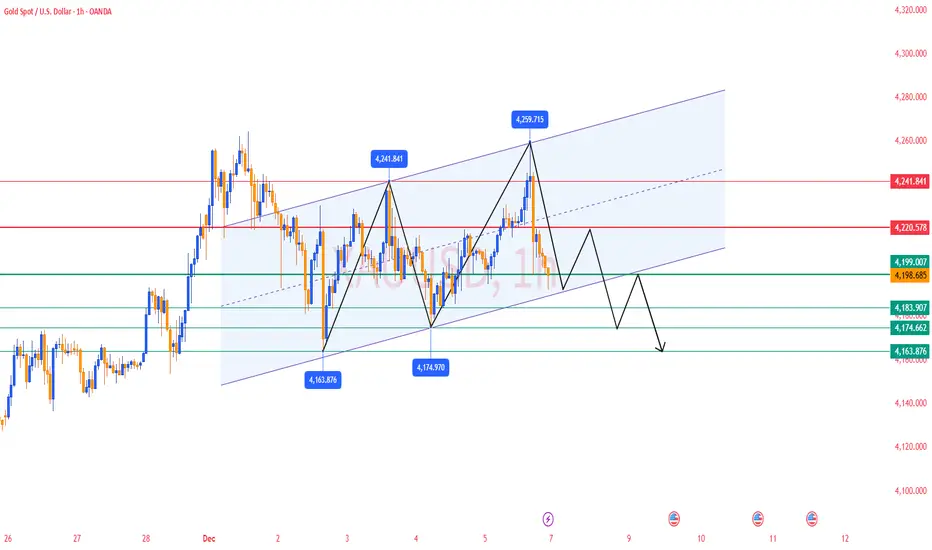
Dec 8, 2025 - XAUUSD GOLD Analysis and Potential Opportunity📊 Summary:
The 4260 resistance proved strong, and the daily close fell back below 4200. This pullback appears to be driven by profit-taking.
If price trades above 4200, bulls still have strength.
But if price breaks below 4192, bearish momentum will increase significantly.
🔍 Key Levels to Watch:
• 4260–4265 – Resistance zone
• 4241 – Resistance
• 4230 – Resistance
• 4220 – Resistance
• 4205 – Resistance
• 4192 – Intraday key support
• 4182 – Support
• 4174 – Support
• 4164 – Support
• 4154 – Support
📈 Intraday Strategy:
SELL: If price breaks below 4192 → target 4286, with further downside toward 4182, 4179, 4174
BUY: If price holds above 4208 → target 4211, with further upside toward 4215, 4220, 4224

XAUUSD_Trend-Based Entry ZoneClear buy reaction zones based on the current trend, with defined stop and target levels.

$XAUUSD FORCAST BULLISH ANALYSIS ( READ CAPTION )hi traders! today 07 DECEMBER 2k25 here is my today XAUUSD analysis please read it and send me your ideas in comment section for more analysis.
OANDA:XAUUSD pivot point is 4199, XAUUSD long channel support holding buyers target 4300.
structured bullish progression after a period of heavy distribution inside the supply zone. Earlier, gold established wide range between the supply and demand areas, with multiple sharp rejection, forming the top of the structure. eventually, sellers pushed the price lowers initiating a corrective declined that developed into a well-defined Triangle Pattern, market by a descending Triangle demand line. This compression ended with a clean breakout to the upside, signaling the beginning of a new bullish phase. Following the breakout, XAUUSD formed a Pivot point near the mind-range level, where price briefly rejected before continuing its upward trajectory. Another notable phase was the formation of an inverse Head-and-Shoulders structure conforming buyers strength after a fake breakout below the neckline this reversal pattern provided the foundation for current bullish continuation.
Please dont forget like and comment for latest XAUUSD updates
This analysis for informational purposes only. Trade is own your risk.

Gold Analysis & Trading Strategy | Next Week Preview✅ Gold fluctuated within a $100 wide range this week, with repeated whipsaws, and finally closed with a doji, indicating ongoing tug-of-war between bulls and bears.
Looking ahead to next week, range trading is expected to continue, and the downward adjustment window may open around mid-December.
→ The primary strategy remains selling the rallies (shorting at highs).
✅ Daily Chart (D1) Trend Analysis
On Friday, gold showed intraday upward movement
Topped near 4259 and then pulled back to the starting point
Daily candle closed as another doji
➡️ Lack of bullish continuation → Upward momentum is still weak
✅ 1-Hour Chart (H1) Structure
Moving averages are crossing back and forth
→ No one-sided momentum, price remains range-bound
Upside still capped below 4265
Support remains focused around 4160
📍 If price pulls back to 4160 and holds → Short-term buying opportunity
📍 If 4160 breaks → Gold may open further downside potential
🔴Resistance Levels
4220–4230 → Short-term rejection zone
🟢Support Levels
4174–4170 → Key support area
4160–4165 → Bull/Bear boundary
✅ Trading Strategy Suggestion
Short-term Focus: Sell the highs as the main strategy, buy the dips as secondary
🔰Look for light short entries around 4220–4230
🔰Look for light long opportunities only if 4160–4165 holds well
⚠️ Risk Reminder
Market remains in a washout consolidation phase
Rapid shifts in sentiment may occur
✔ Use light position sizing
✔ Apply strict stop-loss
✔ Adjust based on real-time price action
Gold Out Look For Week of 12/7 - 12/13/25Gold Closed Bearish Daily Time Frame Friday 12/5/25
Gold Broke Through 3 Key Lvls and is Now Below 4200
I Think Based On PA Price might want to play out 4200 as S. T. R.
Support Turned Resistance
Maybe Come Back and Setup Buys at 4185 support zone or at 4175 qrt. key lvl

Gold Weekly Summary and Forecast 12/6/2025Gold has closed with another 2W candle with a bullish green bar. I am still expecting it to rise for the next two weeks. Buying is still my main strategy.
For next week, I will expect price to test 4152 and rise from there. Ultimate target will be 4400.

XAUUSD- GOLD FORMING "W" PATTERN KEY (READ CAPTION)Hello trader's what do you think about gold
Gold (XAUUSD) is currently forming a clear W Pattern / Double Bottom structure, which is a strong indication of a potential bullish reversal in the market.
Support Levels
Support 1: 4180 — A strong reaction zone where buyers have previously held the market multiple times.
Support 2: 4293 — A higher support zone that can act as a continuation level if price respects it on a pullback.
Market Outlook
The price action is showing a clean W pattern, suggesting that if the neckline breaks, we can expect a strong bullish move.
If price retraces downward, both 4180 and 4293 serve as ideal buy zones for buyers preparing for the next bullish leg.
Technical Summary
W Pattern → Potential bullish reversal
4180 → Deep correction support
4293 → Continuation support
please don't forget to like comment and follow

Gold further downside next weekGold price had closed below 5 day moving average for the past 3 days, this would be a sign for further downside. This is also the third time the gold price is unable to break above 4250 area.
There should be further attempts to try to break above, in the mean time, momentary retracement should be on the cards next week.
This retracement might be to gather further strength to break to the upside later.
Trading strategy -> continue to buy on dip, control small lot size.

XAU/USD Bullish trend analysis Read The captionSMC Trading point update
Technical analysis of XAUUSD (Gold) – Bullish Reversal Expectation
Timeframe: 1H
Current Price: ~ 4189
Indicators:
50 EMA (blue) above price → short-term bearish momentum recently
200 EMA (black) touched → strong long-term support
Key Support Zone: 4160 – 4170 area successfully held
Market Structure Insight
Price bounced strongly from the major support zone where liquidity was grabbed below previous lows.
Rejection candle off the 200 EMA + support region indicates buyers stepped in aggressively.
Expected scenario: Market may form a higher low → start bullish continuation.
---
Bullish Forecast Path
The sketched projection shows:
1. Pullback and retest near 50 EMA (4210 zone)
2. Break of structure highs
3. Continuation to targets
Target Levels
Level Purpose
4264 First take profit / previous structure top
4300 Final target / strong resistance
---
Key Confirmation Required
For the bullish plan to stay valid:
Price must hold above 4160 zone
Break and close above 4208–4215 for continuation strength
---
Trade Idea Concept
> Buy from support zone retest or break above 4210
SL: below 4155
TP1: 4264
TP2: 4300
Mr SMC Trading point
---
Overall Idea Summary
Strong bullish rejection from key support
Liquidity sweep + EMA confluence
High potential for reversal continuation
---
Please support boost 🚀 this analysis

XAUUSD: Buy on Pullback Near 4300Gold’s performance today is just as strong as yesterday’s, breaking through 4340 and still showing upside potential on the 4H chart. Although the momentum has slowed, both the daily and 4H trends remain bullish, indicating that after a pullback, the price is likely to continue rising. Fortunately, the short position I placed near 4276 yesterday was closed this morning; otherwise, this upward move would have nearly erased yesterday’s profits. I did not manage to capture this rally, which is somewhat regrettable, but not overly so.
At the current levels, I am hesitant to chase the upside. Despite the medium-term trend remaining bullish, I cannot be certain that the short-term move will extend further. Therefore, I plan to start building short positions again and will consider buying only when prices revisit the 4300 area.

Gold Bullish breakout supported at 4254The Gold remains in a bullish trend, with recent price action showing signs of a breakout within the broader uptrend.
Support Zone: 4254 – a key level from previous consolidation. Price is currently testing or approaching this level.
A bullish rebound from 4254 would confirm ongoing upside momentum, with potential targets at:
4354 – initial resistance
4380 – psychological and structural level
4403 – extended resistance on the longer-term chart
Bearish Scenario:
A confirmed break and daily close below 4254 would weaken the bullish outlook and suggest deeper downside risk toward:
4230 – minor support
4209 – stronger support and potential demand zone
Outlook:
Bullish bias remains intact while the Gold holds above 4254. A sustained break below this level could shift momentum to the downside in the short term.
This communication is for informational purposes only and should not be viewed as any form of recommendation as to a particular course of action or as investment advice. It is not intended as an offer or solicitation for the purchase or sale of any financial instrument or as an official confirmation of any transaction. Opinions, estimates and assumptions expressed herein are made as of the date of this communication and are subject to change without notice. This communication has been prepared based upon information, including market prices, data and other information, believed to be reliable; however, Trade Nation does not warrant its completeness or accuracy. All market prices and market data contained in or attached to this communication are indicative and subject to change without notice.

Bullish Momentum Builds — XAUUSD Aims for 4300Gold (XAUUSD) is showing bullish momentum, and a potential long opportunity is forming above the 4200 support zone. A buy entry from 4194 aligns with the current uptrend structure, while downside protection is placed at SL: 4160 to safeguard against volatility.
If bullish pressure continues, price could aim for the next major resistance, making 4300 a realistic upside target. This setup favors buyers as long as gold holds above the 4200 zone and continues forming higher lows
Key Levels
Entry 4194
Target 4300
Stop Loss 4160

XAU/USD Technical Analysis: Breakout & Bullish Target Senario📈 XAU/USD (Gold) 30M Technical Analysis: Breakout & Two Key Scenarios
📌 Summary of Current Setup
The XAU/USD pair has recently shown a clear break to the upside out of a well-defined short-term consolidation pattern, suggesting a bullish shift in immediate momentum. The price is currently resting right at the top of a crucial short-term resistance level, which is being tested by a high-momentum candlestick.
📝 Detailed Analysis
1. Consolidation Breakout
Previous Pattern: The chart highlights a period of sideways movement within a downward-sloping channel (or bullish flag/pennant in a larger context, though locally defined as a channel). This channel, visible from the late hours of the previous day into the current day's trading, represented a period of accumulation/distribution.
The Break: Price has successfully broken above the upper boundary of this consolidation channel/zone around the 4,275 - 4,280 area. This breakout is a significant bullish signal, indicating that buyers have overpowered sellers at this stage.
2. Key Price Levels & Zones
Current Price Action: The price is trading right around 4,288.49 (Ask), positioned above the previous structure.
Mixed IFC Candle: The chart points to a "Mixed IFC Candle" (likely referring to an Institutional Flow Candle or a candle indicating indecision after a move). This candle, placed near 4,290.00, suggests a momentary pause or a minor struggle at the immediate resistance before the potential move higher.
Central Zone (Resistance/Target 1): The first major resistance area, marked as the "Central Zone," is identified roughly between 4,303.00 and 4,308.00. This zone is crucial as a near-term target for buyers and a potential turning point for a bearish reversal if the rally loses steam.
Target (Target 2): The ultimate bullish target for this specific setup is clearly marked around 4,335.00.
🔭 Two Potential Scenarios (Conditions)
The analysis correctly outlines two primary paths based on how the price interacts with the immediate resistance near 4,290.00 and the Central Zone.
Scenario 1: Bullish Continuation (Condition 1 - Preferred Path)
Trigger: Price manages to close decisively above the Central Zone (4,308.00) or successfully tests the immediate support/retest zone and pushes through the Central Zone without a deep pullback.
Action: This confirms strong bullish momentum and targets the ultimate price objective.
Target: 4,335.00 (Potential extension towards 4,340.00)
Invalidation: A decisive break and close below the recent breakout level (around 4,275.00).
Scenario 2: Short-Term Pullback/Retracement (Condition 2)
Trigger: The price rejects the immediate resistance near 4,290.00 or, more likely, rejects the Central Zone (4,303.00 - 4,308.00).
Action: A pullback towards the recently broken consolidation channel's upper boundary for a retest of support (the breakout level) is expected.
Retest Zone: A likely retest area would be near 4,275.00 - 4,280.00. A successful defense of this retest zone would re-establish Scenario 1.
Risk: If the retest fails and price drops back into the consolidation channel, the bullish bias is temporarily negated, and the pair may revisit the lower end of the previous range.
💡 Trader's Mindset & Strategy
Entry Strategy: Look for entries on a successful breakout above the Central Zone (4,308.00) or, more conservatively, look for a confirmation of support holding during the anticipated retest (Scenario 2) near 4,275.00.
Risk Management: A stop-loss should be placed logically below the established breakout level (e.g., below 4,270.00) to protect against a false breakout.
Profit Taking: Partial profits can be taken at the Central Zone (4,303.00 - 4,308.00), with the remainder targeting 4,335.00.

XAU $4300 wowCongratulations if you made the play into here 💯 (sub 192)
Enjoy your weekend…
Merry Xmas…
Love all. $4230 on the cards for shorts..
Lasssgooo!!!! 🏦

A clear swing set yet to unfold Through hindsight I see a most probable chance of a new all time high on Xau and the sources I have too confirm them with fundamentals .

Gold Stalls Near 4,200 USD Ahead of the Fed MeetingGold is entering a sensitive phase as technical structure signals strong compression, while macro news continues to create a wait-and-see sentiment ahead of the upcoming Fed meeting.
From a technical perspective, the Volume Profile paints a very clear picture: the 4,220 USD area is a major resistance, as this is where heavy volume accumulated — a zone where sellers previously appeared in force and continue to exert pressure. In contrast, the 4,180 and 4,200 USD zones act as key support levels, with trading activity showing that buyers are still fairly active there. At the same time, the Fair Value Gaps around these price levels remain unfilled, providing a technical cushion for potential retests before a new trend forms.
Given the current context, the most realistic short-term scenario is continued consolidation around 4,200 USD, with 4,220 acting as an upper “firewall” and 4,180 serving as a reliable floor. In the broader outlook, if the Fed confirms a rate-cut cycle, the 4,280–4,300 target range is well within reach. Conversely, a more hawkish tone could trigger a pullback before gold resumes its larger bullish trend.

