XAUUSD Intraday Plan | Gold Holds Range Ahead of FOMCGold remains range-bound between 4219 and 4185, showing no clear commitment from buyers or sellers. A decisive breakout on either side will be needed to define the next intraday direction.
A break above 4219 would open the path toward 4251, and with strong momentum, potentially 4285.
However, if 4185 fails, price may drift back into the Support Zone. Should selling pressure increase, the HTF Support Zone may come into play as the next major area for buyers to respond.
📌Key levels to watch:
Resistance:
4219
4251
4285
Support:
4185
4144
4102
4049
4014
🔎Fundamental focus:
All eyes are on today’s FOMC decision — the key catalyst markets have been waiting for. Expect heightened volatility as traders react to the rate statement, projections, and Powell’s remarks.
Trade ideas

XAUUSDPrice Action Trading is a method of financial market analysis where traders make buying and selling decisions solely based on the asset's price movements over time, without relying on technical indicators.
It's essentially the art of reading a "naked" or clean chart to understand the psychology and behavior of market participants.

Gold continues to consolidate; continue to buy on dips.Gold continues to consolidate; continue to buy on dips.
As shown in the 2-hour chart:
Gold prices are heading towards $4220 per ounce, showing signs of weakening upward momentum.
Today's Asian and European trading sessions will focus on testing the resistance level near $4220 per ounce.
Last night, we went long near $4195 per ounce, profiting nearly 20 points.
I believe that gold prices are likely to fluctuate between $4200 and $4250 per ounce before the Fed finally confirms a rate cut.
I share high-quality free trading signals daily on my channel, with a win rate exceeding 85%. Thank you for your attention. I will do my best to help every trader develop correct trading habits and reduce unnecessary losses.
Current Technical Analysis:
Current Resistance: $4220
Current Support: $4190
Macro Trading Range: $4170 - $4260
First, we need to clarify two points:
1: Gold prices fell on Monday, but formed a valid head and shoulders bottom pattern on Tuesday.
2. Gold prices experienced a false breakout last Friday. Summary: Gold prices have not yet broken out of the current range, and there is no clear trend guiding their movement.
Currently, we categorize it as: sideways consolidation.
Trading Range: $4170 - $4260
Our trading strategy today is very clear:
1: Wait for the price to fall before going long.
2: Set the final stop-loss at $4170, and the intermediate stop-loss at $4190.
Entry Price: $4200-$4210
Stop-Loss Price: $4190/$4170
Take-Profit Price: $4235-$4250
I know many people in the group are eagerly awaiting my updates. But my advice is: please don't view market changes from a static perspective.
Market conditions change rapidly, and rhythms and patterns are constantly evolving. We need to develop corresponding strategies for each stage.
I share and analyze my trading philosophy daily on my channel. You may not be able to keep up with my pace, but once you understand my trading data and habits, you will definitely follow my channel for a long time.

XAUUSD (2H) – Structure, Liquidity & Key Zones | SMC BreakdownMarket Structure:
XAUUSD remains in a short-term bearish structure, with repeated BOS and CHoCH points confirming controlled downside. Recent candles show consistent displacement favoring sellers.
Liquidity Grab:
Price has just taken sell-side liquidity beneath the previous swing lows. This sweep pushes the market into a discount region, a typical reaction for smart-money rebalancing.
Key Demand Zone (Reaction Area):
Price is currently testing the 4,153 – 4,182 demand zone, characterized by:
Prior accumulation block
Imbalance fill
Multiple wick rejections signaling buyer sensitivity
How price reacts here will determine the next structural leg.
Upside Imbalances & Supply Zones:
If bullish confirmation forms inside this demand, the next logical price objectives are:
4,210 – 4,230 intraday supply
4,250 – 4,260 higher-timeframe supply
These zones hold unmitigated inefficiencies from previous impulsive moves.
Outlook (Neutral / Analytical):
Although the short-term trend remains bearish, the price is positioned inside a high-value discount zone where reversals often originate. A confirmed CHoCH upward would indicate potential mitigation.
Failure of this zone, however, may lead to continued bearish expansion.

XAU / USD 1 Hour ChartHello traders. So, the last 30 minute candle, the red one, was what I just traded. I sold from the red line, caught about 40 pips or so and closed out just that fast. I am waiting for Pre NY volume to start in 50 minutes from this post. Let's see how things play out. All that is happening right now is gold is just taking out existing long and short trades. I am waiting for a bit. I felt the trade I took was risky, despite me catching a few pips. I used a micro lot, to minimize loss in case it did not go my way. Big G gets a shout out. Be well and trade the trend.

Gold Weekly Summary and Forecast 12/6/2025Gold has closed with another 2W candle with a bullish green bar. I am still expecting it to rise for the next two weeks. Buying is still my main strategy.
For next week, I will expect price to test 4152 and rise from there. Ultimate target will be 4400.

DID THE MARKET RANGEMarket Found WEEKLY High and Low Early in the week.
Buy Setups All Week
Friday Buys Led To Friday Sells
Price Came Back To Weekly Highs and Sold Off.
Followed A Bearish Structure Fib Setup At 95% Zone

Bullish trend gold its still bullish . its consolidation 4190-4200
Next step is 4300-4380 before cut rates .

The Impact of Corporations on Global Trade1. Corporations as Engines of Trade Expansion
Corporations, especially MNCs, are central to the expansion of global trade. These organizations operate in multiple countries, producing and selling goods and services on a scale that often surpasses the capacity of national economies. By establishing subsidiaries and joint ventures in foreign markets, corporations increase trade flows both in imports and exports. For instance, a technology company headquartered in the United States may source components from Japan, manufacture products in China, and sell them across Europe, effectively linking multiple economies through a single corporate network. This activity not only boosts trade volumes but also diversifies market opportunities for smaller businesses that supply inputs to these corporations.
2. Supply Chain Integration and Global Value Chains
A critical way in which corporations impact global trade is through the development of global supply chains and value chains. Modern production processes are fragmented across nations, allowing corporations to optimize costs, access specialized skills, and leverage comparative advantages. For example, automotive companies often design vehicles in Europe, manufacture engines in Germany, assemble components in Mexico, and distribute finished products worldwide. These intricate supply chains have led to the emergence of Global Value Chains (GVCs), where value is added in different stages across multiple countries. This fragmentation increases cross-border trade in intermediate goods and services, significantly expanding global trade volumes.
3. Technology Transfer and Knowledge Dissemination
Corporations are key conduits of technology and knowledge transfer across borders. When a corporation invests in a foreign country, it often brings advanced production techniques, management practices, and innovation capabilities. This transfer of technology boosts the productivity and competitiveness of the host country, indirectly influencing trade by enhancing export potential. For example, foreign direct investment (FDI) by high-tech corporations in developing economies can enable local firms to adopt modern technologies, facilitating the production of export-quality goods and services. Consequently, corporations not only trade goods but also foster skill development and technological upgrading globally.
4. Market Creation and Consumer Demand Expansion
Corporations also shape global trade by creating new markets and stimulating consumer demand. Through strategic marketing, product localization, and brand recognition, corporations expand the reach of their products to international markets. This expansion often encourages other domestic and international suppliers to enter these markets, increasing trade activity. For instance, the entry of multinational consumer goods companies into emerging economies often introduces a range of new products and stimulates imports of raw materials, packaging, and equipment. This effect extends beyond mere consumption—it establishes long-term trade relationships between suppliers and corporate buyers worldwide.
5. Influence on Trade Policy and International Regulations
Large corporations often influence global trade policies and regulations. Through lobbying, strategic partnerships, and participation in international organizations, corporations can affect trade agreements, tariffs, and standards. For example, tech giants may lobby for reduced tariffs on electronic goods or for harmonized digital standards, thereby facilitating smoother cross-border trade. Their influence can also shape regulatory frameworks regarding intellectual property, environmental standards, and labor practices, which in turn affect how trade flows are structured globally. While this can accelerate trade liberalization, it may also create challenges for smaller firms that cannot navigate complex regulatory environments.
6. Economic Impact and Market Competition
Corporations’ impact on global trade extends to economic growth and market competition. By expanding into new markets, corporations generate employment, contribute to tax revenues, and foster industrial development. Increased competition from multinational entrants can encourage local firms to innovate and improve efficiency, raising the overall competitiveness of industries in different countries. However, this dominance can also concentrate market power, leading to monopolistic practices that may distort trade and limit benefits for smaller players. The balance between stimulating trade and maintaining fair competition is a critical aspect of corporate influence on the global economy.
7. Challenges and Criticisms
Despite their positive contributions, corporations’ role in global trade is not without criticism. Critics argue that MNCs can exacerbate economic inequality by extracting resources from developing nations without sufficient local reinvestment. They may exploit labor and environmental regulations to minimize costs, leading to social and ecological consequences. Additionally, the dominance of a few large corporations in key sectors, such as technology or pharmaceuticals, can limit market access for smaller firms and distort trade dynamics. Trade imbalances may also arise if corporations disproportionately favor production in low-cost countries while concentrating profits in high-income regions. Addressing these challenges requires international cooperation, responsible corporate governance, and equitable trade policies.
8. Future Trends and Evolving Corporate Roles
The role of corporations in global trade is evolving in response to technological innovation, geopolitical shifts, and sustainability concerns. The rise of digital platforms and e-commerce enables even small and medium-sized enterprises (SMEs) to engage in cross-border trade, challenging the traditional dominance of large corporations. Sustainability initiatives are pushing corporations to consider environmental and social factors in supply chains, potentially reshaping trade patterns toward greener practices. Moreover, geopolitical tensions, trade wars, and regional trade agreements are influencing corporate decisions on production locations and supply chain management, reflecting a more complex and strategic approach to global trade.
Conclusion
Corporations, particularly multinational ones, are fundamental drivers of global trade. They expand markets, integrate supply chains, transfer technology, and shape consumer demand, all of which amplify international trade flows. At the same time, they wield significant influence over trade policies and economic structures, generating both opportunities and challenges for global markets. While their operations contribute to economic growth and innovation, they also raise concerns regarding inequality, environmental impact, and market concentration. Understanding the multifaceted impact of corporations on global trade is essential for policymakers, businesses, and international organizations seeking to foster equitable, sustainable, and efficient trade systems. As global commerce continues to evolve, the role of corporations will remain central, shaping not only the movement of goods and services but also the broader economic landscape of the 21st century.

Gold further downside next weekGold price had closed below 5 day moving average for the past 3 days, this would be a sign for further downside. This is also the third time the gold price is unable to break above 4250 area.
There should be further attempts to try to break above, in the mean time, momentary retracement should be on the cards next week.
This retracement might be to gather further strength to break to the upside later.
Trading strategy -> continue to buy on dip, control small lot size.

XAU/USD Bullish trend analysis Read The captionSMC Trading point update
Technical analysis of XAUUSD (Gold) – Bullish Reversal Expectation
Timeframe: 1H
Current Price: ~ 4189
Indicators:
50 EMA (blue) above price → short-term bearish momentum recently
200 EMA (black) touched → strong long-term support
Key Support Zone: 4160 – 4170 area successfully held
Market Structure Insight
Price bounced strongly from the major support zone where liquidity was grabbed below previous lows.
Rejection candle off the 200 EMA + support region indicates buyers stepped in aggressively.
Expected scenario: Market may form a higher low → start bullish continuation.
---
Bullish Forecast Path
The sketched projection shows:
1. Pullback and retest near 50 EMA (4210 zone)
2. Break of structure highs
3. Continuation to targets
Target Levels
Level Purpose
4264 First take profit / previous structure top
4300 Final target / strong resistance
---
Key Confirmation Required
For the bullish plan to stay valid:
Price must hold above 4160 zone
Break and close above 4208–4215 for continuation strength
---
Trade Idea Concept
> Buy from support zone retest or break above 4210
SL: below 4155
TP1: 4264
TP2: 4300
Mr SMC Trading point
---
Overall Idea Summary
Strong bullish rejection from key support
Liquidity sweep + EMA confluence
High potential for reversal continuation
---
Please support boost 🚀 this analysis

$XAUUSD BULLISH ANALYSIS ( READ CAPTION)Hi traders ! Today is 04 December 2k25 here is my analysis chart please read it and send me your ideas about this chart in comment section.
OANDA:XAUUSD running around with pivot point $4190 and market not make a bearish trend in any H1 or H4 candle and it is breakout bearish trend. market pull up bullish again and again, If market break 4200 and H1 candle close above the 4200 then market never comeback down side.
The bullish trend is intact, with potential for further gains 4200, 4210,and 4220. A break above rejection point 4206 could strong signal continued bullish momentum.
Bullish Scenario:
Target 1: ($4200)
Target 2: ($4210)
Target 3: ($4220)
Rejection point:($4206)
Support : ($4180) Key level to hold
please dont forget like and comment for more latest updates
this analysis for informational purposes only. trade is own your risk

XAUUSD: A new rise is possible after the pullbackXAUUSD has climbed strongly along a steep uptrend, and based on what I’m seeing on the chart, I expect the price to continue pushing toward the 4,265 area.
This zone could become a decision point where the price either finds support and bounces higher or breaks below and allows the move to extend deeper.
If I had to choose a direction right now, I’d lean toward more upside. But price action will always decide what comes next because the chart always speaks last.
When the price breaks below the trendline with real conviction, the bullish scenario loses validity. That could signal a pause in the uptrend or even a short-term reversal.
This is not financial advice, only my personal thoughts based on what I see on the chart.

XAUUSD M15 BULLISH SETUP Buy Setup (If 4210 Acts as Support) Buy Entry: 4205 – 4210 Stop Loss: 4195 Targets: TP1: 4220 TP2: 4235 Final TP: 4250

Gold in extended bullish Gold is anti fall commedity seriously speaking not a joke !
Well, currently we formed a newly bullish cycle targeting 4444 . 4500 $
Best places to buy : 4175 . 4150 . 4124
Invalidation and reassesment only if daily close below 4100$

Elite | XAUUSD 15m – Bullish Continuation SetupOANDA:XAUUSD
After sweeping liquidity beneath major support, the market broke downward structure and initiated a bullish correction phase. The breakout above internal range highs and the descending trendline confirms a bullish shift, supported by strong demand rejections. Price is now trading above reclaimed structure and targeting the upper liquidity zone toward $4,256 – $4,260.
Key Scenarios
✅ Bullish Case 🚀
Hold above the re-test demand zone:
🎯 Target 1: $4,230
🎯 Target 2: $4,256 – $4,260 (final liquidity objective)
❌ Bearish Case 📉
Only active if price breaks and closes below $4,210
🎯 Downside Target: $4,170 (previous accumulation level)
Current Levels to Watch
Resistance 🔴: $4,230 / $4,260
Support 🟢: $4,218 / $4,170 / $4,150
⚠️ Disclaimer: This analysis is for educational purposes only. It is not financial advice.

XAUUSD ON TRENDLINE 4194XAUUSD ON TRENDLINE 4194
H1 timeframe gold running in trendline now gold on trendline support
if gold taking same trendline then our target 4228 4254
if break of trendline then gold will bearish
This is not financial advice , Chart is for Educational analysis only

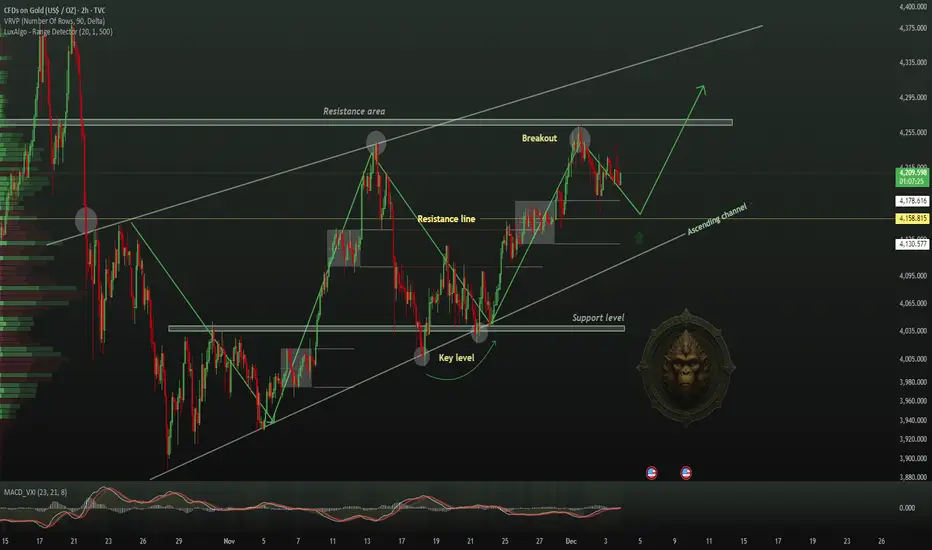
Gold Breakout Confirmed — New Cycle Targets Ahead(ATH Possible)Today, I analyze Gold( OANDA:XAUUSD ) on the 4-hour timeframe, building on the previous idea shared. The scenario remains unchanged.
In this analysis, I take a cyclical approach to gold on the 4-hour chart. It appears that gold is completing three similar cycles. For the third cycle to be completed, gold needs to increase.
Another point is that gold previously formed a bull trap when it tested the Resistance zone/Support zone($4,186– $4,133), but now it has successfully confirmed a breakout above that zone. This suggests that the bull trap is no longer a concern, and gold is likely resuming its uptrend.
Additionally, gold could form a bullish channel, but we currently have only one confirmed top and are waiting for a second top to validate the channel.
Moreover, today we’ll see the release of two important U.S. economic indicators, which can significantly impact gold’s movement, especially if the actual figures deviate significantly from expectations:
ADP Non-Farm Employment Change
ISM Services PMI
Considering all of the above, we can set an initial target of around $4,267 for gold. If the cycle completes fully, gold might even reach a Potential Reversal Zone(PRZ) and possibly set a new All-Time High(ATH).
Finally, geopolitical tensions, like those between the U.S. and Venezuela, often lead to higher gold prices since gold is considered a safe haven.
First Target: $4,267
Second Target: Potential Reversal Zone(PRZ)
Stop Loss(SL): $4,147
💡 Please respect each other's opinions and express agreement or disagreement politely.
📌 Gold Analyze (XAUUSD), 4-hour time frame.
🛑 Always set a Stop Loss(SL) for every position you open.
✅ This is just my idea; I’d love to see your thoughts too!
🔥 If you find it helpful, please BOOST this post and share it with your friends.

XAU / USD 1 Hour ChartHello traders. Happy Friday. Taking a look at the one hour chart. We have finally broken out of my no trade zone. Saying that, if this current retest is valid, I will take a small buy scalp position. I use the same formula. Once I am 30 pips or so in profit, I close 75% of the trade's profit, I move my stop loss to my entry point (break even, no loss) and I leave the runner (the remaining 25% of the trade) running. Let's see how things play out over the next hour or so. Big G gets a shout out. Be well and trade the trend.

XAUUSD Analysis todayHello traders, this is a complete multiple timeframe analysis of this pair. We see could find significant trading opportunities as per analysis upon price action confirmation we may take this trade. Smash the like button if you find value in this analysis and drop a comment if you have any questions or let me know which pair to cover in my next analysis.

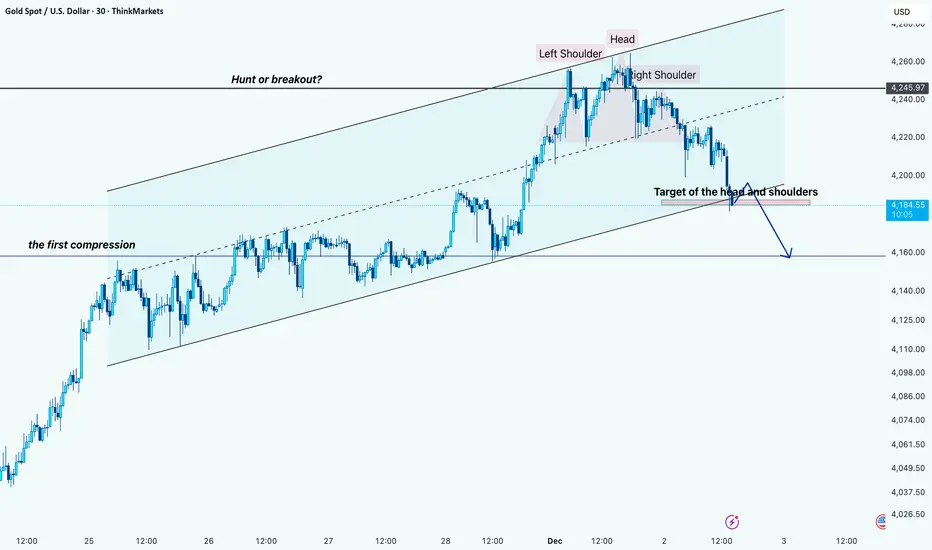
Gold Reversal in Motion: Head & Shoulders Breakdown Hi!
Market Structure
Gold has been moving inside a clean ascending channel, with price respecting both upper and lower boundaries for several days. Earlier in the trend, we saw the first compression phase along the dashed mid-line, which later fueled the strong push toward the channel top.
Liquidity Zone – Hunt or Breakout?
At the channel’s upper boundary, price tapped a key horizontal level. The spike above it looks more like a liquidity hunt than a real breakout—buyers were trapped, and the market quickly rejected from this zone.
Reversal Pattern – Head & Shoulders
After the rejection, a clear Head and Shoulders pattern formed exactly at the top of the channel
The neckline was positioned just above the dashed trendline. Once the neckline broke, momentum shifted sharply bearish, confirming the pattern.
Target & Expected Path
The chart shows the target of the Head and Shoulders, aligned perfectly with the lower boundary of the ascending channel. This creates a strong confluence around the 4,160 area.
The projected move suggests a possible minor pullback or neckline retest before continuing downward.
Overall, the chart signals a short-term trend reversal within a long-term bullish channel, driven by liquidity sweep behavior and a confirmed Head & Shoulders breakdown.
Disclaimer: As part of ThinkMarkets’ Influencer Program, I am sponsored to share and publish their charts in my analysis.
GOLD BUY | Idea Trading AnalysisGOLD is moving in an ascending channel and creating symmetrical triangle and is moving in a descending AND is moving in an UPWARD channel.
We expect a decline in the channel after testing the current level.
Hello Traders, here is the full analysis.
I think we can soon see more fall from this range! GOOD LUCK! Great BUY opportunity GOLD
I still did my best and this is the most likely count for me at the moment.
-------------------
Traders, if you liked this idea or if you have your own opinion about it, write in the comments. I will be glad
Gold price analysis May 12Gold continues to maintain an impressive upward momentum in today's session, showing that the bulls are still in control of the market and the immediate target is heading straight towards the 429x resistance zone in the US session. At the moment, BUY setups continue to be the main strategy, as long as the bullish structure is not broken.
Trading plan:
BUY Now: 4220
Buy Trigger: When a price rejection signal appears at the support zones 4170 - 4195 - 4115
Target: 4290
Risk: The trend will weaken if the H4 candle closes below the trendline at 4170. If this happens, it is necessary to pay special attention to the next large trendline zone around 4115.
The trend is still favorable for the buyers, so prioritize BUY entry points until the bullish structure is clearly broken.
