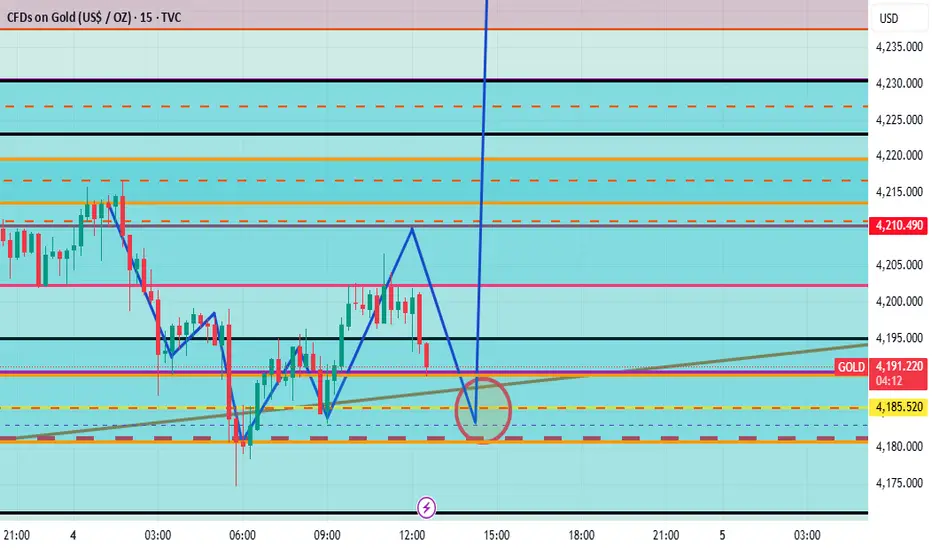
GOLD – MARKET OUTLOOK | Watching 4208 for DirectionGOLD – Technical Overview
Gold is approaching the 4187 support level, and a break below this zone would open the way toward the next supports at 4169 and 4151.
From 4151, a bullish rebound is likely as this level represents a strong demand zone.
On the upside, a 1H close above 4208 would shift momentum back to bullish, targeting 4226 → 4233, and a breakout above this area may extend the move toward 4255.
Key Levels
Pivot Line: 4208
Support: 4187 · 4172 · 4151
Resistance: 4226 · 4233 · 4255
Trade ideas

A BUY AND HOLD A buy at 4185-80 sl at 4170,
buyers gaining momentum to push up price because market already obeyed yesterday sell setup
Gold still holding a bullish momentum Gold has refuse to break below 4163 it tried yesterday and the early hour of today but it still holding strong i expect Gold to rally back up to 4240 or higher but base on Fundamental please apply some risk management in place ...let watch and see and please comment what you think on gold direction .
Thanks

Update on XAU Swing trade adjust the correction for wave 3. if buyers return to the demand zone.
as is the sell position

Report 4/12/25Report summary
Global markets are rotating around a single macro hub: Japan. Super-long JGB yields keep pressing higher as the Bank of Japan signals it will “thoroughly discuss” another rate increase at the Dec. 18–19 meeting; 30-year JGBs hit fresh records and 10-year JGBs are referenced near ~1.9%, while the 10-year U.S. Treasury closed about 4.09% earlier in the week. A BOJ that tightens sooner forces a partial un-wind of yen carry, softens the broad dollar, and supports duration and gold. Into today’s close the WSJ Dollar Index is lower on the week (around 96.4–96.8), U.S. equities are firmer, spot gold is near record territory, and oil stays heavy.
Market reactions
The risk complex leaned risk-on even as rates volatility remained elevated. The S&P 500 and Dow added to recent gains (S&P ~6,829–6,849; Dow ~47,474–47,883), while the WSJ Dollar Index slipped (≈96.39–96.82), reflecting yen and euro strength at the margin. Gold futures settled around $4,215–$4,273/oz, maintaining a powerful up-trend. WTI January futures remain under pressure near the high-$50s per barrel (~$58.6), underscoring the demand/discipline standoff in energy.
Japan remains the global swing factor. Tokyo core CPI is running at 2.8% y/y, and BOJ guidance has pulled forward market expectations for another hike. That has driven super-long JGB yields to multi-decade highs and nudged U.S. 10-year yields back above 4%. The key transmission is via reduced appetite for foreign duration by Japanese lifers/pensions and the prospect of a gradual carry-trade un-wind.
Strategic forecasts (1–3 months)
Baseline. A “firm-but-not-frantic” BOJ path and fading U.S. recession odds keep global growth on a modest expansion track. With BOJ normalization proceeding and the Treasury term premium contained, the dollar’s broad trend tilts lower; risk assets oscillate but avoid a disorderly de-risk. In this base case, S&P 500 makes incremental highs on breadth improvement while gold consolidates above the $4,000 handle as real rates top out. WTI stabilizes in a $55–65 range absent new supply shocks.
Upside scenario. If BOJ proceeds cautiously and U.S. data moderate without cracking, the dollar leg lower extends and equities rerate further; Dow leadership broadens beyond mega-cap tech, and gold grinds higher on central-bank demand and currency diversification flows.
Downside scenario. A quicker BOJ hiking cadence or a liquidity air-pocket in global rates could force a sharper carry un-wind (USDJPY lurches lower), tighten global financial conditions, and hit cyclicals and small caps. Oil would likely weaken first on growth angst before rebounding on OPEC+ discipline headlines; gold would catch a haven bid.
Fiscal and political implications
Japan’s mix of rising local yields and hints of additional policy support limits outbound demand for U.S./EU duration at the margin, a quiet tightening of global financial conditions that the U.S. Treasury must navigate through a heavy auction calendar (e.g., steady bill/coupon issuance shown in the WSJ borrowing schedule). If BOJ normalization persists, Treasury will lean more on domestic real-money and banks to absorb supply, keeping the long end range-bound rather than collapsing.
In Europe, the policy mix is still growth-light and bank-friendly at the margin. The BoE’s decision to relax elements of bank capital requirements into 2027 (as reported this week) and constructive commentary around U.K. banks’ earnings capacity reduce the odds of an aggressive fiscal “tax raid” and bolster loan growth optics, supportive for U.K. financials and London listings into 2026.
Principal risks
Policy error at the BOJ remains the near-term macro swing risk. A step-change in Japanese rates could spark a disorderly carry exit and Treasury-market illiquidity just as U.S. refunding needs stay sizable. Secondary risks include any surprise U.S. data that re-accelerate inflation (re-steepening in real rates), or an energy-market supply disruption that turns WTI’s drift into a spike.
Opportunities
Positioning for a softer dollar while hedging rate volatility is the most robust cross-asset expression. That favors quality global equities funded by a modest underweight to the dollar, selective long duration via the belly if 10-year USTs hold ~4–4.25%, and strategic gold exposure while oil is cheap versus history and OPEC+ optionality. In regional terms, selective Japan financials benefit from a steeper local curve; U.K. banks screen better on regulatory optics and earnings leverage after the shift in capital stance.
Asset-by-asset impacts and levels
XAUUSD (Gold). Momentum remains constructive with futures near $4,215–$4,273/oz as the dollar softens and real yields stall. Base case: consolidation above $4,000 with breakout risk if BOJ tightening coincides with any U.S. growth wobble. Risk: a sharp real-rate back-up would cap gains.
S&P 500. The index holds near highs (~6,829–6,849). A softer dollar/benign real-rate path supports earnings translation for multinationals and risk appetite. Watch breadth, small-cap participation, and any funding-stress spillovers from Japan.
Dow Jones. The Dow trades ~47.5k–47.9k, reflecting cyclical leadership and bank strength. If U.K./U.S. bank policy optics keep improving and rates volatility calms, industrials and financials can extend.
USDJPY. The pair trades around ¥156 per dollar this week, with risk skewed to yen strength if BOJ guidance hardens at the Dec. 18–19 meeting. A measured grind toward ¥150 is plausible on carry normalization; a disorderly dash through ¥150 would imply broader deleveraging.
DXY / WSJ Dollar Index. The WSJ Dollar Index is down on the week (≈96.4–96.8), consistent with firmer yen/euro. Baseline is a gentle drift lower if BOJ tightens and U.S. data cool. Upside dollar risk revives with a U.S. inflation surprise.
Crude Oil (WTI). Front-month WTI sits in the high-$50s (~$58.6). Demand concerns and ample non-OPEC supply keep a lid on rallies, but position-cleaning looks advanced; risk/reward improves on dips toward mid-$50s with OPEC+ supply management as the catalyst.

XAU/USD: Buy Gold on Support Retest, Bullish StructureGold continues to fluctuate within a compression model + ascending support, indicating that selling pressure is weakening and the market wants to accumulate before bouncing to the upper supply zones.
Recent data shows USD cooling as the market increases expectations that the FED will be more dovish → creating a support base for XAU/USD's short-term rise.
📊 Technical Analysis – H1 Frame (MMF Flow)
1️⃣ Key Support:
4,187 – 4,188: BUY zone + lower trendline + strong price reaction.
Price just retested and bounced → confirming active buying remains.
2️⃣ Near Resistance:
4,211 – 4,212: mid-liquidity zone → expected to create HL before breaking the downtrend line.
3️⃣ Main Target Zone:
4,236 → strong resistance, confluence multiple times from the market.
Further: 4,254 → large supply zone, is an extended target if price breaks out.
🧭 Trading Scenario According to MMF
Main Scenario – BUY with Trend
BUY again when price retests 4,187 – 4,188 or
BUY when price breaks 4,212 then retests.
TP Targets:
TP1: 4,212
TP2: 4,236
TP3: 4,254
SL: below 4,182.
Idea: price creates an absorption model + HL on trendline → potential to pull up to the upper liquidity zones.
Secondary Scenario – SELL Reaction
Only for scalp traders:
SELL reaction at 4,236 – 4,238
TP: 4,212
SL: 4,243
🎯 Daily Bias Summary
Bias: Bullish on H1 when price holds 4,187.
Priority: BUY at the bottom – SELL at the top only for scalp.
Wait for the downtrend line to break to extend the target to 4,254.

GOLD BULLISH STRUCTURE : M15 Buy Setup Greetings 👋
Gold On M15 Setup Has Bullish The Reason Of Buying Thats Liquidity Has Been Sweeped And Have A Demand Zone To Buy Gold With Confidence And The Target 🎯 is Buy Side Liquidity We Are Trade On Liquidity Hold With Breakeven

XAUUSD | Gold Signal |Dec 4,2025📌 MARKET ASSESSMENT
As of Thursday, December 4, spot gold is trading at $4,202 per ounce, up roughly $10 on the day.
ADP data showed that the U.S. private sector lost 32,000 jobs in November, sharply missing expectations for a gain of 10,000 and marking the steepest drop since March 2023. Win Thin (Nassau 1982) noted that the ADP index has been weakening consistently, reflecting a sustained cooling trend in the labor market. Nela Richardson from ADP added that the slowdown is broad-based across all business groups, especially among small and medium-sized enterprises — a sign that consumers are becoming more cautious amid ongoing macroeconomic uncertainty.
While gold jumped in response to the data, silver — which briefly touched $58.97 per ounce early yesterday — fell sharply back to $57.83, triggering short-term corrections across the entire precious metals complex.
Since gold is a non-yielding asset, expectations of monetary easing remain its core support. However, the combination of soft economic data, silver’s volatility, and profit-taking suggests that gold’s path upward will remain uneven.
Macro forces — weakening labor indicators, a softer U.S. dollar, and political uncertainty surrounding the Fed Chair position — continue to tilt in gold’s favor. But until the metal can firmly break above $4,400 per ounce with strong liquidity, any upside acceleration remains only potential rather than confirmed. This is for reference only.

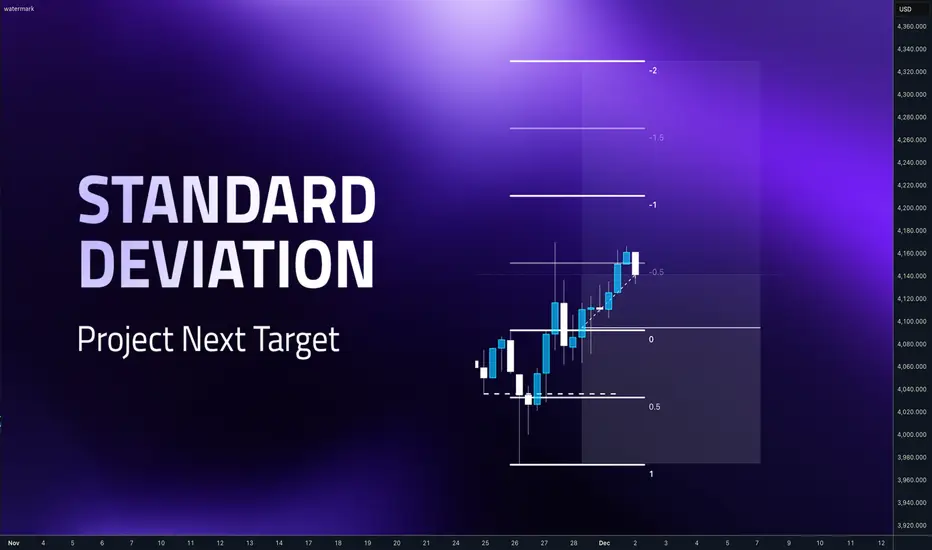
Standard Deviations - How to be exit before the pullbackHey whats up guys, in this post Ill show you easy method which can help you to set your targets, stay in the positions, prevent cutting position too early or hold for too long. You will basically have more objectives to stay in trade and give it a frame to which key levels you should use. Standard deviations are projection deviations of the manipulation leg. Which is the price swing that sweeps liquidity and then changes the order flow. In simple words, it is the move that takes out stops and then flips the structure - Order block.
📌 Fibonacci tool settings
We will be measuring deviations from the order block and here is the Fibonnaci settings
0 - 1 is where you measure the manipulation leg and then you got your projections.
Zone between 2 - 2.5 is my main focus for taking partials of full profits Price obviously can go further but between 2 - 2.5 is where I tend to take something of the table. Because my longterm statistics says most of my trades has 2.3 RR. 📌 What to do at 2- 2.5
Obviously don't start doing what Im saying here on your next trade. First test it and if you find it useful, never put any idea from someone from the internet to your money without verifying by yourself then add it to your arsenal or reject it. If your strategy has fixed TP based on structure stick with it. Standard deviations can be just a little helper. Let's look at few examples.
1️⃣ Example: GBPUSD
This is the example which has Benn posted here on TV And as you can see it has made some gain, didn't hit full TP and reversed, back to the entry. But look where it reversed - Exactly at the 2 - 2.5 I saw it has my average profit and it was Friday so I closed it . as we can see it was a good decision to close position fully here and not sticking to to the full target. Im not saying that closing trader before the initial target is good decision, but considering that its Friday and I got my average 2.3 gains. Its a no brainer to take what the market offers to me. 2️⃣ Example: EURUSD
My strategy is has two defined targets. 50% of the range and full range. After taking 50% partial at 50% I should be targeting opposing range low after the sweep of the liquidity highs. So I should hold the trade until the target. But as it was a Friday and price been between 2 - 2.5 means my trade was around 2.3 RR in profit, which is my average reward so I decided to close it completely and as we can see it was a good decision as the price just completely reversed before hitting my target. 3️⃣ Example: XAUUSD
This is model 2 entry on Weekly range and Model 1 on Daily CLS range. Let's not overcomplicate. Look at the order block our initial point for the measuring our target and check where is the 2 Std. Projecting 2 St.D gave me confidence that CLS highs could be reached easily as it all was aligned with HTF trend so I held the trade for the whole week. Exited little bit bellow, but as it was reaction on LTF OB and Friday, I didnt want to hold in the trade over the weekend. 4️⃣ Example :EURUSD
Another EURUSD trade example after sweeping a low and creating order block We can that 2 STD aligns with CLS highs so its perfect target and we can see sharp expansion to the 2 St. D then price started retracing and consolidating, If we targeting bigger targets we would be for 2 days in this choppy range now. 📌This tool is not a strategy it self its just something what can help us to set reasonable targets while we don't have to face big pullbacks. Im not saying you should go only for 2.3 RR as I do. If you can hold traders for 3RR and more you are great trader.
📌However I found that when Im targeting 3R and more, I must face pullback and watch how my gains go back to the markets which I dont like. Im still human and have emotions and you know how it feels when you have a great trade developing and then in a blink of the eye its back on your entry.
📌Also by targeting just 2.3 RR is a clean shot and I realized that I can increase my risk per trade for such setups because they are hitting TP more often than 3RR trades. So in the end it's less stress and better profits. But it's all about a personal preferences.
Let me know what is your average RR and reason you targeting it.
David Perk aka Dave Fx Hunter
Lingrid | GOLD Pullback Trading Opportunity from Support ZoneOANDA:XAUUSD is retracing into the 4,190–4,200 support band after an extended bullish run within the upward channel. The broader structure remains firmly bullish, with higher lows and higher highs forming along the rising trendline and each dip being absorbed by buyers. Price is now testing zone below the previous-day low, creating a classic buy pullback setup inside a continuation trend.
If TVC:GOLD stabilizes above the trendline and reclaims intraday momentum, the next upside rotation could drive the metal toward the 4,290 resistance shelf, aligned with the higher boundary of the channel. Maintaining support above 4,190 keeps the bullish sequence intact and favors further acceleration.
➡️ Primary scenario: pullback holds above 4,190 → continuation toward 4,290.
⚠️ Risk scenario: a clean break below channel exposes 4,100 and delays bullish continuation.
If this idea resonates with you or you have your own opinion, traders, hit the comments. I’m excited to read your thoughts!

GOLD MONTHLY CHART LONG TERM/RANGE ROUTE MAPHey Everyone,
We’ve just released our new Monthly Chart idea, which we’ll now be tracking following the completion of our previous long term monthly chart idea. It’s time to shift focus to the next big setup.
Currently, price is trading above the channel midline, and we’ve also seen a candle body close above 4000 for November month opening a long range gap to 4436 AXIS.
EMA5 cross and lock would further confirm this but its lagging on the longer time frame and therefore not enough time to action if waiting for ema5 confirmation. A candle body close is suffice for us to use to track the levels on this timeframe when EMA5 lags behind.
While the candle body close above 4000 confirms the bullish long term structure, we’re also mindful of the potential for a short term retracement, particularly around the EMA5 detachment zone (highlighted with a circle on the chart). This would offer a healthy dip opportunity, aligning perfectly with our strategy to buy into weakness on the way up.
For the bigger structure to remain intact, we’ll be looking for 4000 to continue holding as key primary structural support. As long as that level is respected, the long term gap toward 4436 remains firmly in play. 3532 remains our secondary structural support, also our swing range inline with the channel half line, providing a long term pivotal structural level of support.
This is a higher timeframe idea that we’ll be building on as structure continues to unfold.
We will continue to use all support structures, across all our multi time frame chart ideas to buy dips also keeping in mind our long term gaps above. Short term we may look bearish but looking at the monthly chart allows us to see the bigger picture and the overall long term Bullish trend.
As always, we will keep you all updated with regular updates throughout the week and how we manage the active ideas and setups. Thank you all for your likes, comments and follows, we really appreciate it!
Mr Gold
GoldViewFX

Gold 13 nov 2025 Sell PlanGold 13 nov 2025 Sell Plan
expecting move expected.
we have sitting liqudity below PDL.
m15 Mss Hapend i will sell till target below.

Xauusd 1H chart Pattern..Here is a clean professional analysis with accurate targets based on the chart I'm shared (trendline break + cloud retest + liquidity zones):
---
📉 XAUUSD Analysis & Targets
Market Structure
Price broke the ascending trendline
Currently retesting the cloud support zone
Sellers are strong from 4235–4245 supply zone
Liquidity is resting below 4180 & 4160
---
🎯 Target Levels (Based on Analysis)
🔻 TP1: First Breakdown Target
4185 – 4178
Reason: First liquidity pocket + trendline retest.
---
🔻 TP2: Major Support Target
4165 – 4155
Reason: Imbalance fill + cloud lower band + horizontal demand.
---
🔻 TP3: Extended Drop Target
4120 – 4105
Reason: Large imbalance area + my lower drawn target zone.
---
🔻 TP4 (Deep Target / Final)
4095 – 4085
Reason: Strong historical demand + liquidity sweep zone.
---
📌 Summary
Target Level
TP1 4185–4178
TP2 4165–4155
TP3 4120–4105
TP4 4095–4085
THE KOG REPORTTHE KOG REPORT:
In last week’s KOG Report we said we would be looking either price to push up into our red box and give us a short, or, price to attempt that 4040 level and bounce, giving us the opportunity to go long. We got in on that long, and then just carried it for most of the week, resulting in not many updates apart from the continued path and a successful week to close.
It was a bit nervy with the ranging, but our hot spots worked well, gave us added confidence and of course the algo performed exceptionally.
A fantastic week in Camelot, not only on Gold but the numerous other pairs we trade and analyse.
So, what can we expect in the week ahead?
Key levels here for the open are 4228 resistance and 4210 support. These are the levels that need to be monitored on the 15min red boxes for the break. A break above and we should see that high on the chart completed and potential for bears to come in and attempt the correction. While that flip is still active, above 4210 there is more upside to be had but the level sticking out to us this week is the 4260-70 region. This is the level that needs to break open and hold for us to go higher.
The issue I have at the moment is our liquidity indicators are suggesting a higher high but once that is made, there is a chance we get a sharp reversal and a clean rejection from one of these resistance levels can lead to a very aggressive decline all the way back down into the low 4000’s again. It’s a new day of a new month so caution is needed, the market may open with gaps, if that’s the case, best not to chase them, let it settle and then look for the set up.
RED BOXES:
Break above 4230 for 4237, 4247, 4250 and 4260 in extension of the move
Break below 4210 for 4199, 4195 and 4165 in extension of the move
Please do support us by hitting the like button, leaving a comment, and giving us a follow. We’ve been doing this for a long time now providing traders with in-depth free analysis on Gold, so your likes and comments are very much appreciated.
As always, trade safe.
KOG

Xauusd Possible Scenarios (Next 24–48 Hours)1. Market Structure
Gold recently made a strong bullish rally (left side of chart), followed by a sharp correction and is now consolidating in a sideways range.
Current structure shows:
Lower highs forming
Higher lows weakening
Price compressing → triangle / squeeze zone
This indicates indecision and a potential big breakout coming soon.
📈 Bullish Scenario
Gold climbs back above 4106, holds, and breaks the trendline.
Target 1: 4150
Target 2: 4200
Target 3: 4250
Bullish trigger: Break and close above 4120 on 4H.
📉 Bearish Scenario
If price breaks 4000 – 4030 support:
Target 1: 3985
Target 2: 3920
Target 3: 3870
Bearish trigger: Strong 4H candle close below 4025.
For More Updates Stay Tuned

GOLD 12H CHART ROUTE MAPPlease review our updated 12H chart route map with the latest levels.
The 1H and 4H timeframes I shared earlier played out exactly as expected. Now, I’m sharing the 12H GOLD chart to give you a clearer, bigger-picture outlook. Please read the caption carefully.
Price is currently trading within the broader on 12H Chart between 4000 - 4230 range. The channel half-line and symmetrical top line continue to act as major resistance, with the BB (Breaker Block) adding further resistance just below the supply area.
If the current support holds and price rejects from the BB Or the supply zone, or below the half-line, we can expect a move toward the 4130 target and this could open the swing range for a deeper test before a potential bounce. A clean break above 4230 would confirm bullish continuation to the upside.
We will factor all of this into our buy setups from dip levels. Our updated levels and weighted zones will help us monitor downside movement and capitalize on bounces through smaller-timeframe strategies.
Our long-term bias remains bullish, so we welcome corrective pullbacks. These dips provide safer opportunities to buy from strong levels rather than chasing the bullish move at the top.
Thank you all for your likes, comments, and follows — we truly appreciate your support!
The Quantum Trading Mastery

Gold next move (sell continued but it is risky now)(02-12-2025)Go through the analysis carefully and do trade accordingly.
Anup 'BIAS for the day (02-12-2025)
Current price- 4231
"if Price stays below 4242, then next target is 4221, 4200 and 4190 and 4170 and above that 4280, 4300 ".
if price managed to break and close above 4235 on 1H time frame, then we may buy as marked in the chart.
-POSSIBILITY-1
Wait (as geopolitical situation are worsening )
-POSSIBILITY-2
Wait (as geopolitical situation are worsening)
Best of luck
Never risk more than 1% of principal to follow any position.
Support us by liking and sharing the post.

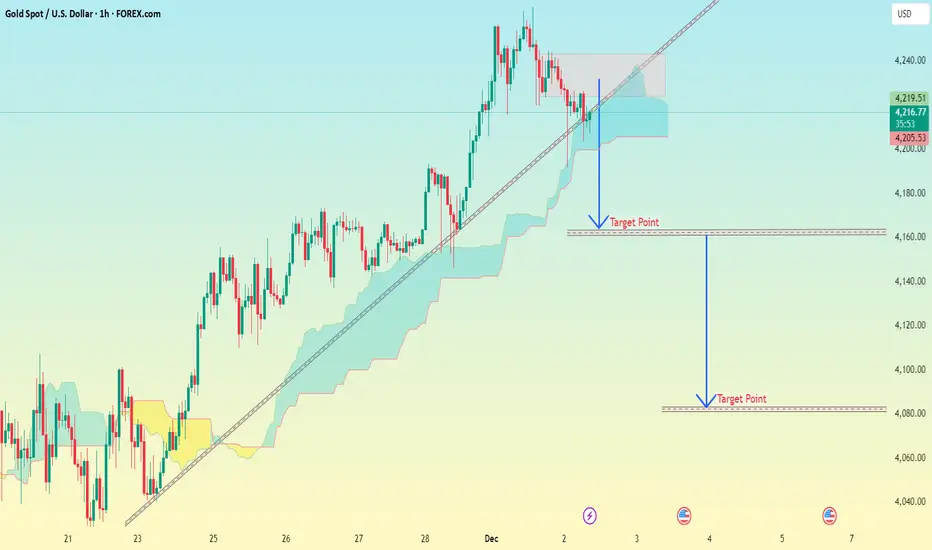
Gold 1H – Can 4265 Breakout or Trap Into 4185?🟡 XAUUSD – Intraday Smart Money Plan | by Ryan_TitanTrader (02/12)
📈 Market Context
Gold continues its impressive rally as markets price in a potential rate cut by the Federal Reserve in December. Spot gold recently surged — reflecting multi-week highs — as the US Dollar Index (DXY) weakened. The backdrop is increasingly dovish: fading USD strength and rate-cut odds have kept gold bid.
From a technical perspective, price sits compressed at the channel top, signaling liquidity plays before the next institutional leg. Macro tone from Powell’s opening remarks on ForexFactory adds volatility fuel.
🔎 Technical Framework – Smart Money Structure (H1)
Current state = Accumulation / Distribution within rising channel
Liquidity zones & key triggers
• Premium liquidity zone (sell-opportunity): ~4265–4267 (upper-edge pool of liquidity)
• Discount liquidity zone (buy-origin / re-entry zone): ~4186–4184 (demand liquidity near prior displacement base)
• Equilibrium / chop zone: mid-channel compression → no blind trading unless structure validates direction
Expected Smart Money sequence
Sweep → CHoCH/MSS → BOS → Displacement → FVG/OB Retest → Expansion
Gold remains primed for a directional move only after structure confirms intent.
🎯 Trade Plans for Today
🔴 SELL GOLD 4265 – 4267 | SL 4275
• Thesis: Liquidity sweep above equal highs at premium edge, followed by engineered bearish BOS confirming institutional selling intent.
• Entry rules (must wait for confirmation):
✔ Price pokes 4266 zone → bearish CHoCH/MSS + BOS down (M5–M15)
✔ Entry on FVG fill or OB retest after BOS validation
• Targets:
1. 4245 – 4240 (first reaction)
2. 4225 – 4215 (channel EQ retest)
3. 4186 – 4184 (full delivery into discount)
🟢 BUY GOLD 4186 – 4184 | SL 4176
• Thesis: Discount liquidity tap at institutional base, buy absorption after sweep + bullish BOS signaling new intraday demand.
• Entry rules (must wait for confirmation):
✔ Price sweeps 4185 → bullish CHoCH/MSS + BOS up (M5–M15)
✔ Entry on rejection wick + FVG fill or OB retest confirmation
• Targets:
4. 4215
5. 4240
6. 4265+
⚠️ Risk Management & Notes
• Avoid trading inside mid-range without CHoCH/BOS validation — sweeps are traps until proven by MSS + BOS.
• Use SL for structure invalidation only — no averaging in compression.
• Reduce lot size during Powell’s delivery window; macro impulses can run both sides of liquidity fast.
📍 Summary
Gold is coiling at highs for liquidity. Either Powell triggers a 4266 sweep → bearish BOS → delivery, or price hunts 4185 discount → bullish BOS → continuation.
Trade the structure, not the narrative — wait for CHoCH & BOS + retest to unlock expansion.
📌 Follow @Ryan_TitanTrader for daily Smart Money updates.

Bonus Gold long Week 01 DecemberVery simple Gold long for week 01 December.
Trade based on Fibonacci levels on the 4 hour chart.
i have added 2 TP first for 750 pips and full TP for over 1000 pips/
With these trades it is recommended to just use small lot size and be prepared to hold in drawdown .
not to be considered financial advice its just a bit of fun with technicals
let me know if you want to see more of these along with the weekly chart

Gold Buys only / never SellAs discussed throughout my yesterday's session commentary: 'My position: I have been Buying Gold aggressively from #4,222.80 Support throughout yesterday’s session many times and closing m orders as near as #4,242.80 Resistance. I Bought Gold this morning #4,185.80 aggressively as well with set of Buying orders. I will continue Buying aggressively above #4,208.80 Resistance is invalidated. #4,300.80 and #5,100.80 Medium-term Targets.'
Technical analysis: Practically I have nothing to add to the previous analysis as following the Double Bottom on Hourly 1 chart / Price-action has made a (marginal) new High’s on Hourly 4 chart above #4,227.80 Resistance for the fractal. If #4,227.80 - #4,232.80 gets invalidated on High Volume / on aggressive manner (last #3 attempts have been really anemic) then I can call a test of the #4,242.80 Resistance in extension. With the my instruments on Neutral levels I do not expect Selling sustainability on both Short and Medium-term. #4,230.80 local High’s got hit on my surprise Gold delivered aggressive #4,162.80 take-down which was recovered right away (well used it from #4,167.80 and Bought there), I am expecting the final extension wave of this parabolic run towards #4,300.80 Higher High’s Upper zone Technically. I believe this will be a major Resistance, but will necessarily cause a (# -1.00%) or (# -2.00%) pullback within new Monthly accumulation period. #4,152.80 - #4,162.80 zone is currently posing as an Support on Hourly 1 chart and values I mentioned above Resisting. I should mind our Risk tolerance as like I said this is most likely the final wave of the parabolic run that started recently, small stabilization then #5,100.80 benchmark test ahead.
My position: I am without any orders currently as current Neutral Rectangle belt is too idle to deliver any conclusions however my Profit from both Short and Medium-term orders is already excellent. I will attempt to Buy as Lower as I can from my key entry points.

XAUUSD Breakout and Retest: Bullish Continuation SetupGold was trading inside a well-defined downward channel, consistently respecting both the upper and lower trendlines. After several touches, price finally broke out above the channel, signaling a potential shift in momentum from bearish to bullish.
Key Points:
🔹 Breakout:
Price pushed above the channel’s upper boundary, confirming buyer strength after repeated higher lows.
🔹 Retest of Structure:
Following the breakout, price pulled back to retest the broken trendline (now acting as support). This retest is marked on the chart and is a common continuation signal in trend-reversal patterns.
🔹 Bullish Reaction Expected:
If the retest holds, buyers may step in to push price toward the projected target zone shown on the chart.
🚀 Bullish Scenario:
Hold above the retest zone
Break of minor resistance from the pullback
Target area aligns with prior structural highs and measured move from channel height
⚠️ Bearish Invalidation:
A clean breakdown back inside the channel would invalidate the bullish setup and signal weakness.

GOLD breaks out of accumulation phaseOANDA:XAUUSD has moved from a consolidation phase to an active bull run: spot is trading around ~$4,200/oz, supported by expectations of Fed easing (markets are pricing in ~89% probability of a 25bp cut in December), central bank buying and a still uncertain geopolitical backdrop. In this context, a $5,000/oz target is no longer a pipe dream but a conceivable scenario, but only if a number of technical and fundamental conditions align.
Analysis (fundamentals — geopolitics)
1. Fundamentals: Central banks’ net buying (WGC: strong net buying), a weaker USD and falling real Treasury yields are the three fundamentals supporting gold. Recent weak US economic data (weak manufacturing PMI, ADP and PCE potentials reinforce cooling sentiment) push the market to price in higher interest rate cuts, reducing the opportunity cost of holding gold.
2. Geopolitics: Russia-Ukraine negotiations remain uncertain; regional tensions (Middle East, US-Venezuela relations…) maintain safe-haven demand. External shocks could spur rapid and strong demand for gold.
Conditions for the $5,000 scenario (necessary & sufficient)
• Necessary: The Fed makes at least one 25 bps cut in the near term (December) or the market is certain of a rate cut cycle; real yields continue to fall; the USD remains weak; the central bank continues to buy net.
• Sufficient: Price breaks the $4,216–$4,226 resistance zone on higher than average volume, accompanied by a sustained decline in real yields (-real basket) and no sharp reversal in the USD. When all three factors (technical break, real yield decline, sustained official demand) are present, the $5,000 target becomes a trackable possibility in the medium-long term.
Risks
Bear case risks include: the Fed unexpectedly takes a hard/clear stance without cutting, the USD strengthens again (e.g. due to better employment data), or market liquidity declines leading to massive profit-taking by funds. These factors could push gold back below $4,000 and break the short-term bullish structure.
In summary, the journey to $5,000 is a structurally plausible scenario: the macro fundamentals and the official demand flow are tilted to the upside, but that scenario will only be triggered by a volume-driven technical breakout combined with a sustained decline in real yields. I maintain a cautiously positive stance, closely monitoring the underlying geopolitical developments and yield developments to assess the sustainability of this rally.
Technical analysis and recommendations OANDA:XAUUSD
Gold price is maintaining a clear bullish structure as it continues to follow the medium-term rising channel and holds the important support zone around 4,128 – 4,130 USD/ounce (Fibo 0.236). The price continuously making higher lows and bouncing back above the short-term MA shows that active buying power is still dominant. The most recent candlestick pattern shows strong absorption at the support zone, implying that money flow is protecting the uptrend.
With no break below 3,973 USD/ounce (Fibo 0.382), the bullish structure continues to be consolidated. The next target of the current cycle is 4,300 – 4,380 USD/ounce, corresponding to the top of the rising channel and the extended Fibo zone. RSI is recovering from the neutral zone, showing that the upside momentum still has room to grow.
SELL XAUUSD PRICE 4277 - 4275⚡️
↠↠ Stop Loss 4281
→Take Profit 1 4269
↨
→Take Profit 2 4263
BUY XAUUSD PRICE 4191 - 4193⚡️
↠↠ Stop Loss 4187
→Take Profit 1 4199
↨
→Take Profit 2 4205

XAUUSD(GOLD) HIGH PROBABILITY LONG SETUP SOON!!!🚨 XAUUSD HIGH PROBABILITY BUY SETUP 🚨
* Here We Can See Clearly The Next Potential Moves For GOLD Coming Hours/Days.
* Keep Your Eyes Close On Your Trading Positions.
* Happy PIP Hunting Traders.
FXKILLA.
