GOLD : Bullish ContinuationThere is a strong likelihood that Gold will continue to appreciate following a confirmed breakout above a significant intraday/daily resistance cluster.
We anticipate a move upwards to at least 4300.
Trade ideas

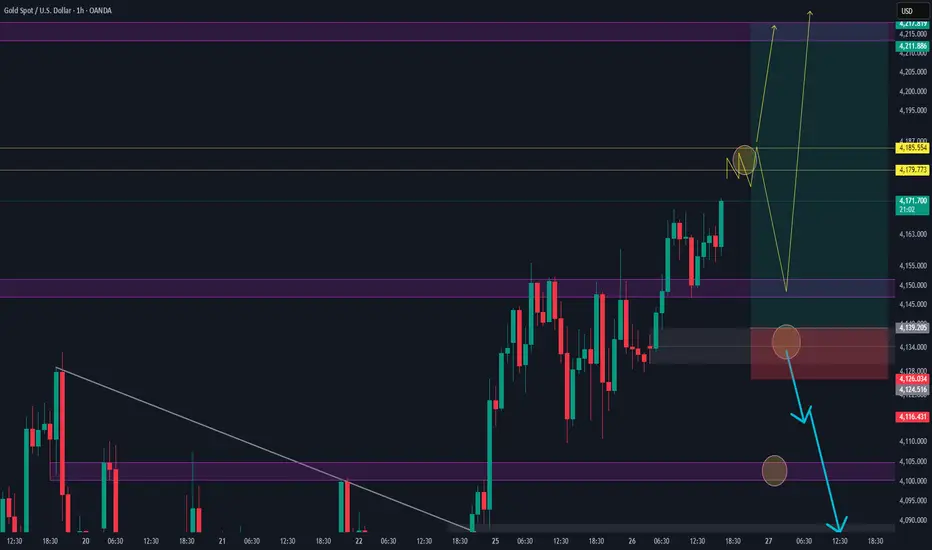
Gold next move (continuation but a pullback needed)(26-11-2025)Go through the analysis carefully and do trade accordingly.
Anup 'BIAS for the day (26-11-2025)
Current price- 4074
wait for the pullback and if it happens then buying area will be 4135-4040
"if Price stays above 4120, then next target is 4150, 4170 and 4205 and 4205 and below that 4100, 4085".
-POSSIBILITY-1
Wait (as geopolitical situation are worsening )
-POSSIBILITY-2
Wait (as geopolitical situation are worsening)
Best of luck
Never risk more than 1% of principal to follow any position.
Support us by liking and sharing the post.
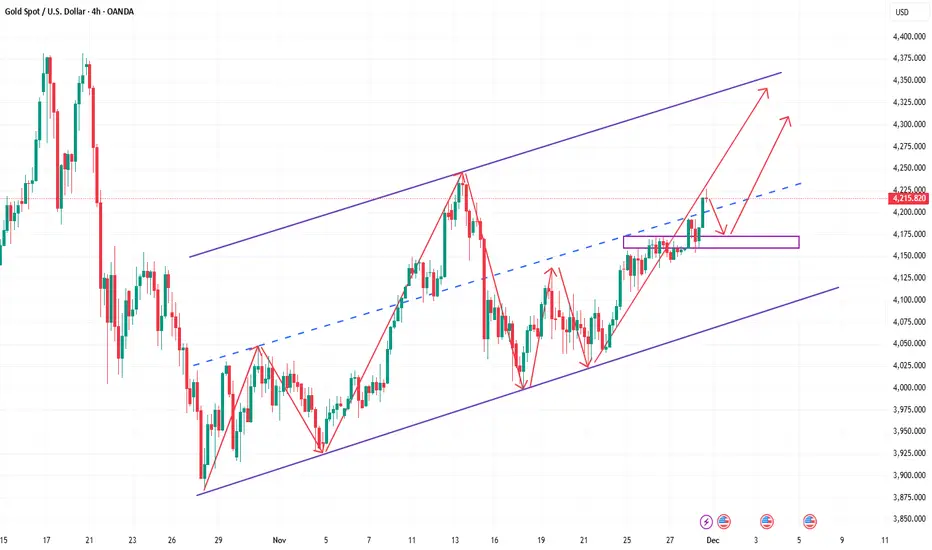
How high will gold go next week How much room is there to go up?Gold Technical Analysis: Gold has seen several highlights this week, breaking through the 4200 mark again, a figure that has caused considerable panic. Coupled with consecutive daily gains and high-level consolidation, this is the first sign of a strong upward move. The daily chart shows a reversal from a bearish to a bullish pattern, and if this pattern continues for two more days, forming a consecutive bullish formation, it will likely evolve into a second upward move. On Friday, gold experienced a relatively strong surge, falling to a low of around 4153 and rising to a high of around 4226. Currently, the bullish trend remains unchanged, and pullbacks present opportunities to enter long positions. The next key resistance level to watch is around 4245; if this level holds, a short position can be considered before going long.
This week, the key resistance area for gold is around 4240-4250. If it can break through effectively, the price of gold is expected to further test the previous highs of 4300 and even 4380. On the downside, 4175-4160 has turned from resistance into the first strong support, and the more critical support is at the 4150 level, a trading zone between bulls and bears. From the 4-hour chart, the main support for the price is at 4200. As long as the market maintains its strong upward momentum, it will not retrace too deeply. Therefore, it is necessary to pay attention to the short-term bullish trend. On the hourly chart, the price rose from 4155, and after a retracement from 4170-4180, it rose to 4226. The bullish trend support is at 4155. As long as the price does not break 4155, it will continue to rise and move towards the 4240-4250 area. In summary, the recommended strategy for gold trading next Monday is to primarily buy on dips and secondarily sell on rallies. The key resistance level to watch in the short term is 4240-4250, while the key support level is 4180-4160. Please keep up with the pace of the market.
Report 1/12/25Report Summary
Global risk has been repriced around three overlapping forces: 1) a tentative U.S.–Ukraine diplomatic channel that now contemplates land swaps, elections and security guarantees, plus a parallel Russian pitch to draw U.S. capital into Arctic minerals and a U.S.-led “reconstruction fund” sourced from frozen Russian reserves, raising the odds of trans-Atlantic policy friction even if fighting subsides; 2) an assertive U.S. homeland-security doctrine that is redirecting defense-tech spend and procurement tempo toward the Western Hemisphere (drones, ISR, AI), creating a new secular bid for dual-use tech and select primes; and 3) a growth and policy mix that still anchors the dollar and U.S. equities but leaves Europe struggling to escape a low-growth trap, even as Japan’s mix of large fiscal impulse and higher JGB yields continues to pressure the yen. U.S. stocks closed last week firmer (Dow +3.2%, Nasdaq +4.9%, Stoxx 600 +2.5%), 10-year U.S. Treasury near 4.02%, WTI ~$58.6, EUR ~1.16 and JPY ~156 per dollar, framing the starting point for risk this week.
Geopolitics, policy and growth
The Florida talks between senior U.S. officials and Ukraine, paired with plans to send envoys to Moscow, put cease-fire architecture on the table (elections timing, territorial arrangements, security guarantees). The parallel track is more disruptive for Europe: Moscow is courting the White House with a template to tap ~€300bn of frozen Russian central-bank assets for U.S.–Russia investment projects and a U.S.-led Ukraine rebuild, explicitly positioning American firms to “beat Europe” to the dividends. Expect pushback from Brussels and most EU capitals; if Washington seriously entertains this structure, we should price a wider U.S.–EU policy gap on Russia, sanctions governance and energy/minerals deals into 2026.
Separately, the administration’s “narco-terror” frame is channeling significant money toward maritime and border ISR, counter-drone and autonomy stacks. DHS was authorized for an extra ~$165bn over a decade (including surveillance tech), the Pentagon received an additional ~$1bn earmark for anti-drug and border missions, and the Coast Guard’s budget for cutters/robotics/autonomy also increased, validating revenue lines for firms selling ship-launched endurance UAVs, data fusion and anomaly detection. That redirection of spend has already produced operational outputs (e.g., record ~60k-lb cocaine seizure supported by a ship-launched ISR drone) and multi-year procurement footprints. For public markets, this creates a medium-term demand floor for select defense-tech suppliers and data platforms, even if traditional peer comps remain tied to cyclical rate and budget dynamics.
The growth mix remains U.S.-centric. Despite bouts of factor-rotation and higher equity-risk premia for “speculative corners,” the S&P 500 has repeatedly mean-reverted after sell-offs, helped by resilient top-line growth and AI-capex leverage. While “Trump-themed” assets and some non-profitable tech have slumped sharply, underscoring stretched multiples and tighter selection, quality U.S. equities and large banks are still riding favorable domestic macro and rate-path expectations. Meanwhile, gold continues to attract flows on dollar-confidence hedging and geopolitical insurance, trading near record territory (~$4,200/oz, up ~60% YTD).
Europe’s outlook is more fragile. Even before any U.S.–EU divergence over Russia-asset usage, Europe’s slow productivity and manufacturing slump leave it vulnerable to external shocks and internal fragmentation. In contrast, Japan combines the largest fiscal package since Covid with multi-decade-high JGB yields, inviting foreign participation in the long end and keeping USDJPY elevated, until BoJ/MoF tolerance is exhausted.
Market reactions so far
Cross-asset price action is consistent with “U.S. resilience + Europe/Japan policy experiments”: U.S. equities up, duration steady around 4.0% on the UST 10y, crude subdued near $58–59 despite Venezuela-related rhetoric (balanced by ample non-OPEC supply and soft ex-U.S. demand), the euro mid-1.16s, and yen above 155 as Japan’s yield rise has not yet rewritten carry math. Weekly closes on the Dow, Nasdaq, Stoxx 600, the 10-year, WTI, EUR and JPY quoted above anchor the near-term technicals.
Strategic forecasts and implications
U.S.–Ukraine diplomacy with a commercial overlay is a volatility wildcard for Europe. If Washington leans into a settlement package that monetizes frozen assets through U.S. investment vehicles, Europe faces a political squeeze: approve a structure it views as morally hazardous and economically sidelining, or risk being painted as blocking peace and reconstruction. The base case is iterative bargaining and legal engineering around sanctions law; the tail risk is a public trans-Atlantic rift that pressures the euro and EU risk assets while supporting relative U.S. outperformance.
Defense-tech refocus to the Western Hemisphere carries fiscal and sector consequences. The new mission set will hard-wire spending on maritime ISR, autonomy, counter-UAS and data fusion into out-year budgets. That supports revenue visibility for dual-use platforms and software integrators with accredited deployment histories. For credit, this can compress spreads for suppliers with recurring federal revenue and strong CPARS footprints. The political flip side is oversight risk: congressional probes into alleged ROE breaches and civilian-casualty claims can slow authorizations or re-shape procurement language, introducing event risk to contractors.
Europe’s macro remains constrained by low TFP, energy-intensity in heavy industry, and slow capital-market integration. Even a successful cease-fire in Ukraine won’t fix those fundamentals quickly. Expect the ECB to stay data-dependent with a cautious easing bias in 2026, but the growth dividend from lower rates is capped without structural reforms.
Japan’s policy mix keeps the yen soft in the absence of a stronger BoJ reaction or direct MoF intervention. The announced stimulus props real incomes and corporate capex but adds to JGB supply, pushing term premia higher and keeping USDJPY bid until markets price either a credible inflation-control pivot or FX-desk red-lines. That leaves spillover risk to global rates if JGB volatility spikes.
Risks
Key downside risks include a noisy U.S.–EU split over the legal use of Russian assets; governance headlines around homeland-security operations that chill the new defense-tech bid; a sharper European industrial contraction; and a BoJ/MoF policy surprise that snaps yen carry. Upside risks include a credible Ukraine cease-fire framework with burden-sharing that avoids sanction leakage; faster-than-expected EU internal-market and capital-markets union progress; and a benign U.S. disinflation path that allows the Fed to glide policy down without rekindling inflation.
Opportunities
In equities, the mix favors U.S. quality compounders and cash-generative AI infrastructure enablers over speculative growth; defense-tech names with verifiable field performance and multi-year IDIQs screen well against the new spend. In credit, suppliers with sticky federal revenues benefit from visibility and improving leverage metrics. In commodities, structurally higher gold allocations remain justified as long as the market prices dollar-regime tail risks and geopolitics; energy beta is tactically limited by supply elasticity but has call-option upside if Venezuela or Gulf tensions escalate.
Asset-by-asset impact map
XAUUSD (gold). The conjunction of geopolitical bargaining, debates over the use of frozen sovereign assets, and persistent U.S. fiscal deficits sustains safe-haven and “anti-financial-repression” demand. With spot already near records and broad investor participation rising, pullbacks should remain shallow unless the dollar rallies strongly on a positive U.S.–EU concord or a decisive global soft-landing narrative.
S&P 500 / Dow Jones. Earnings resilience plus AI capex continue to offset factor-risk from expensive “story” names. Expect further internal rotation rather than index-level stress unless 10-year yields lurch well above ~4¼–4½% again, or geopolitics triggers a broader risk-off. Last week’s gains on both indices highlight the default “buy-the-dip” bias while macro stays benign.
USDJPY. Japan’s fiscal-plus-yield mix leaves carry intact and keeps USDJPY elevated; watch for MoF jawboning and stealth interventions that can produce sharp, temporary reversals. A credible BoJ tightening pivot or JGB market instability would be catalysts for a larger yen snapback; absent that, the path of least resistance remains a high-150s range.
DXY (broad dollar). Two-way risks dominate. A stronger U.S. growth and equity pulse supports the dollar, but any policy architecture that visibly sidelines Europe over Russia-asset usage could paradoxically weaken it if it intensifies U.S. deficit and sanctions-regime concerns. Near term, range-bound price action around last week’s levels is the base case.
Crude Oil. Fundamentals lean soft (ample supply, mixed global growth), yet the geopolitical options skew upside: explicit U.S. “closed airspace” around Venezuela and any Gulf friction would bid risk premia. With WTI anchored near the high-$50s, the market is effectively short geopolitical volatility; hedging upside tails makes sense here.
Euro–Dollar (EURUSD). Structural European underperformance and policy uncertainty cap euro rallies. If Washington pursues a Russia-asset construct perceived as extractive for Europe, EURUSD is likely to underperform cyclical peers. A positive surprise would be tangible EU progress on internal-market integration and capital formation alongside a Ukraine framework that preserves EU agency; that could re-rate the euro medium-term.
What to watch next
The immediate catalysts are any communiqués from the U.S.–Ukraine–Russia channels (particularly language on asset monetization and security guarantees), procurement disclosures and hearings tied to homeland-security operations, and the next U.S. inflation print versus the market’s December-cut expectations, given the S&P 500’s sensitivity to the rates path. Weekly closes and headline levels above provide the reference frame for trading the reaction.
Positioning playbook (2–6 weeks)
XAUUSD (gold). Bias stays buy-the-dip while geopolitics, sanctions mechanics around frozen sovereign assets, and U.S. fiscal slippage keep insurance demand elevated. Work bids into 3–5% pullbacks from spot rather than chasing breakouts. The simplest discipline: stay long above the rising 20-day average on daily closes; flatten if you get a decisive weekly close through the 50-day and the dollar is firming simultaneously. Near-term upside is incremental (prior high plus ~3–5%) unless we see a distinctly risk-off shock; the main drawdown risk is a broad “soft-landing” rerating that lifts real yields and the dollar together. Hedge with short-dated put spreads if DXY lurches higher on U.S. data beats.
S&P 500. Keep a core long in quality/cash-rich tech and capex beneficiaries, but pair it with cheap index downside into data/event windows. The tactical buy zone remains modest pullbacks toward the rising 50-day or after a 1–2 day de-rate in AI leaders without deterioration in breadth. Invalidate the long if you see a weekly close below the 50-day with negative advance–decline and 10-year yields backing up; that combination tends to extend corrections. Upside is a grind (new high plus a couple percent) unless long rates break lower; a clean disinflation print would extend the run. A 1–2% notional SPX put-spread collar around key prints is still efficient.
Dow Jones. Use it as the lower-beta leg of U.S. equity risk. Domestic cyclicals and defense-tech exposure give it a different factor mix from the Nasdaq. Buy dips toward the 50-day when financials and industrials lead on up days; de-risk if banks roll over alongside a bear-steepening in USTs (10s > ~4¼–4½% with cyclicals lagging). Pairs: long DIA vs short EuroStoxx futures on European-growth disappointments.
USDJPY. Policy mix (big fiscal + sticky JGB term premium) keeps carry attractive. The trade is “long with a parachute.” Add on shallow dips when U.S.–Japan 2-year spread widens; cut fast on signs of MoF action (sudden 3–5 yen intraday drops on no data, heavy TOPIX banks sell-off, BoJ liquidity ops surprise). A daily close below the prior intervention shelf is your hard stop; otherwise, let carry work. Optional structure: long USDJPY spot with a cheap 1–2 month downside put as intervention insurance.
DXY (broad dollar). Expect rangy two-way trade. Stay tactical rather than thematic: buy the dollar on hot U.S. activity/inflation beats or if European political noise pops; fade it when U.S. data cools or if we get cleaner global growth breadth. If you must express the view, prefer it versus the euro (see below) rather than versus high carry EMs with improving flows.
EURUSD. Base-case is sell rallies. Europe’s weak manufacturing pulse and policy frictions cap upside, while any U.S.–EU tension over Russian-asset monetization risks adds a euro risk premium. Scale in on 1–2 big green candles into resistance; target a drift lower back toward recent mid-range, with a stretch target on negative EU data surprises. Invalidate on a weekly close above the last swing high backed by better eurozone credit impulse or a hawkish-surprise from the ECB. Cleaner expression for portfolio context: short EURUSD funded out of long USDJPY to keep overall dollar beta more balanced.
Crude oil (WTI/Brent). Fundamentals are soft near term, but the options skew is to the upside because the market is effectively short geopolitics. The smartest posture is barbell: maintain a small core long in front-month with tight stops, and own cheap out-of-the-money calls 1–3 months out for regime-shift risk (Venezuela enforcement, Gulf incident, or an abrupt OPEC discipline pivot). Fade sleepy rallies into known supply unless spreads tighten and inventories confirm. Invalidate the core long on a decisive weekly close below recent range lows with time-spreads weakening.
Catalyst map you should trade around
U.S. inflation and labor prints remain the first-order driver of USTs and equity multiples; expect vol clusters around CPI/PCE and payrolls. Any communiqué on a Ukraine cease-fire framework that spells out treatment of frozen Russian assets is a euro-risk event; if it tilts toward U.S.-centric monetization, fade EURUSD and EU banks on the headline. Watch House/Senate oversight hearings on homeland-security operations and defense-tech procurement—contract language can move single names and occasionally the group. In Japan, BoJ operations and MoF rhetoric are live: sudden changes in JGB purchase plans or an unscheduled presser are your USDJPY tripwires. For oil, keep an eye on enforcement signals in U.S.–Venezuela policy and any unplanned Gulf disruptions.
Risk controls and “when to be flat”
Be flat (or lightly net short index beta) if you get a synchronized trio: 10-year yields backing up, dollar rising, and equity breadth flipping negative—historically, that mix feeds momentum sellers. For USDJPY and gold, always respect event-risk gaps: hold smaller spot and express edges with options into the most binary windows. For crude, avoid leverage through weekend risk unless you’re explicitly long optionality.

GOLD ANALYSIS What’s Moving the Market Today? (December 1, 2025)EIGHTCAP:XAUUSD GOLD ANALYSIS What’s Moving the Market Today? (December 1, 2025)
Welcome back to Trade with DECRYPTERS, where we decode smart-money footprints into clean, actionable buy & sell zones.
Keep it simple. Trust the levels. Follow the plan.
📰 Market Overview
Gold continues its aggressive climb after reclaiming momentum from the recent Smart Money Buy Orders, with price now pushing toward upper liquidity pockets. Despite a mildly firmer U.S. dollar, the metal remains firmly bid as the market leans into dovish Federal Reserve expectations and post-shutdown uncertainty.
The Dollar Index has stabilized after its post-election rally, but lingering geopolitical risks and strong central-bank accumulation continue supporting gold’s higher-timeframe bullish trend.
With major U.S. data releases delayed due to the government shutdown, markets are moving cautiously ahead of the December 9–10 FOMC, keeping gold rotating neatly inside premium–discount structure.
🔍 Key Fundamentals Driving Today’s Move
📈 87% probability of a December rate cut → boosts gold by lowering yield competition
💵 USD stabilizing → temporary cap on bullish extension but no reversal signal
🌍 Geopolitical tensions elevated → safe-haven premium remains strong
🏦 Central banks added 64 tones in September → long-term bullish structural support
📊 Inflation at 2.9% (Core PCE) → keeps Fed cautious but not aggressive
Gold’s strength is being driven by a blend of macro uncertainty, structural demand, and clean technical rotations inside your SMC framework.
📆 Key Events to Watch
🔸 November CPI — December 18
The biggest wildcard.
Soft CPI → Fed turns dovish → gold targets upper resistance zones
Hot CPI → USD lifts → gold dips into buy areas
🔸 ADP Jobs + ISM Manufacturing (This Week)
Weak labor or manufacturing → boosts rate-cut odds → bullish continuation
Strong data → pullback into buy zones
🔸 FOMC Meeting — December 9–10
Market expects a 25 bp cut.
Hawkish tone → tests 4125 → 4070 → deeper sweeps
Dovish tone → drives 4257 → 4282 and possibly beyond
🔸 Geopolitics
Any escalation = instant safe-haven spike
Calm + stronger USD = controlled retracement
🟩 GOLD TECHNICAL LEVELS
Gold continues respecting the rising structure, reacting strongly from discount zones and pushing into institutional premium blocks.
The impulsive move from the lower support has now carried price directly into your next major smart-money liquidity zone.
🟩 📌 SMART MONEY BUY ORDERS: 4017 – 4032
Primary institutional demand block.
Expect:
✔️ First-tap reactions
✔️ Swing accumulation
✔️ Discount long setups inside the broader bullish channel
A clean break below opens liquidity toward 3960–3950.
🔺 📌 SMART MONEY SELL AREA: 4257 – 4282
Your primary institutional distribution block.
Expect:
✔️ Manipulation wicks
✔️ Stop-hunts
✔️ Swing reversals
A break & hold above 4282 = continuation toward 4310–4325.
📌 Conclusion
Gold remains in a controlled, high-probability rotation between institutional premium and discount zones, with 4238–4245 acting as the decisive intraday pivot. As long as buyers defend structure and macro sentiment leans dovish, the path of least resistance continues to favor upside toward the 4257–4282 distribution block. Stay disciplined, let liquidity guide execution, and trade only where smart money is active.
🙌 Support the Analysis
If this breakdown improves your trading, support with a like & comment — it motivates deeper daily analysis.
Share your charts and setups. Let’s grow together.
Best Regards,
M. MOIZ KHATTAK | Founder — TRADE WITH DECRYPTERS

Bullish Analysis 15M-Gold Breakdown – XAU/USD
✨ Clean structure, institutional narrative, and a clear bullish roadmap.
🔹 1. Bearish Liquidity Mitigation (Sell-Side Liquidity)
The market completed its job by sweeping all sell-side liquidity below previous lows 🟠.
This provides the fuel institutions need to build long positions at discount levels. 🔥
🔹 2. Institutional Reversal from the POI
After the liquidity grab, price taps your POI at 4,190 and shows a sharp rejection 🔁.
This is a strong indication of bullish institutional intent. ✔️
🔹 3. Fake Out + Bullish BOS
The fake out was used to trap late sellers ❌ while big players loaded longs.
The following bullish BOS confirms the shift in character and trend direction. 📈
🔹 4. Projected Path Toward Buy-Side Liquidity
Price is now targeting upside liquidity and higher-timeframe inefficiencies. 🎯
🎯 Institutional Targets (TPs)
• TP1 – 4,230: internal liquidity sweep 💧
• TP2 – 4,254: FVG mitigation ⚡
• TP3 – 4,277: continuation of bullish impulse 📊
• TP4 – 4,300: major liquidity grab / expected HH 🏆

XAUUSD | Gold Signal |Dec 1,2025BUY TREND TARGET FOR TODAY 📊
☄️ GOLD (XAU/USD) H1 STRUCTURE BREAKDOWN: BULLS IN CONTROL ☄️
The market has decisively confirmed the trend reversal. After navigating the consolidation phase, the price action has established a strong, clear Bullish structure.
📊Key Observations
🔤Clear BOS: We have seen multiple Bullish Break of Structures (BOS), confirming that buyers are in complete control of the H1 timeframe. The initial structural resistance (4140-4150) has been cleared.
🔤Current Price Action: Price is currently pushing into the prior high liquidity zone (around 4220) and shows strong momentum, now trading near 4250.
🔤Unmitigated FVG: The most critical immediate Demand Zone lies around 4150 - 4160 (FVG/Order Block). This is the key zone the price may return to for mitigation before continuing higher.
📊Trading Outlook
🔤The bias remains STRONGLY BULLISH.
🔤Primary Strategy: Look for BUY opportunities on minor pullbacks or when price revisits the nearest Demand Zone/FVG for correction.
🔤Invalidation: A decisive close below the key structural low (the Order Block below 4150) would signal a CHoCH back to bearish pressure.

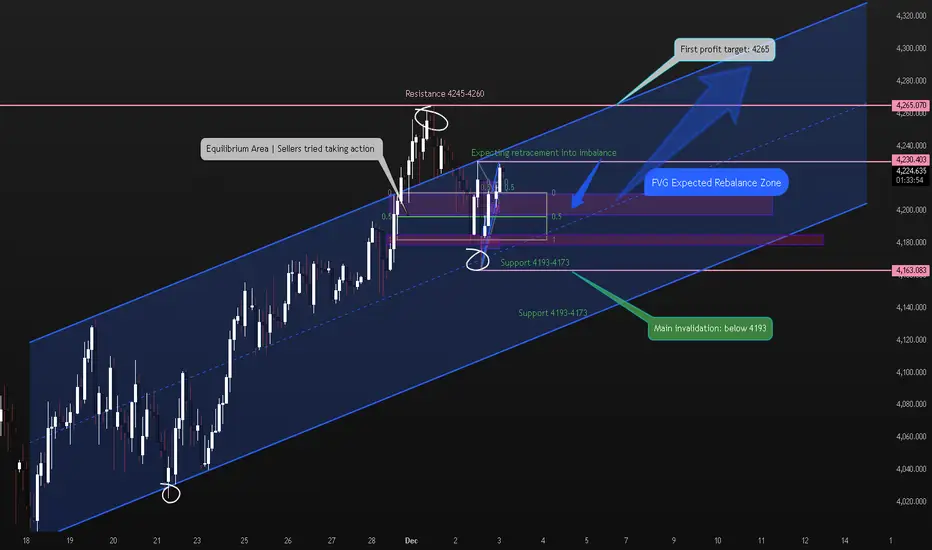
GOLD– Bullish Continuation Expected | Watching FVG Retracement GOLD (XAUUSD) is still moving inside a clean bullish channel structure, and despite recent volatility, the trend remains firmly intact. Price is currently correcting downward and approaching a key imbalance (FVG) zone, where I expect buyers to step back in.
Even though we’ve seen a pullback from the 4,245 zone, this looks like a typical countertrend correction within bullish structure not a reversal. I’m expecting GOLD to dip slightly into the FVG layer, gather liquidity, and continue its upward movement.
📊 Macro Outlook
Mixed US macroeconomic data continues to support a bullish scenario for gold:
Weak US manufacturing PMI continues to signal economic slowdown.
Higher Fed rate-cut expectations.
Safe-haven demand remains elevated due to global uncertainty.
Rising Treasury yields temporarily capped gold, but the bullish structure remains intact.
With key US employment data and ISM services PMI coming this week, volatility might increase but overall momentum still favors the bulls.
Technical Breakdown
Here’s what I'm watching:
🔹 Bullish Channel Structure
Price continues to trade inside a well-defined ascending channel. Until the lower boundary breaks, bullish continuation is the higher-probability play.
🔹 FVG (Fair Value Gap) Rebalance
I expect a short-term dip into the 4205 – 4193 FVG zone.
This is a perfect area for bulls to reload positions.
🔹 Key Support Levels
4201 (minor reaction zone)
4193 – 4173 (major demand + FVG + channel midline)
4169 (strongest support / invalidation level)
🔹 Targets for the Upside
My bullish targets remain:
TP1 – 4,260
TP2 – 4,283
TP3 – 4,300
TP4 – 4,350
I believe GOLD can reach 4,260 fairly soon, and if momentum continues, 4,300–4,350 becomes very realistic.
My Trade Plan (Not Financial Advice)
Bias: Long
Entry:
Looking for buys inside the 4205–4193 FVG zone
or
On bullish confirmation from the channel midline
Stop-loss:
SL: 4169
or
Secondary SL: 4180
Take-profit targets:
TP1: 4260
TP2: 4283
TP3: 4300
TP4: 4350
As long as price stays above 4170 and holds the FVG, bullish continuation remains the main scenario.
Summary
Gold looks good for another bullish leg.
I expect a controlled retracement into the FVG followed by a continuation toward 4260 and above.
What's everyone's ideas??
Send them in the comments so we can chat :)
Trade safe,
– JackOfAllTrades
XAUUSD possible scenario flag formation Long The price is under correction mode a fag pattern and price may reach all time high again. It may further go correction lower and take support and rise again. Let us see how it plays out

Gold Alternative RoutesGold updated routes, elliot wave is not one constant but it is variety of possibilities and as we go along we update and eliminate some of the wrong tracks at the end what we get is the right entry and right exit.
So now for our search of next entry there is a buy trade with small stop loss here but the real wave we wanna catch is the big impulse correction so i will be looking into sell when it goes up.
short term targets 3280-3310-3330 mid term targets are down at 4080-3920-3850 and long ter target is at 4700+ i expect it to go above 4700 in next 6-9 months time.

GOLD Fake Breakage? if NO! what's next??#GOLD.. as we discussed in our last couple of ideas regarding gold fake breakouts above 4213 and you can see that every time market come back to supporting areas.
now again market just broke his resistance area and staying above that so if that is a real breakout then it should hold our supporting region that is around 4213 - 15
no doubt market just matured his patterns and with fundamental support it should go either side but you should keep an eye on technical levels in your trading day.
so we will go for a short below our supporting region.
good luck
trade wisely

Selena | XAUUSD – 4H | Bullish Continuation Setup 4400$ WaitingFOREXCOM:XAUUSD
Gold continues to build bullish structure after forming accumulation in the previous range zone. The market broke out, retested demand, and maintained higher-lows inside the ascending channel. Current pullback into the Entry Zone (4122–4140) aligns with channel support + demand, suggesting potential continuation toward the upper boundary and major resistance around 4380–4410.
Key Scenarios
✅ Bullish Case 🚀
Hold above demand zone + channel support:
🎯 Target 1: 4320
🎯 Target 2: 4380
🎯 Target 3: 4410 (final top channel line)
Trigger: bullish rejection or bullish engulfing from 4122–4140.
❌ Bearish Case 📉 (Invalidation)
Break and 4H close below 4052 (Invalid zone):
🎯 Downside Target: 3990 → 3920 strong support
Current Levels to Watch
Resistance 🔴: 4320 / 4380 / 4410
Support 🟢: 4140 / 4122 (Entry Zone)
Invalidation: 4052
⚠️ Disclaimer: This analysis is for educational purposes only. Not financial advice.

XAUUSDHello Traders! 👋
What are your thoughts on GOLD?
Gold is once again moving toward its previous all-time high after completing a corrective move.
While the medium-term and long-term outlook remains bullish, we do not expect gold to break into new highs in the short term.
The current upward movement appears to be a corrective rally, and we anticipate a bearish reaction from the marked resistance zones.
Gold is currently moving within a channel, and the maximum upside expectation in this phase is a move toward the channel top, which also aligns with the previous all-time high resistance zone.
From this confluence area, we expect the rally to stall and a pullback toward lower support levels to begin.
If gold breaks above the channel top and prints a new all-time high, this analysis becomes invalid, signaling stronger bullish momentum than anticipated.
Don’t forget to like and share your thoughts in the comments! ❤️

Gold buy idea Gold Analysis
Gold stopped falling around 12 AM, forming a series of higher lows and lower highs. Price then changed character at 4199, where a 30m candle showed strong rejection with high volume, signaling potential bullish continuation.
How to Trade It
1️⃣ Wait for the 30m candle to close
You need confirmation that the rejection is valid and buyers are stepping in.
2️⃣ Drop to the 15m timeframe
Wait for the 15m candle to close as a bullish engulfing candle with strong volume.
This confirms momentum and validates the shift in structure.
Targets (TPs)
TP1: 4207
TP2: 4222
Invalidation
❌ If the 15m candle closes below the previous 15m candle, do not take the trade.
This signals weakness and invalidates the setup.

XAU/USD | Another Bullish Leg Possible! (READ THE CAPTION)By analyzing the #Gold chart on the 4 hour timeframe, we can see that price made a strong bullish jump today, pushing all the way up to $4264 before showing signs of exhaustion and pulling back. This reaction is typical after such an aggressive move, especially when price taps into short-term liquidity pockets and meets intraday supply zones.
Right now, TVC:GOLD is trading around $4228, which keeps the overall bullish structure intact. The key level to watch remains $4187, as long as price holds above this zone and doesn’t break it with a strong 4H candle close, the bullish scenario stays valid. This level is acting as both structural support and a demand area from the last impulsive move, so buyers will likely attempt to defend it.
As long as we stay above that support, we can expect the market to build another wave of bullish momentum. The next upside targets remain the same, with potential reaction zones at:
• $4240
• $4250
• $4260
• $4272
Each of these levels represents short-term liquidity pockets and minor supply areas where price may pause, react, or give another continuation setup. If bullish pressure stays strong, TVC:GOLD can attempt another push into the upper range after clearing intraday resistance levels.
Overall, the trend is still bullish as long as $4187 holds, and higher targets remain in play unless we see a deeper breakdown or a sharp shift in momentum.
Please support me with your likes and comments to motivate me to share more analysis with you and share your opinion about the possible trend of this chart with me !
Best Regards , Arman Shaban

XAUUSD: Gold Wave HarmonyXAUUSD: Gold Wave Harmony
According to its wave structure, gold is completing a correction phase and preparing to form a new impulse. The chart shows a transition from sideways movement to a more dynamic wave, which could set the direction for the near term.
Main scenario: after the correction ends, a downward impulse sequence is expected to develop. Alternative scenario: if the market consolidates above recent highs, it could continue to rise, delaying the start of a new downward wave.
Idea for traders: watch for confirmation of the structure on lower timeframes and enter only after clear reversal signals appear.
Risk management: use clear stop levels and adjust the plan as new impulses emerge.
Friends, more wave analysis is available in our profile.
Subscribe to stay up to date with wave analysis!

Long-term analysis of goldAfter a strong rally, gold is now in a corrective move in the direction of the trend, which itself is a continuation signal. We can see that the price is moving along a trendline and has reacted to this support twice before. There is a good chance it will react to this trendline again, and that in itself counts as a solid trigger. If the price reaches the trendline, we should also be careful about a breakout or a fake breakout of that support.
This is a long-term analysis and may take about one week to ten days to play out, but it gives us a clear outlook on how to open positions on the lower timeframes.

Gold Analysis Today: Continue Buying at 4210Gold Analysis Today: Continue Buying at 4210
As shown in the chart: Current Strategy:
Buy Price: 4210
Stop Loss: 4195
Take Profit: 4230-4260
Gold prices are currently in a consolidation phase. As long as the price remains above $4195, our current strategy is to buy on dips.
The $4180-$4200 range is undoubtedly a strong support area and will become the fulcrum for the next significant upward move.
I share real-time trading signals daily on my public channel, aiming to provide a learning platform for many confused traders. My trading strategy is very clear. Looking forward to your attention and cooperation.

Gold Pullback or Breakout? Sitting at the Edge of a Bigger MoveGold Pullback or Breakout? XAUUSD Sitting at the Edge of a Bigger Move
Gold is coiling in a narrowing channel, and this kind of structure usually ends with a sharp directional break. The chart shows buyers trying to defend the mid-zone, while the broader trend still leans corrective. With macro fundamentals shifting fast and volatility picking up around U.S. data, gold is getting primed for a move that won’t stay quiet for long.
Current Bias
Short-term neutral leaning bullish.
Medium-term bullish if buyers defend the lower channel and reclaim the upper trendline.
Key Fundamental Drivers
• US inflation and labour data are softening (per recent BLS and ADP reports), reducing expectations of aggressive Fed tightening. This generally supports gold.
• US yields have eased from recent highs, reducing opportunity cost of holding gold.
• Geopolitical tensions (Middle East, Ukraine, South China Sea) are keeping a haven bid under gold.
• Strong central-bank buying continues to act as a long-term floor for gold prices.
• USD movement remains the dominant short-term driver.
Macro Context
• Interest rate expectations: Markets are pricing a slower Fed path, especially after soft labour prints and cautious speeches from Cook and other Fed officials. A stable-to-mildly-dovish Fed environment supports gold.
• Global growth trends: Europe remains in a slowdown according to Sentix, while Asia shows modest improvement. Weak global growth tends to boost gold.
• Commodity flows: No supply shocks, but ETF outflows are stabilizing—another supportive sign.
• Geopolitics: Israel–Lebanon escalation risk remains in play. Several global risk headlines recently helped gold find intraday support.
Primary Risk to the Trend
A strong USD rally—especially if driven by unexpected U.S. data strength or hawkish Fed comments—would pressure gold back into deeper corrective territory.
Most Critical Upcoming News/Event
• US FOMC speakers (multiple appearances)
• US CPI revisions and PPI data
• US unemployment claims and PMIs
These will decide whether yields move higher again or give gold room to rally.
Leader/Lagger Dynamics
Gold is usually a lagger to:
• USD direction
• US yields
• Fed expectations
But becomes a leader during periods of heavy geopolitical risk, when it pulls safe-haven assets like CHF and JPY with it.
Right now, XAUUSD is following USD and yields more closely than risk sentiment.
Key Levels
Support Levels:
• 4,000 – 3,985 zone (major demand area)
• 3,960 (channel low / liquidity sweep potential)
Resistance Levels:
• 4,115 – 4,135 (mid-range supply)
• 4,245 (major resistance + previous high)
Stop Loss (SL):
• 3,960 (below channel structure)
Take Profit (TP):
• TP1: 4,115
• TP2: 4,245
Summary: Bias and Watchpoints
Gold is building energy inside a narrowing channel, and the next macro catalyst will likely determine the breakout direction. My bias is neutral-to-bullish as long as price holds above the 4,000 zone and avoids a breakdown toward 3,960. The key drivers are weakening U.S. data, softer Fed expectations, and a stable-to-higher geopolitical risk backdrop. The biggest risk is a USD rebound powered by hotter-than-expected U.S. numbers. The most important event ahead is the cluster of U.S. inflation and labour releases, which will directly influence yields and therefore gold. Stops sit cleanly below 3,960, and the natural upside magnet remains 4,115 first, then 4,245 if momentum builds.
GOLD Local Long! Buy!
Hello,Traders!
GOLD price is approaching the demand imbalance and is likely to retest the mitigation zone before expanding higher, targeting resting liquidity above the short-term swing levels. Time Frame 2H.
Buy!
Comment and subscribe to help us grow!
Check out other forecasts below too!
Disclosure: I am part of Trade Nation's Influencer program and receive a monthly fee for using their TradingView charts in my analysis.

XAUUSD – Potential Bullish Reversal Zone FormingPrice is currently trading above a key demand zone around the 4170–4185 region. This area has previously acted as strong support, and market reactions here suggest that buyers are still defending it. The recent push into this zone combined with the rejection wicks indicate potential accumulation.
Price is hovering around the 4200 psychological level, and if we see a deeper retest into demand, the structure allows for a possible bullish continuation scenario.

Gold is bullish – another perfect day!Gold Technical Analysis: Looking at the current trend, gold rebounded after testing the lows again today. We are treating it as a range-bound market. We recommended buying around 4185-4170, which was reached multiple times. Gold has now surged as expected, with the next resistance level around 4230-4240 USD.
Gold has recently experienced a slight dip, but this doesn't affect the bullish trend; in fact, it could be the start of a bullish rally. Gold prices only rebound after a dip; they won't bounce back from where they are. Therefore, this dip presents an opportunity for the bulls to exert their strength. On the daily chart, the price is still holding above the moving average. Although it closed with a bearish candlestick, the lower shadow indicates a clear nightmare for the bears. It has consistently held above the support line. The previous low was around 4164, followed by a rise to around 4241, and today's pullback to around 4175. Clearly, the lows are continuously rising, and the slope remains upward. We continue to watch the 4230-4240 area!

Gold: Pullback in Place — Ready for the Next Leg Up1. Market Structure
- On the H1 we see a sequence of Higher Lows (HL) and occasional Higher Highs (HH) — structure is overall bullish.
- A short-term Break of Structure (BOS) lower occurred earlier, but price recovered and re-established HLs, showing buyers defending support.
- Current action is a retest/pullback into the marked entry circle where trend support, a micro HL, and previous reaction converge — classic break→retest environment for continuation.
2) Key Levels
- Entry / Decision Zone (circled): ~4,195 – 4,200 (area of trend confluence).
- Immediate Support (stop area): 4,181 (invalidation if weekly/4H candles close below).
- Major Support below: 4,163 (deeper invalidation / structural change).
- First Target / Minor Resistance: 4,225 (mid-term take-profit).
- Extended Target / Higher Liquidity: 4,266+ (larger swing target).
3) Scenarios
Main (High-probability) — Bullish Continuation
- Condition: price holds the entry circle and the HL structure remains intact.
- Plan: look for bullish confirmation (tight range breakout / bullish engulf / clean H1 close) in the entry zone.
- Targets: TP1 4,225 → TP2 4,266+.
SL: below 4,181 (protect capital if structure fails).
Alternative (Low-probability) — Deeper Correction / Bearish
- Trigger: decisive 4H/1H close below 4,181 and then below 4,163.
- Outcome: structure flips to lower lows → expect drop toward lower support zones and stop hunting.
- Action: avoid new longs; wait for re-accumulation.
4) Summary
- Gold is showing a textbook pullback into structural support — this is where trend-followers prepare, not panic. If price respects the circled entry and gives a clean bullish confirmation, the path to 4,225 → 4,266+ is the high-probability play.
Remain disciplined: protect capital at 4,181 and only add when price confirms the turn.
Trade the structure, not the noise — discipline turns good analysis into real profit.
