Is Gold Just Resting — or Ready to Rise Again?Hello traders, let’s take a look at XAUUSD together today!
At the moment, XAUUSD looks like a wave pulling back only to gather momentum — not weakening, but preparing for the next upward move . After hitting a six-week high, gold is seeing some light profit-taking, but the macro backdrop still leans strongly toward the bulls: the Fed is sending dovish signals , the USD is weakening, and soft U.S. data continues to support this mild bullish trend .
Looking at the chart, price was previously rejected at the upper resistance zone and has now pulled away from the descending resistance line. Even so, the overall bullish structure remains intact . Gold is heading toward the 4,170 support zone, which aligns with a strong previous reaction area — and may dip slightly deeper into 4,120, a confluence of old lows and a strong rejection zone. These are the two areas where buyers are most likely to return .
The high-probability scenario: XAUUSD taps 4,170, forms a consolidation base, and then rebounds toward 4,250. If sellers push price further to 4,120, this will become the last critical support before gold triggers its next upward wave. Only a clear break below 4,120 would significantly threaten the mild bullish outlook.
For now, the main story remains unchanged: gold is correcting, not reversing . And every pullback toward support continues to be an opportunity to watch for the buyers’ return — to fuel the next bullish leg in the days ahead.
Trade ideas

Selena | XAUUSD 2H — Bullish Continuation SetupFOREXCOM:XAUUSD
Market Overview
Price has built liquidity through multiple sweeps and consolidations, suggesting a possible continuation phase. If price retests the demand zone and holds, buyers may step in to push toward upper structure resistance levels.
Key Scenarios
✅ Bullish Case 🚀
If price holds above 4,157 zone
→ 🎯 Target 1: 4,300
→ 🎯 Target 2: 4,375–4,400 (major resistance / channel top)
❌ Bearish Case 📉
Break and close below 4,052 invalidation zone
→ 🎯 Downside Target: 4,000–3,950 support range
Current Levels to Watch
Resistance 🔴: 4,300 | 4,375–4,400
Support 🟢: 4,157 | 4,122 (demand zone)
Invalidation ⚠️: 4,052
⚠️ Disclaimer: This analysis is for educational purposes only — not financial advice.

Accumulated price increase - bulls expect rate cut⭐️GOLDEN INFORMATION:
Expectations of further Fed rate cuts and inflation still above target continue to underpin gold and silver, said David Meger, director of metals trading at High Ridge Futures.
However, China’s physical gold demand has weakened at elevated price levels, which could weigh on the metal. According to the Financial Times, major retail chains have scaled back their presence in mainland China this year, while smaller sellers report that soaring prices and higher taxes have severely hurt sales.
⭐️Personal comments NOVA:
Gold price took H1 4193 breakout liquidity and reacted bullishly, still maintaining the uptrend, continuing to expect December rate cut
⭐️SET UP GOLD PRICE:
🔥SELL GOLD zone: 4274 - 4276 SL 4281
TP1: $4260
TP2: $4245
TP3: $4230
🔥BUY GOLD zone: 4145 - 4143 SL 4138
TP1: $4160
TP2: $4175
TP3: $4190
⭐️Technical analysis:
Based on technical indicators EMA 34, EMA89 and support resistance areas to set up a reasonable BUY order.
⭐️NOTE:
Note: Nova wishes traders to manage their capital well
- take the number of lots that match your capital
- Takeprofit equal to 4-6% of capital account
- Stoplose equal to 2-3% of capital account

XAUUSD – 30m | Channel Break → Retest → Bearish Liquidity Sweep OANDA:XAUUSD
The 4,240 resistance remains a strong rejection point, with price now trading inside a lower-timeframe distribution. Liquidity sits below 4,177 and 4,155 where previous reaction points remain untested. As long as market holds beneath 4,240, the downside continuation remains the more probable scenario.
Key Scenarios
📉 Bearish Continuation (Primary Plan)
Confirmation: Lower-high → rejection from 4,210–4,220
🎯 Target 1 → 4,177.5 (Liquidity sweep)
🎯 Target 2 → 4,155 (Support zone base)
📈 Bullish Invalidation
A clean break and hold above 4,240 would flip the structure bullish again.
Current Levels to Watch
Resistance 🔴: 4,240.677
Support 🟢: 4,177 | 4,155
⚠️ Disclaimer: This analysis is for educational purposes only — not financial advice

GOLD: With FED officially ending the QT, Further Upside.For TVC:GOLD – Expecting Further Upside
With the FED officially ending Quantitative Tightening (QT) and a high probability of a rate cut in December, combined with expectations of a new FED Chair, the macro environment is supporting GOLD.
Add to this the historical seasonality where gold tends to perform strongly into year-end, and the overall picture remains bullish.
🔹 Lower interest rates = weaker USD and stronger gold
🔹 End of QT = more liquidity flowing back into markets
🔹 Geopolitical uncertainty + risk hedging continues to support safe-haven assets
🔹 Bond yields showing signs of topping, reducing pressure on gold
Based on these factors, we expect GOLD to push up and potentially make new highs.
Always remember WTW 4 Golder Rules:
1) Do not jump in
2) Do not over risk/trade
3) Do not trade without Stop Loss
4) Never ever add to a losing position!
Trade with care
We Trade Waves
WTW Team
Disclosure: We are part of Trade Nation's Influencer program and receive a monthly fee for using their TradingView charts in our analysis.

1205 XAUUSD 4-Hour Chart Trading Plan for EU/US SessionsHello traders,
1. Harmonic Pattern Identification (Left 4-hour Chart)
This is a bullish Butterfly Pattern, confirmed by the following key ratios:
- AB leg: Retraced ~0.78 of the XA leg (aligns with the typical 0.786 retracement for Butterfly patterns).
- BC leg: Retraced ~0.845 of the AB leg (close to the standard 0.886 retracement for this pattern).
- CD leg: Extended ~1.333 of the BC leg (falls within the 1.27–1.618 extension range required for a valid Butterfly setup).
2. Trading Plan (US/EU Session, Dec 5)
Primary (Bullish) Strategy
- Entry: Buy in the 4,200–4,210 zone (near EMA support/short-term consolidation).
- Stop Loss: Below 4,180 (breaks recent rebound low + daily Doji support).
- Targets:
1. First: 4,245 (daily resistance ).
2. Second: 4,265 (4-hour chart’s marked Butterfly TP2 resistance).
3. Risk Note
Today is Friday + pre-Fed meeting (Dec 9–10) → volatility may rise. Use strict stop-losses (15–20 pips) and avoid over-leveraging.
GOOD LUCK!
LESS IS MORE!

Check the trend It is expected that within the specified resistance levels, a trend change will take place and we will witness the beginning of a correction. If the price crosses the 78.6% level, the continuation of the upward trend will be likely.


XAUUSD: Market Analysis and Strategy for December 5th.Gold Technical Analysis:
Daily Resistance: 4300, Support: 4145
4-Hour Resistance: 4245, Support: 4180
1-Hour Resistance: 4230, Support: 4210
The daily candlestick closed with a doji pattern in the previous trading day, providing confidence for a short-term bullish trend. However, the price action over the past week has lacked continuity, requiring caution as it may revert to a range-bound pattern. Moving averages maintain a bullish structure, Bollinger Bands are narrowing, and the price fluctuated around the 4200 level during the Asian session. The upper resistance level is in the 4245-4250 area; a successful breakout will be crucial for a short-term upward move. Key support is around 4145.
Looking at the 1-hour chart, the price encountered resistance after breaking out of the new triangle pattern, again facing resistance around 4230. The hourly chart shows a bearish pullback pattern, with short-term support around 4210. A short-term sell-off could be considered now, but caution is advised. Buying on a pullback to the 4186-4180 level would maximize profits.
Trading Strategy:
SELL: 4225~4230
BUY: 4186~4180
More Analysis →

GOLD DAILY Gold (XAU/USD) – Technical Analysis (Daily Chart)
1. Main Trend
Gold has been in a strong bullish uptrend for several months.
The price is trading above the:
50-day MA (green)
100-day MA (red)
200-day MA (blue)
This confirms long-term bullish structure.
However, recently the trend has shifted into sideways consolidation after reaching a peak.
2. Current Market Behavior
Consolidation Range
Price is moving inside a large horizontal range, shown in the big orange box.
Several wicks and choppy structure indicate market indecision.
The consolidation started after hitting the high near 4381–4384.
Repeated Rejection at Resistance
The horizontal resistance zone at ~4380–4390 has rejected price multiple times.
This increases the probability of a bearish correction.
3. Fibonacci Levels
The chart includes various Fibonacci retracement levels:
0.25 (4195)
0.5 (3861)
0.75 (3602)
1.0 (3342)
These levels mark potential support zones where price could retrace during a correction.
4. Bearish Setup
The drawn short position shows a planned move:
Entry: near the top of the consolidation
Stop-loss: above the resistance
Target: near the 0.75 to 1.0 Fibonacci zone (3600–3340)
Risk/Reward
The R/R ratio is 6.64, meaning the expected reward is significantly higher than the risk.
Bearish Projection Path
The drawn red path suggests:
Initial drop from resistance
A small bounce
A strong continuation downward
A deeper correction reaching the lower green support zone
Final reversal upward from major support
This scenario is expected to unfold over 28 bars (40 days).
5. Support Zones
Key support areas are highlighted:
3600 – 3860 → first major support
3340 – 3400 → final deep support (target zone)
The green box shows the projected landing zone for the bearish movement.
6. Momentum Indicator
The histogram at the bottom shows declining bullish momentum.
This often appears before a trend reversal or correction.
7. Summary of Interpretation
Gold reached a major top and has entered consolidation.
Resistance remains very strong at 4380–4390.
A bearish correction is likely, potentially deep.
The chart projects a multi-wave drop over the next 40 days.
Long-term trend stays bullish, but a short-term drop is expected.

XAU/USD – Intraday AnalysisXAU/USD – Intraday Analysis: Sideways Structure and High-Probability Trade Levels
Gold continues to move inside a clear range-bound structure, respecting both the upper supply zone and the lower demand zone on the H1 timeframe. The chart shows repeated swing rejections at the top of the range, suggesting that buyers are losing momentum while liquidity continues to build above the equal highs.
The market is forming a harmonic zig-zag pattern with lower-timeframe exhaustion signals, and price remains below the 9-EMA, indicating short-term bearish pressure. Until price breaks out convincingly, intraday traders should continue focusing on trading the edges of the range.
Key Technical Levels
Resistance Zone (Sell Zone)
4235 – 4242
This zone has been tapped multiple times with strong rejection wicks.
Liquidity rests above the equal highs, making this area ideal for short setups if price sweeps liquidity and fails to break structure.
Support Zone (Buy Zone)
4168 – 4175
Strong reaction area where buyers defended the range low multiple times.
Watch for liquidity sweep followed by bullish reversal confirmation.
Technical Confluence
1. Trendline Reaction
Price is respecting the descending internal trendline, suggesting continuation of the bearish leg if 4205–4210 fails to break.
2. Fibonacci Confluence
The upper resistance aligns with 0.786 – 0.886 Fibonacci retracement of the previous downswing.
The lower support aligns with the 1.0 – 1.272 Fibonacci extension of the corrective leg.
3. EMA Structure
Price is trading below the 9-EMA, confirming the short-term bearish bias.
EMA acts as dynamic resistance inside the range.
4. RSI Behavior
RSI repeatedly rejects the 60–70 zone, indicating a weakening bullish attempt.
Neutral RSI at mid-range supports the sideways scenario.
Intraday Trading Strategy
Scenario 1 – Sell the Range High (High Probability)
Plan:
Wait for liquidity sweep above 4235–4242
Look for bearish engulfing or BOS (Break of Structure) on M15
Enter short targeting:
TP1: 4205
TP2: 4188
TP3: 4170 (range bottom)
This aligns with the projected pattern on the chart.
Scenario 2 – Buy the Range Low
Plan:
Wait for price to sweep 4168–4175
Enter only if bullish confirmation shows (pin bar, BOS, or bullish FVG fill)
Targets:
TP1: 4200
TP2: 4220
Scenario 3 – Bearish Breakout
If price rejects the upper zone and breaks below 4170, momentum may accelerate downward.
Targets below 4170:
4150
4135
Market Outlook
Gold continues to consolidate, and this phase typically leads to an explosive move. Until a breakout occurs, trading inside the range edges provides the best risk-to-reward setups.
If you find this analysis helpful, save it and follow for more daily strategies and updated market structure insights.

gold alsdaa bulliish baga tsag deeer short ariljaa harj bngold alsdaa bulliish baga tsag deeer short ariljaa harj bn

Gold 30-Min — Volume Sell Reversal Triggered⚡Base : Hanzo Trading Alpha Algorithm
The algorithm calculates volatility displacement vs liquidity recovery, identifying where probability meets imbalance.
It trades only where precision, volume, and manipulation intersect —only logic.
✈️ Technical Reasons
/ Direction — SHORT / Reversal 4215 Area
☄️Bearish rejection confirmed through sharp candle body.
☄️Lower-high forming beneath resistance supply region.
☄️Volume decreasing confirms exhaustion in price rally.
☄️Sellers regained imbalance with heavy top rejection.
☄️Algorithm detects fading demand and shift to control.
⚙️ Hanzo Alpha Trading Protocol
The Alpha Candle defines the day’s real control zone — the first battle of momentum.
From this origin, the Volume Window reveals where the next precision strike begins.
⚙️ Hanzo Volume Window / Map
Window tracked from 10:30 — mapping true market behavior.
POC alignment exposes institutional bias and breakout potential zones.
⚙️ Hanzo Delta Window / Pulse
Delta window monitors real buying vs. selling power behind each move.
Tracks volume aggression to expose who controls the candle — buyers or sellers.
When Delta aligns with Volume Map, momentum becomes undeniable.

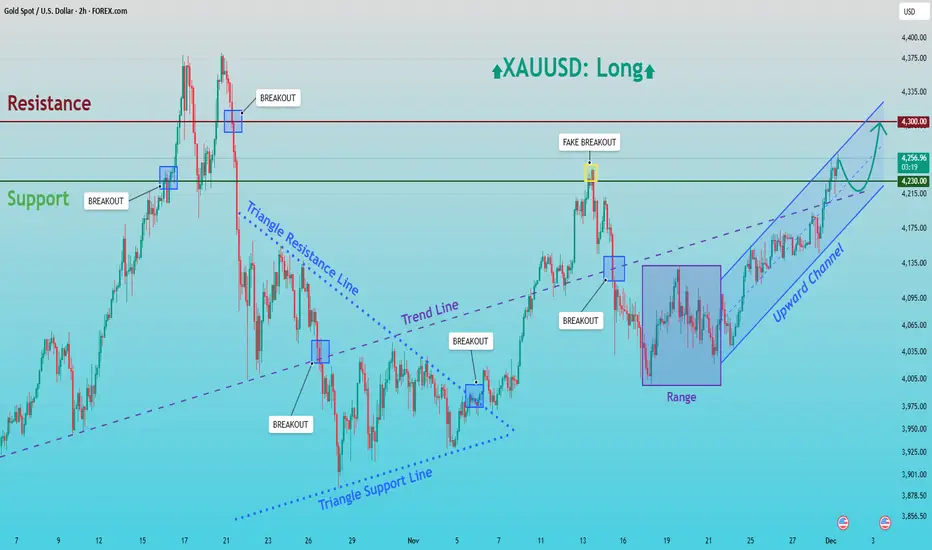
XAUUSD: Buyers Eye Retest of the $4,300 Resistance ZoneHello everyone, here is my breakdown of the current XAUUSD setup.
Market Analysis
Gold continues to trade within a well-structured bullish environment following a strong recovery from the lower Triangle Support Line earlier in the month. After a prolonged corrective phase inside a symmetrical triangle, price eventually broke above the Triangle Resistance Line, shifting the market structure from consolidation into bullish continuation. This breakout created a clear trend shift, supported by a steady sequence of higher highs and higher lows. After the breakout, XAUUSD entered a temporary Range phase, suggesting accumulation from buyers before the next impulsive move. Once price broke out of that range to the upside, the market formed a clean Upward Channel, showing sustained bullish pressure. A notable fake breakout above the Resistance Zone around 4,260 occurred recently, indicating strong seller activity at the top of the zone, but buyers quickly regained control and continued to push price upward within the channel.
Currently, gold is trading near the mid-upper area of the Upward Channel, approaching the 4,300 key Resistance Zone. The broader technical picture shows clear bullish market structure, with trendline support and channel dynamics favoring further upside as long as the channel remains intact.
My Scenario & Strategy
My scenario is bullish, supported by the strong rebound within the Upward Channel and the consistent higher-low structure. As long as price remains above the 4,215–4,230 Support Zone and respects the channel’s lower boundary, buyers hold a clear advantage. My expectation is that XAUUSD may make a minor pullback toward the mid-channel zone near 4,230 to gather liquidity before continuing the upward movement.
Therefore, the primary bullish target remains the 4,300 Resistance Zone, where a retest is highly probable. A clean breakout above 4,300 would open the door for a stronger rally and signal continuation of the broader bullish cycle. However, if gold fails to break the resistance and forms a deeper correction, the Upward Channel support and the prior breakout zone at 4,215 will be key levels to watch. The bullish bias remains valid as long as these supports hold. For now, the structure favors a long scenario with attention on the move toward 4,300 and potential bullish continuation beyond that level.
That's the setup I'm tracking. Thank you for your attention, and always manage your risk.

GOLD Demand Zone Rejection & Bullish Reversal pullback Price is retesting the strong demand zone 4195 4190 and showing signs of a potential bullish reversal toward the upper supply area 3240 4245

GOLD (1H) – Bullish Continuation Above Support | Premium Market GOLD (1H) – Bullish Continuation Above Support | Premium Market Structure
Gold delivered a strong impulsive rally and is now holding elegantly above a clean support zone. Price behaviour suggests controlled accumulation, with buyers defending structure after the expansion.
Key Zones
Support Zone 1: 4210–4220
Support Zone 2: 4175–4185
Resistance: 4335–4340
Market Structure
The current retracement remains shallow, maintaining higher-low structure. Price has reacted exactly at the first support zone, signalling strength. A sustained break above 4240 may open room for a continuation into the 4330+ resistance band.
Bias
📈 Bullish as long as 4210 holds.
Liquidity is still intact and orderflow favours another leg higher.
Potential Setup (Not Financial Advice)
Entry Zone: 4215–4230
Targets: 4310 / 4335
Invalidation: Below 4175
Summary
Gold retains a premium bullish structure. Support is respected, liquidity protected, and continuation potential remains high unless deeper displacement occurs.
Disclaimer: Educational analysis only.

BUY XAUUSDXAUUSD last minute entry for a bullish move back up to 4250 resistance area. Price looks to be moving up away from the M15 support area.

GOLD Sellers In Panic! BUY!
My dear followers,
I analysed this chart on GOLD and concluded the following:
The market is trading on 4192.4 pivot level.
Bias - Bullish
Technical Indicators: Both Super Trend & Pivot HL indicate a highly probable Bullish continuation.
Target - 4205.9
Safe Stop Loss - 4184.7
About Used Indicators:
A super-trend indicator is plotted on either above or below the closing price to signal a buy or sell. The indicator changes color, based on whether or not you should be buying. If the super-trend indicator moves below the closing price, the indicator turns green, and it signals an entry point or points to buy.
Disclosure: I am part of Trade Nation's Influencer program and receive a monthly fee for using their TradingView charts in my analysis.
———————————
WISH YOU ALL LUCK

XAUUSD update 1h Chart The price is in a short-term ascending channel, marked by your blue parallel lines. The candles show consistent higher highs and higher lows, confirming bullish momentum.
2. Key Levels Highlighted on Chart
Upper resistance zone: ~ 4265–4280
(Thick purple zone at the top; price is approaching this area)
Lower support zone: ~ 4160–4180
(Thick purple zone at the bottom)
These zones indicate past strong reactions (buying and selling pressure).
3. Price Reaction Expectation
The blue drawing shows two potential scenarios:
Scenario A – Bullish breakout
If price breaks above the channel + resistance zone, then:
This signals continuation of the uptrend.
Next upside target would likely be 4300+.
Scenario B – Bearish reversal (most likely according to your structure)
Your blue arrows suggest:
The price may touch the upper resistance, then reject.
A decline toward the 4204 area first (minor support).
Further drop into 4160–4180 (major support zone).
This aligns with:
The rising wedge–like structure (which often breaks down)
Exhaustion at a high-timeframe resistance.
4. Indicators on Chart
Red arrow signal at prior top → selling pressure.
Green arrow signal near bottom → buying pressure.
These confirm that the purple zones are strong supply/demand.
5. What the Structure Suggests
The pattern looks like a bearish rising wedge, which typically breaks downward. If price stalls or prints long wicks near the 4260–4280 zone, a correction is likely.
---
📉 Summary
Most probable path:
✔ Price tests upper resistance → rejects → drops toward 4200 and then 4170 support.
Alternative:
✔ Strong breakout above 4280 → bullish continuation.

XAUUSD- Volume Profile AnalysisAt first glance, the chart may look a bit busy, but the structure is actually quite straightforward once you peel it off layer by layer.
The Fall
We start with the sharp October liquidation on the left. The volume profile over that entire downswing sets up a clean VAH-1, VAL-1, and POC-1, which are our key reference points for everything that follows.
Early November Rally
Early November price action is classic: price bases right around VAL-1, absorbs supply, and then launches into a swift breakout toward VAH-1. Textbook rotation from value-low to value-high.
Importance of VAH
VAH-1, as expected, caps the move and triggers a pullback right into the POC-2 of the November advance, which also happens to overlap with the prior breakout zone. A high confluence area where buyers stepped back in.
The Sharp Pullback to Retest
Price then coils around VAH-2, grinds higher, and retests VAH-1 but only to resist again. That repeated inability to hold above VAH-1 is a sign of pullback.
A Perfect Alignment
POC-3 and POC-4 line up almost perfectly, creating a stacked POC shelf and hence a structurally important zone. Add to that an active ascending trend channel that has been containing the structural swings also aligns with the POC shelf.
Potential Setup
Given this alignment, the 4075–4100 region becomes a potential demand pocket or a zone that could attract responsive buyers on any pullback, offering a comparatively low-risk long setup.
On the flip side, price could simply squeeze higher from current levels, ripping past 4250 into the old highs. But that scenario doesn’t offer favorable risk-to-reward for fresh longs as the risk of breakout failure remains high in an extended market.
But the real question is-
How do you read this tape? Are we staring at the late stages of a tired rally, or shaping up for a classic pullback-and-continuation structure?
Share your thoughts in the comment section below.
Thanks for reading.
📣Disclaimer:
Everything shared here is meant for education and general awareness only. It’s not financial advice, nor a recommendation to buy, sell, or hold any asset. Do your own research, manage your risk, and make sure you understand what you’re getting into.

XAUUSD(GOLD): View Remain The Same Major Swing Sell! Gold dropped to $4030 today, filling up the liquidity gap. However, it reversed nicely. Looking at smaller time frames, we notice heavy selling pressure, which is likely to push the price down towards our target one or two, if fundamentals support the view. Furthermore, we believe the price still has a high chance of going around our top entry around $4380. That area remains a key level if the trend is bearish in the longer term. We advise you to wait for further correction before making any decisions.
Good luck and trade safely!
Team Setupsfx_🏆❤️

GOLD → Correction to support amid a bullish trend FX:XAUUSD retreated from the $4,245 level reached on Monday. A countertrend correction is forming ahead of the news. But buyers are not sleeping...
Weak US economic data has heightened expectations of an imminent Fed rate cut. The PMI index in the US manufacturing sector continued to contract. The market estimates the probability of the Fed easing policy next week at 87%.
However, rising US Treasury yields and fears that the Fed may send cautious signals after its December decision are limiting gold's growth.
Market attention is shifting to ADP employment data and the US services business activity index (ISM Services PMI), which will be released on Wednesday. They will provide new signals about the health of the US economy.
The correction in gold appears to be under control amid continuing macroeconomic uncertainty. The 4200, 4193-4173 level remains an important area of struggle between bulls and bears.
Resistance levels: 4211, 4245
Support levels: 4193, 4173
A false breakdown and the bulls holding the market above the above support zone could trigger growth within the trend.
Best regards, R. Linda!
