XAUUSD – 30m | Channel Break → Retest → Bearish Liquidity Sweep OANDA:XAUUSD
The 4,240 resistance remains a strong rejection point, with price now trading inside a lower-timeframe distribution. Liquidity sits below 4,177 and 4,155 where previous reaction points remain untested. As long as market holds beneath 4,240, the downside continuation remains the more probable scenario.
Key Scenarios
📉 Bearish Continuation (Primary Plan)
Confirmation: Lower-high → rejection from 4,210–4,220
🎯 Target 1 → 4,177.5 (Liquidity sweep)
🎯 Target 2 → 4,155 (Support zone base)
📈 Bullish Invalidation
A clean break and hold above 4,240 would flip the structure bullish again.
Current Levels to Watch
Resistance 🔴: 4,240.677
Support 🟢: 4,177 | 4,155
⚠️ Disclaimer: This analysis is for educational purposes only — not financial advice
Trade ideas

GOLD → Correction to support amid a bullish trend FX:XAUUSD retreated from the $4,245 level reached on Monday. A countertrend correction is forming ahead of the news. But buyers are not sleeping...
Weak US economic data has heightened expectations of an imminent Fed rate cut. The PMI index in the US manufacturing sector continued to contract. The market estimates the probability of the Fed easing policy next week at 87%.
However, rising US Treasury yields and fears that the Fed may send cautious signals after its December decision are limiting gold's growth.
Market attention is shifting to ADP employment data and the US services business activity index (ISM Services PMI), which will be released on Wednesday. They will provide new signals about the health of the US economy.
The correction in gold appears to be under control amid continuing macroeconomic uncertainty. The 4200, 4193-4173 level remains an important area of struggle between bulls and bears.
Resistance levels: 4211, 4245
Support levels: 4193, 4173
A false breakdown and the bulls holding the market above the above support zone could trigger growth within the trend.
Best regards, R. Linda!

Accumulation and recovery - resistance 4275⭐️GOLDEN INFORMATION:
Gold (XAU/USD) extends Tuesday’s rebound from the $4,164 zone in Wednesday’s Asian session, gaining fresh momentum and edging back toward Monday’s two-week high. The metal remains supported by expectations of another Fed rate cut next week, while speculation about a dovish successor to Chair Powell keeps the US Dollar subdued near a two-week low, further boosting the non-yielding asset
⭐️Personal comments NOVA:
Buying power remains above 4200, gold price recovers and grows. The market is waiting for today's ADP-NF results to continue increasing in price.
⭐️SET UP GOLD PRICE:
🔥SELL GOLD zone: 4275 - 4277 SL 4282
TP1: $4260
TP2: $4245
TP3: $4230
🔥BUY GOLD zone: 4193 - 4191 SL 4186
TP1: $4208
TP2: $4220
TP3: $4235
⭐️Technical analysis:
Based on technical indicators EMA 34, EMA89 and support resistance areas to set up a reasonable BUY order.
⭐️NOTE:
Note: Nova wishes traders to manage their capital well
- take the number of lots that match your capital
- Takeprofit equal to 4-6% of capital account
- Stoplose equal to 2-3% of capital account

Unfortunately, gold is about to fall.Hello Traders! 👋
What are your thoughts on GOLD?
Gold corrected upward as expected, reaching the top of the descending channel and the resistance zone, where it showed a clear price rejection.
In this region, gold is expected to show some consolidation and liquidity buildup, followed by a renewed bearish move toward the lower marked levels.
Political and geopolitical developments — especially talks and the possibility of a peace agreement between Ukraine and Russia — may accelerate this bearish movement.
As long as price fails to break above the resistance zone and the channel top, the short-term outlook remains bearish, and any upward correction should be viewed only as a pullback.
Don’t forget to like and share your thoughts in the comments! ❤️

Today gold reversal are you agree ? Trade Idea
Bias: BUY
Entry Zone: 4,185 – 4,197 (Demand Zone / Order Block)
Stop Loss: 4,184 (Below Demand Zone)
Take Profit Targets:
TP1 → 4,215
TP2 → 4,235
TP3 → 4,260
Why BUY?
Price is at a strong Demand Zone (support area).
Liquidity sweep below the zone may fuel a reversal.
Change of Character (ChoCH) forming on lower TF → short-term bullish signal.
Targets align with previous highs & supply zones (liquidity levels).
⚠️ Caution: Not financial advice. Trade carefully.

Going back to all time high?Gold has maintained a strong bullish trend, and recent price action continues to confirm this bias. After tapping into our higher-timeframe H4 POI from November 18, price reacted cleanly and established bullish continuation structure.
On the H1 timeframe, the reaction from the H4 zone created two well-defined demand levels. Price has recently tapped into the second H1 demand, showing renewed buying interest. This aligns with our bullish expectation as long as demand continues to hold.
Dropping to M15, price action shows a clear change of character (CHOCH), signaling a shift in momentum back to the upside. The strong bullish candle confirm that liquidity was collected before pushing upward.
At this stage, we anticipate continuation to the upside as long as structure remains intact and price respects our demand zones. Given the current momentum and reaction from higher-timeframe POIs, Gold shows the potential to push toward its all-time high again if bullish structure continues.
Our entry was from an H1 engulfing candle from the M15 demand zone
Key Bias: Long
Confluences:
H4 bullish continuation from November 18 POI
Two H1 demand levels formed
Price reacting from second H1 demand
CHOCH on M15
H1 engulfing entry from M15 demand
Strong potential for retesting all-time high
Looking for bullish continuation setups from refined demand zones on lower timeframes.

Will gold prices fall after a surgeWhat will become ofthe marketGold Technical Analysis: Today, the gold market was paralyzed due to a data malfunction on the CME Group, leading to the closure of all gold trading. Due to the Thanksgiving holiday, trading was relatively quiet, and overall price fluctuations were not significant. However, the overall trend remains bullish. Looking at the intraday price action, fundamental uncertainties exacerbated market sentiment volatility, but the overall trading range remained within the expected range of 4220-4155. This indicates that with the US market closed today, market sentiment remains cautious, not blindly following sudden fundamental developments or completely deviating from technical expectations. However, this also reflects the current market's lack of direction and the risk of sudden price movements due to other factors.
Gold is still trading within an upward channel on the hourly chart. A pullback to the lower channel support suggests a continued bullish trend. During the US session, gold is expected to fall back to 4160, presenting an opportunity to buy on dips. The hourly chart also shows gold at the upper edge of a range-bound pattern, potentially forming a support/resistance level. Support lies around 4160, the starting point of the morning's rise, which could become a key level for determining future direction. Key resistance is around 4220; a break above this level could lead to a challenge of the previous high near 4245. The recent upward movement after the open may be due to pent-up energy from the past two days of consolidation. Currently, the market trend leans towards an upward consolidation, so our trading strategy should focus on the bullish direction.In summary, the recommended trading strategy for gold is to primarily buy on dips and secondarily sell on rallies. The key resistance level to watch in the short term is 4240-4250, while the key support level is 4170-4160. Please stay tuned for further updates.

Gold Analysis & Trading Strategy | December 5–6✅ 4H Chart Trend Analysis
1️⃣ Strong spike then rapid reversal – forming a false breakout
A long upper shadow above 4259 indicates overheated bullish sentiment followed by aggressive selling → bullish momentum exhausted
2️⃣ Moving averages turning bearish
Price has fallen back below MA5 & MA10
➡️ Uptrend correction confirmed → short-term rebound ended
3️⃣ Price loses the Bollinger mid-band
Trading below the middle band shifts the structure into a weak consolidation zone
📌 As long as price fails to reclaim 4241–4245,
the mid-term outlook remains corrective, not bullish.
📊 1H Chart Trend Analysis
1️⃣ Sharp drop from highs with consecutive bearish candles
All previous bullish signals fully invalidated → bear trend established
2️⃣ Short-term MAs in bearish alignment
Price remains below MA5 / MA10 / MA20
➡️ Any bounce = sell opportunity
3️⃣ Lower Bollinger Band opening downward
→ Downward momentum still extending
🔴 Resistance Levels
4218–4222 (short-term rejection zone)
4235–4241 (major resistance — primary short entry zone)
🟢 Support Levels
4198–4202 (first support)
4185–4180 (break = accelerated downside)
4165–4163 (next key downside target)
🎯 Trading Strategy Reference
🔰 Main Strategy: Sell the Rebound (trend-following)
📍Entry Zone: 4218–4222
🎯Targets: 4205 / 4192 / 4185
⛔Stop-loss: Above 4230
🔰 Secondary Strategy: Breakout Short Entry
📍If price breaks 4198 with volume
🎯Targets: 4185 → 4165
⛔Stop-loss: Above 4208
⚠️ Not recommended to bottom-buy blindly
Any long trades must wait for a clear reversal signal.
📌 Trend Summary
Price fails to recover above 4235 Bearish bias remains — sell rallies
Price breaks below 4198 with volume Downside opens toward 4185–4163
Price reclaims 4241–4245 Trend may shift into stronger recovery
📌Current phase: Bull trap confirmed → corrective downtrend in progress

Gold (XAU/USD) Breakout Setup: Demand Zone Retest and Upside TarOverall Structure
The chart shows Gold Spot (XAU/USD) on the 30-minute timeframe, and it highlights:
A descending channel (blue parallel trendlines).
A support zone (yellow box).
A stop-loss zone (red area).
A long (buy) projection toward a high target point around 4,265.
1. Descending Channel
The price has been moving inside a clearly defined downward-sloping channel.
Currently, the price is:
Testing the upper boundary of the channel.
Showing signs of attempting a breakout.
This suggests momentum may be shifting.
2. Strong Support Zone (Yellow Box)
The highlighted yellow zone around 4177 – 4160 acts as:
A demand zone where buyers previously stepped in.
The chart suggests a potential retest of this area before a bullish push.
The projected price action line (blue sketch) shows:
Dip → retest support → breakout → rally.
3. Stop-Loss Zone (Red Area)
Under the yellow support sits a stop-loss / invalidation zone around:
4160.107 (marked explicitly)
This implies that if price drops below this level, the bullish scenario becomes invalid.
4. Bullish Target
The projected target is drawn high above the current price:
4265.369 – 4265.645
This is a large upward move, suggesting:
A breakout from the channel
A continuation to a new high
The vertical grey rectangle indicates the expected profit zone of the trade.
5. Trade Logic Implied by the Chart
Bullish thesis:
Step 1: Price dips back into 4177 → 4160 zone
Step 2: Buyers defend the zone
Step 3: Breakout above descending channel
Step 4: Rally toward 4265 target
This is a classic pullback-to-support before breakout structure.
Risk:
Break below 4160 invalidates the buy idea.
6. What This Chart Suggests
In summary:
Bullish signals:
A descending channel that often breaks upward after weakening momentum.
Strong demand zone highlighted.
Clear projection showing expected reversal and breakout.
Bearish risk:
If support fails, downside continuation is likely

XAUUSD KEY LEVELS 04-11Greetings
Hi traders, This is the crucial support zone for XAU-USD at 15 minute,
based on the movement of the day prior and market trends.
Support zone (White line)
Important levels:
4175.09 is the entry
Target: 4185.09
Stop loss: 4165.09
1:1 Risk-Reward Ratio
We are inspired to continue learning and exchanging ideas by your likes and boosts!

Gold Under Pressure, Watch the 4207 LevelIn recent days, gold has continued to fluctuate within the 4250–4160 range. Lifted briefly by the positive ADP report yesterday, the price broke above the 4228 resistance and spiked to 4240, only to retreat shortly after. During the subsequent swings, the 4216–4228 zone once again acted as a firm resistance, and as of today, the price has still failed to break above it.
On one hand, U.S. Treasury selling has pushed yields higher, Liquidity in the gold market has decreased. On the other hand, easing tensions between Russia and Ukraine have reduced safe-haven demand. The combination of these factors has kept the bullish momentum suppressed. Meanwhile, the stability of downside support comes from rising expectations of Federal Reserve rate cuts. These conflicting forces have led to the current range-bound price action.
From a technical perspective, the key level to watch remains the 4230 resistance. Should the price continue to face pressure here—without support from upcoming news or data—it may pull back to test the 4152–4133 zone. Trend support on the daily chart has now risen to around 4096.
For short-term trading, keep an eye on the 4203–4207 resistance area, which serves as the immediate barrier before another attempt toward 4216–4228. As long as the price can hold above 4206, upward pressure is likely to ease, opening the door for a move toward 4250–4270.
Strategically, the focus remains on buying dips, especially if the price pulls back below 4160, which offers a relatively favorable entry within a ranging market. If the price fails to break above 4216, short-term selling opportunities may appear, but traders should manage timing and risk carefully.

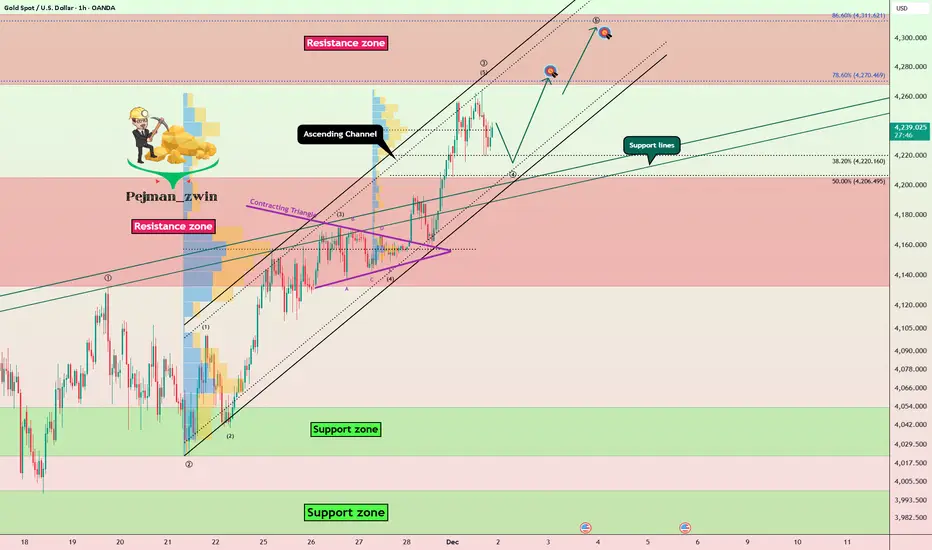
Gold Breakout + Wave Structure = New Targets LoadingGold( OANDA:XAUUSD ) has successfully broken through the Resistance zone($4,205 – $4,133) at the start of this new week, and over the past ten trading days, it seems to have formed an ascending channel.
From an Elliott Wave perspective, it looks like gold has completed wave 3 and is currently in the process of completing wave 4.
I expect that after a pullback toward the Resistance zone($4,205 – $4,133)—aligning with the lower line of the ascending channel and the support lines—gold will resume its upward movement and once again target the Resistance zone($4,316 – $4,261).
First Target: $4,266
Second Target: $4,294
Stop Loss(SL): $4,151
Note: Geopolitical tensions—especially the possibility of a direct confrontation between Venezuela and the U.S.—tend to push investors toward safe-haven assets, and gold historically reacts with strong upward momentum during such uncertainty. If this conflict escalates, increased risk aversion and volatility across global markets could support a bullish continuation in gold as capital shifts away from risk assets
💡 Please respect each other's opinions and express agreement or disagreement politely.
📌 Gold Analyze (XAUUSD), 1-hour time frame.
🛑 Always set a Stop Loss(SL) for every position you open.
✅ This is just my idea; I’d love to see your thoughts too!
🔥 If you find it helpful, please BOOST this post and share it with your friends.
(XAUUSD) - 4-Hour (4H) Timeframe | Path of Least ResistanceGold price action has completed a crucial test of structural support. Following the initial Breakout of the consolidation range, the market retraced to the demand zone, providing a key opportunity to assess institutional conviction. The subsequent price action confirms that demand is present at this level.
Technical Analysis and Key Observations
Structural Context: The higher timeframe structure remains bullish, established by the Breakout from the previous consolidation, which indicates a shift in momentum to the upside. The price movement is currently in a retracement phase of a major impulse.
Order Block (OB) Validation: The Lower Order Block (OB), which represents the origin of the last major buying pressure, has been repeatedly contacted by the price.
Observation: The multiple price rejections (wicks) off this OB confirm that the demand at this specific level is active and absorbing the selling pressure.
Conclusion: The retest of the structural support is considered complete.
Target Confluence: The path is now open for price to move toward the next major structural level, which is the Upper OB/Supply Zone located near $4,320. This area is expected to be the next point of major resistance.
The Trading Plan
The plan is based on the expectation that the confirmed support will hold and lead to a new high.
Invalidation Point
The bullish bias is invalidated if a 4-hour candle closes decisively below the $4,194.00 level. A close below this point would signal that the institutional demand has failed, and a deeper correction is required.
Disclaimer: This analysis is for educational and informational purposes only. It does not constitute investment advice or a recommendation to buy or sell any asset. Trading involves

Gold Slows at Channel Top — Market Targets 4,150 Before Move UpHello traders! Here’s my technical outlook on XAU/USD based on the current market structure. After breaking out of the broader consolidation phase, gold continued to move within a rising channel, forming consistent higher highs and higher lows along the Support Line. Buyers maintained strong momentum as the price pushed toward the Resistance Line, which aligns with the major Resistance Level near 4,240. However, after reaching this upper boundary, the market showed clear signs of exhaustion, indicating that buyers are struggling to push further into the resistance zone. This reaction suggests that the price may soon initiate a corrective move. At the moment, XAU/USD is trading inside a narrowing rising structure, with the Support and Resistance Lines converging, creating compression. As long as the price holds above the local Support Level around 4,150, the bullish structure remains intact. A pullback from the Resistance Line toward this area is the most likely short-term scenario before buyers attempt another push. This zone aligns with the first target TP1, which also acts as a key reaction zone from previous price behavior. A successful rebound from support could allow bulls to regain strength and attempt another test of the 4,240 resistance. If a breakout occurs, it would open the door for further bullish continuation. However, if the price fails to hold the Support Line or breaks back below the 4,150 zone, the structure may shift to a deeper correction, exposing gold to lower support areas. Please share this idea with your friends and click Boost 🚀

Gold Trade Set Up Dec 5 2025Gold has broken above PDH and tapped into a strong supply area with SSL, Low range liquidity and PDL below. So i will be looking for 5m-15m bearish engulfing and CISD to make a correction lower to sweep SSL

Gold - Coiling price action = Energy buildup!The Gold remains in a bullish trend, with recent price action showing signs of a breakout within the broader uptrend.
Support Zone: 4193 – a key level from previous consolidation. Price is currently testing or approaching this level.
A bullish rebound from 4193 would confirm ongoing upside momentum, with potential targets at:
4284 – initial resistance
4313 – psychological and structural level
4350 – extended resistance on the longer-term chart
Bearish Scenario:
A confirmed break and daily close below 4193 would weaken the bullish outlook and suggest deeper downside risk toward:
4161 – minor support
4134 – stronger support and potential demand zone
Outlook:
Bullish bias remains intact while the Gold holds above 4193. A sustained break below this level could shift momentum to the downside in the short term.
This communication is for informational purposes only and should not be viewed as any form of recommendation as to a particular course of action or as investment advice. It is not intended as an offer or solicitation for the purchase or sale of any financial instrument or as an official confirmation of any transaction. Opinions, estimates and assumptions expressed herein are made as of the date of this communication and are subject to change without notice. This communication has been prepared based upon information, including market prices, data and other information, believed to be reliable; however, Trade Nation does not warrant its completeness or accuracy. All market prices and market data contained in or attached to this communication are indicative and subject to change without notice.

$XAUUSD (XAU/USD 15m timeframe): GOLD (XAUUSD)OANDA:XAUUSD (XAU/USD 15m timeframe): GOLD (XAUUSD) – BUY SIGNAL
Current Price: ~$4,208 - $4,210 zone Entry: Market / Limit Buy around 4,205 – 4,212
Stop Loss: Below 4,190 (or recent swing low ~4,192)
Take Profit 1: 4,230
Take Profit 2: 4,240 – 4,250 (major selling/resistance zone) Reason: Price holding above key demand zone after retracement, bullish structure on lower timeframes, potential bounce toward previous highs/resistance.
40+ area (4,240–4,250) is strong supply zone → plan to take profits or trail stops there.#Gold #XAUUSD #TradingSignal #Forex Not financial advice – trade at your own risk. Always use proper risk management. DYOR.

Gold Uptrend: Retest 4,211 to Surge to 4,236 → 4,254After the Asian session, gold continues to maintain a short-term upward structure as prices consistently create higher lows (HL) and remain trading above the rising trendline. The weakening USD due to expectations of a dovish Fed is also supporting the flow of funds back into precious metals.
Currently, the market is entering a "compression" zone below resistance, signaling signs of accumulation before a new expansion phase.
📊 Technical Outlook – MMF Flow (H1)
1️⃣ Key Supports
4,211 – 4,212 → important retest zone + trendline confluence + previous HL low.
4,187 – 4,188 → deeper support, strong previous buying zone.
When prices hold above 4,211 → short-term trend remains bullish.
2️⃣ Key Resistances / Liquidity Zones
4,236 → nearby supply zone, liquidity cluster.
4,254 – 4,255 → expansion target, large liquidity zone above.
Prices are reacting at the descending trendline, but the upward momentum remains in control.
🧭 Trading Scenario according to MMF
▶️ Main Scenario – BUY with the trend
Wait for price retest:
🔹 BUY zone: 4,211 – 4,213
🔹 SL: below 4,206
🔹 TP1: 4,236
🔹 TP2: 4,254
Logic: Price breaks the intraday down structure, creates higher HL, and is gradually approaching the descending trendline → high breakout potential.
▶️ Alternative Scenario – Deeper BUY
If the market "flushes" to take liquidity:
🔹 BUY at 4,187 – 4,189
TP similar to the main scenario.
🎯 Daily Bias Summary
Bias: Bullish when prices hold above 4,211.
Priority: BUY at retest → SELL only for short-term scalping.
Target: 4,236 → 4,254 is a liquidity zone that the market can easily be pulled up to sweep.

XAUUSD Breakout Rejection – Bearish Correction SetupPrice recently experienced a strong bullish push into the Friday session, followed by a breakout and rejection at the highlighted zone. The breakout area (blue circle) shows exhaustion as buyers failed to maintain momentum, indicating a potential shift in market structure.
After the breakout, price is forming early signs of a bearish correction, suggesting a possible move lower. If bearish momentum continues, we may see price targeting the demand zone around 4201–4198, where previous liquidity and imbalance exist.
Key points:
• Breakout rejection shows weakening bullish sentiment.
• Expecting a short-term pullback if structure continues to break down.
• Main target zone lies within the blue demand area, where a reaction may occur.
This scenario remains valid as long as price stays below the breakout level.

HOT GOLD: PCE ENDS THE PARADOX!📰 Fundamental Analysis (FA): Opposing Forces
US Labor EXTREMELY STRONG (Lowest unemployment in 3 years, job reduction 53%) Leading to USD INCREASE.
Forecast of RATE CUT 85%+ (Next week) + Geopolitical risks Leading to STRONG SUPPORT for non-yielding Gold.
Decision Point: Await today's PCE Index data. Higher than expected PCE will be a strong shock for Gold!
🎯 Technical Analysis (TA):
Price is compressed within an accumulation range.
SELL Zone (Supply Zone): 4,220 - 4,231
Wait for reaction here to find Short opportunities.
BUY Zone (Demand Zone): 4,180 - 4,193
Wait for confirmation candles to find Long opportunities.
💡 Core Strategy
Market lacks clarity. Avoid big bets before PCE. Safe trading is to wait for a breakout or surf within the narrow range of 4,180 - 4,231 and manage risk tightly!
#XAUUSD #PCE #Gold #Forex #Trading

XAUUSD – Brian | Volume Profile & TrendlineXAUUSD – Brian | Volume Profile & Trendline: prioritize Sell, wait for a “good deal” in the liquidity zone
1. Market snapshot
On H1, gold is touching the trendline just as yesterday's scenario – this is an area where strong price reactions may occur.
The current structure shows that the price is gradually distributing below the trendline, with no clear signal that buyers have regained control.
In the short term, Brian prioritizes the Sell scenario, utilizing the POC – VAH – FVG areas of the Volume Profile to find entry points.
2. Volume Profile – Key price areas to note
Short-term POC/VAH area around 3,488–3,492 (according to his chart):
This is an area where dense trading occurred, the profile “bulges” out, indicating strong market interest.
When the price returns to this area, a reaction is expected – suitable for entering orders in the current priority direction.
Sell-side liquidity below: If gold cannot hold the POC/VAH area and is pushed down, the liquidity area below will become a reasonable target for the next downward move.
Gold is likely to fluctuate sideways on Friday to close the weekly candle below the trendline, then consider a clearer break at the start of next week.
3. Trading scenario for next week
Scenario 1 – Prioritize Sell at the Volume Profile area
Main mindset: When the price returns to the POC/VAH areas above, prioritize finding short signals instead of chasing buys.
Watch for clear candle reactions (long upper tail, pin bar, engulfing…) at the thick profile area.
Target: Gradually close towards lower liquidity areas (sell-side liquidity) below.
Depending on price behavior, the target can be expanded if selling pressure intensifies at the start of the week.
Scenario 2 – Break trendline & buy the retracement
If gold decisively breaks the downtrend line, closes above, and maintains the new structure:
Then, the strategy will shift to buying the retracement at the trendline itself (now acting as support).
The POC/VAL area below will then become a reasonable “buy zone” to follow the new upward trend.
In summary: before a clear break occurs, Brian still prioritizes selling at high liquidity areas, rather than rushing to catch the bottom.
4. Fundamental context – Large capital still supports gold
Central banks are increasing gold purchases:
In October, global central banks net purchased +53 tons of gold, the highest level since 11/2022.
This figure increased by +194% compared to July, marking the third consecutive month of increased purchasing speed.
This indicates: Short-term selling pressure may appear around the trendline/resistance, but long-term capital flow still favors gold.
Any deep declines later may still attract buying power from large institutions.
5. Risk management suggestions
Maintain the mindset: Sell is the current priority scenario, not the only option – if the structure changes, be ready to switch to buy.
Do not overlook the nearest liquidity/swing low area to place SL – avoid dragging SL too far due to emotions.

BULLS IN TOTAL CONTROL That sell after market open was just a last sell of today and this week as well , bulls have taken over completely and therefore we are likely going to see more buys today and next week will begin the real bullishness for this month, because last week and last month candles technically suggest Gold is going to buy more again this month, but because price is still trading in between sell/buy zones and maybe because of assets allocation and some liquidation it has caused some unnecessary volatility in a form of ranging and now it's time for bulls to push price up again,
so next week is going to be a good week for bulls and we will definitely have good buy entries like we had yesterday,
let prepare for the best yet to come, things are much clearer to me now and this is how I end the year that forex and trading in general made so much sense to me , it's such a good feeling and all i ask for in prayers and work towards is a good health and long life to fulfill this realistic dream and make history.

