ZakopiecFX GOLD XAUUSD TodayXAU/USD Gold Analysis - December 3, 2024
Current Price: Around $2,626-2,630
Intraday Range: $2,606 - $2,656
Technical Analysis
Bearish Signals:
Technical patterns show an Evening Star reversal formation near the resistance level around $2,655, along with a Hanging Man pattern around $2,630, both suggesting a potential price reversal. The MACD indicator has crossed below the signal line and is declining in negative territory, indicating fading bullish momentum. The RSI is also declining around 57, suggesting potential downward movement.
Key Support Levels:
$2,602
$2,557
$2,514
$2,460
$2,406
$2,352
$2,294
$2,220
Key Resistance Levels:
$2,645-$2,650 represents a strong barrier
Further resistance at $2,664-$2,665
$2,677-$2,678
Trading Scenarios
Base Scenario (Bearish):
Short positions below $2,602 with targets at $2,557, $2,514, and lower levels. Stop loss should be placed around $2,630.
Alternative Scenario (Bullish):
Long positions above $2,655 on increased volume, targeting $2,714, $2,774, $2,841, and higher levels. Stop loss around $2,630.
Fundamental Factors
Market Drivers:
Growing expectations of a Federal Reserve interest rate cut in December are supporting gold prices
Markets are pricing in approximately 64% chance of a December Fed rate cut
Geopolitical uncertainties and central bank demand continue supporting the precious metal
Upcoming Events:
Today: November services PMI data
Dec 4: Initial jobless claims
Dec 10: US CPI data and Fed interest rate decision
Market Sentiment
Gold is consolidating near current levels with mixed signals. While technical indicators suggest potential downside pressure in the short term, strong fundamental support from Fed rate cut expectations and safe-haven demand could limit significant declines. The market is showing uncertainty, with key moving averages near current price levels suggesting a decision point is approaching.
Trading Recommendation: Wait for a clear break above $2,655 for bullish continuation or below $2,602 for bearish movement before entering positions. Given the mixed signals, risk management is crucial.
DISCLAIMER: This analysis is for informational purposes only and should not be considered financial advice. Trading in financial instruments involves significant risk, including the potential loss of principal. Past performance does not guarantee future results. Market conditions can change rapidly, and the information provided may not reflect real-time market movements. Always conduct your own research and consider consulting with a qualified financial advisor before making any investment decisions. The author is not a financial advisor and assumes no responsibility for any investment decisions made based on this analysis.
Trade ideas

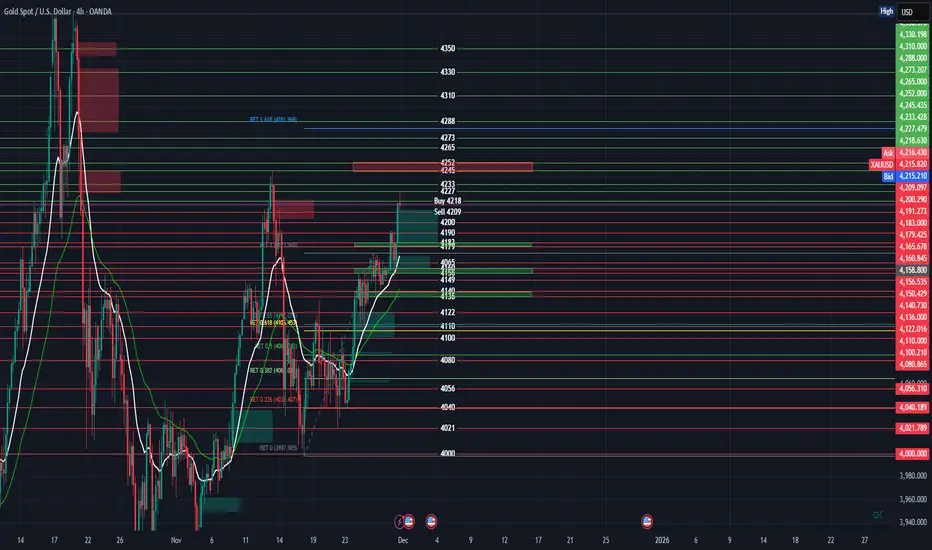
Gold weekly chart (4 hour) with buy and sell entriesChart Overview: XAU/USD 4-Hour
Current Trend: The market is in a corrective phase (bearish pullback) following an aggressive parabolic rally to a high of ~4381.
Momentum: Bearish. The White Moving Average (likely a shorter period, e.g., 20 or 50) has crossed below the Green Moving Average (likely a longer period, e.g., 200), signaling downward momentum.
🔴 Potential Sell Entries (Red Zones)
Major Resistance / Supply Zone: 4245.00 - 4252.00
Technicals: This red shaded box represents a Bearish Order Block (Supply Zone). Price previously broke down from this level with impulsive red candles, leaving trapped buyers. When price retraces to this area, these buyers often sell to break even, and institutional sellers reload shorts.
Secondary Sell signal (Text on chart): The label "Sell 4209" suggests a breakout trade. If price loses the 4209 local support, it confirms a continuation of the lower-low structure.
Suggested Take Profits (TP):
TP 1: 4165 (First Green Zone)
TP 2: 4136 (Second Green Zone)
TP 3: 4105 (0.618 Fibonacci Golden Pocket)
🟢 Potential Buy Entries (Green Zones)
Zone 1: 4160.00 - 4165.00
Technicals: This is the first area of structural support. It aligns with previous consolidation tops before the massive breakout. It acts as a "flip zone" (resistance turned support).
Zone 2: 4136.00 - 4140.00 (Stronger Support)
Technicals: This is a stronger Demand Zone. It sits just above the significant Fibonacci levels. If the correction deepens, this is the area where institutional algorithms often step in to defend the larger uptrend.
Text Signal "Buy 4218": The label "Buy 4218" on your chart suggests a momentum reversal trade—essentially waiting for the price to reclaim the immediate resistance before going long.
Suggested Take Profits (TP):
TP 1: 4210 (Local deviation)
TP 2: 4245 (Testing the bottom of the Red Supply Zone)
TP 3: 4280 (continuation of trend)
Summary Strategy
Short Term: The bias is Bearish as long as price is below the Moving Average crossover. Look for rejections at the 4245 red box to Sell.
Medium Term: Watch for bullish reversal patterns (doji, hammer candles) inside the green 4136 - 4165 zones to catch the next leg up of the macro bull run.
XAUUSD- Volume Profile AnalysisAt first glance, the chart may look a bit busy, but the structure is actually quite straightforward once you peel it off layer by layer.
The Fall
We start with the sharp October liquidation on the left. The volume profile over that entire downswing sets up a clean VAH-1, VAL-1, and POC-1, which are our key reference points for everything that follows.
Early November Rally
Early November price action is classic: price bases right around VAL-1, absorbs supply, and then launches into a swift breakout toward VAH-1. Textbook rotation from value-low to value-high.
Importance of VAH
VAH-1, as expected, caps the move and triggers a pullback right into the POC-2 of the November advance, which also happens to overlap with the prior breakout zone. A high confluence area where buyers stepped back in.
The Sharp Pullback to Retest
Price then coils around VAH-2, grinds higher, and retests VAH-1 but only to resist again. That repeated inability to hold above VAH-1 is a sign of pullback.
A Perfect Alignment
POC-3 and POC-4 line up almost perfectly, creating a stacked POC shelf and hence a structurally important zone. Add to that an active ascending trend channel that has been containing the structural swings also aligns with the POC shelf.
Potential Setup
Given this alignment, the 4075–4100 region becomes a potential demand pocket or a zone that could attract responsive buyers on any pullback, offering a comparatively low-risk long setup.
On the flip side, price could simply squeeze higher from current levels, ripping past 4250 into the old highs. But that scenario doesn’t offer favorable risk-to-reward for fresh longs as the risk of breakout failure remains high in an extended market.
But the real question is-
How do you read this tape? Are we staring at the late stages of a tired rally, or shaping up for a classic pullback-and-continuation structure?
Share your thoughts in the comment section below.
Thanks for reading.
📣Disclaimer:
Everything shared here is meant for education and general awareness only. It’s not financial advice, nor a recommendation to buy, sell, or hold any asset. Do your own research, manage your risk, and make sure you understand what you’re getting into.

Gold outlook bullish above 4230 - Key levels ahead Gold (XAUUSD) Analysis - .
Gold bullish structure continues as long as price stays above 4230.
A clean breakout and hold above this level can open the path toward ,
Upside levels
4260-4300
Support zone
4110- A breakdown below may weaken the bullish momentum .
Trend remains positive unless key support fails . I will watch price action near 4230 for confirmation .

GoldXAUUSD
- Completed " 12345 " Impulsive Waves
- Symmetrical Triangle as an corrective pattern in Short Time Frame
- Break of Structure
- Bearish Channel as Long Time Frame
- Consolidation Phase

XAUUSD– Bearish Shift After ResistanceThis chart highlights a complete Smart Money flow on XAUUSD.
Market pehle sideways tha, phir strong break of structure (BOS) ke baad price ne resistance zone ko test kiya. Resistance se rejection aaya, jahan sellers ne control liya.
Ab price retest ke liye wapas same zone ki taraf ja raha hai.
Agar retest ke baad price niche break karta hai, to strong bearish continuation expected hai, jiska target support zone hoga.
Break of support se market aur zyada sellers ko attract karega, pushing price toward deeper levels.
Chart clearly show karta hai:
Sideways accumulation → Uptrend → Resistance rejection
Market structure shift → potential sell confirmation
Retest zone as a high-probability entry point
Support zone as major target for sellers
This setup gives a clean and powerful sell bias, following institutional behavior and market psychology.

Gold Trade Plan 01/12/2025Dear Traders,
“The price has penetrated the previous pivot, and I expect the bullish move to continue toward the top of the channel. Considering the news about potential rate cuts and the U.S.–Venezuela conflict, buyers are currently stronger than sellers in the market. Since there are no major news events today and trading volume is low, I don’t expect significant volatility.”
Regards,
Alireza!

XAUUSD (Gold) Expected Bullish Bounce from Demand ZonePrice has dropped into a Demand Zone (purple area), where buyers are expected to be strong.
The chart marks a Break of Structure (BOS) and Equal Highs (EQH) above, which means there is liquidity sitting on the highs.
There is a Weak High above that price may try to take out.
The arrow shows a projected bullish move from the Demand Zone up toward the Target Level.
Simple idea
The chart suggests that gold (XAUUSD) might:
1. Bounce from the Demand Zone,
2. Move upward,
3. Take liquidity above Equal Highs,
4. Reach the target zone marked on the chart.
Basically: Buyers expected from the demand zone → price may push up to break previous highs.
❤️ please support with Boost and Comment I will be Glad ❤️

is this the pullback before another Bullsih momentum The XAU/USD pair has shifted its trajectory from bullish to bearish, consistently forming a bearish structure.
1. Reflecting on the previous week, it concluded with a bullish engulfing candle. I believe the market is currently testing last Week Bullish engulfing Candle and may continue to do so into the following week.
2. When analyzing the daily timeframe, the market has failed to establish a new higher high, closing below 4244. This indicates a liquidity sweep from the buy side, suggesting that the market may be planning a retest or is interested in the SSL (SELL SIDE LIQUIDITY).
3. Examining the hourly (H1) timeframe, we observe that the market is within a demand zone where buyers have shown significant interest. The market has already tested the 50% of this demand zone and is gradually rising towards the base of the bearish engulfing candle.
A. As we consider potential entry points, it is crucial to determine whether the market intends to test the weekly bullish engulfing candle or if buyers will intervene to maintain prices above 4168.
B. If the market seeks to test the weekly engulfing pattern, it could potentially decline further to 4140.
C. Conversely, if the demand zone at H1 is effective, the market may rise to approximately 4241.

Gold (XAUUSD) – Don’t Get Trapped: Sell High, Buy LowGold (XAUUSD) – Structural Outlook
Price action continues to develop within a corrective framework, forming a potential A–B–C structure following the recent impulsive advance. The market is approaching a key resistance zone aligned with the 0.786 retracement , where liquidity above the internal swing high may be targeted before a broader downside continuation toward the $3,880–$3,790 demand region. A confirmed sweep and rejection from the upper boundary would strengthen the case for the final leg of the correction, completing wave (C) before a higher-time-frame bullish continuation resumes.
⚠️ Disclaimer
This analysis is provided for educational purposes only and does not constitute financial advice. Trading financial markets involves risk, and you are solely responsible for your own investment decisions. Always conduct your own research and use proper risk management.
If you found this analysis valuable, leave a like, drop your thoughts in the comments, and follow for more structured market insights.

Gold price analysis December 4Gold is currently hovering near the small trendline, where the market is about to enter a directional phase. If the selling pressure is strong enough to break this trendline, the price could continue to slide down to the larger trendline below. Conversely, if the sellers fail to break through, this will be the support for the buyers to bounce back and head towards the important resistance zone of 4290.
Today, the trendlines will play a key role in confirming the direction of the market. Note: when the price breaks 4290, the market will no longer be suitable to set up new BUY orders until a stronger support zone appears around 4115.
Recommended trading strategy:
BUY at the small trendline: around 4195
BUY Trigger: when a clear price rejection signal appears at the support zone 4115
Target: 4290
Risk management:
If the price breaks the small trendline and closes the candle below 4190 → close all BUY orders.
The trend will turn sharply down when the price closes below 4115.

Brian|watch reaction at POC–VAL –VAH according to Volume ProfileXAUUSD – Brian | watch reaction at POC – VAL – VAH according to Volume Profile
1. Market snapshot
Gold is entering a redistribution phase in the high price range, with fluctuations mainly revolving around large volume clusters on the Volume Profile. In this context, Brian's current priority scenario is to watch for a Sell when the price approaches the POC / VAL / VAH areas – where the market previously traded heavily.
2. Volume Profile – Notable price areas
POC – VAH area 4.217 is the price area where buyers/sellers previously "struggled" strongly, suitable for looking for sell signals if there is a rejection reaction.
VAL & the support area below around 4.134 is where short-term buying force may appear, suitable for a technical rebound buy scenario.
3. Trading plan (this week)
Scenario 1 – Sell according to Volume Profile (priority)
Sell: 4.217
SL: 4.125
TP: 4.200 – 4.182 – 4.150
Idea: wait for the price to rebound to the POC/VAH area around 4.217, observe the H1/M30 candle reaction. If a clear rejection signal appears (long upper tail, reversal candle...), the sell order can be activated according to the plan.
Scenario 2 – Short buy at VAL/support area
Buy: 4.134
SL: 4.125
TP: 4.155 – 4.180 – 4.200
Idea: if the price adjusts deeply near the VAL area and holds above 4.125, a technical rebound may occur. This is a short buy, not going too far against the trend, prioritizing partial profit-taking when the price returns to the upper POC area.
4. News to watch – Unemployment Claims
Today there are US Unemployment Claims figures, which are quite sensitive data for gold because:
The market will assess the strength/weakness of the US labor market.
Worse-than-expected figures → increase the likelihood of Fed easing → positive for gold.
Better-than-expected figures → support USD, may cause gold to face adjustment pressure.
Therefore, it is advisable to limit new orders close to the news release time, wait for the post-news candle to stabilize, and then reassess the structure.
5. Risk management (user-friendly for phone users)
Sell is the priority scenario but do not overlook SL 4.125, to avoid the case of a strong breakout above the current volume cluster.
With the Buy 4.134 scenario, it is advisable to split TP, move SL to breakeven when the price hits TP1 to reduce the pressure of having to "watch the chart" continuously on the phone.
If D1/H4 closes below the 4.125 area with large volume, Brian will consider it a signal to reduce short-term buying expectations and wait for a clearer new structure.

Short Term Weakness. Mid Term Strength.TVC:GOLD is trading inside a clear distribution zone on the 1H chart. Price rejected the premium Breaker Block around 4,240 to 4,250 and continues sliding toward discount levels. Liquidity sweeps on both sides confirm a ranging but heavy market. OG FlowMaster and ScalpMaster both show premium exhaustion while TrendMaster acts as dynamic support.
On the 1D chart momentum is slowing but the overall bullish structure is still intact as long as the 4,100 to 4,020 demand zone holds. This region remains the key mid term decision point.
Short term view (1H)
🔻 Bears have advantage below 4,230
🎯 Short targets: 4,196, 4,185, 4,165
🛑 Invalidation: 4,250 break
Long term view (1D)
🔼 Bulls stay in control above 4,100
🎯 Mid term targets: 4,265, 4,300, 4,335
🛑 Breakdown zone: 4,100 to 4,020
Overall, short term weakness meets mid term support. Premium areas are selling and discount zones are attracting buyers. OG indicators map the liquidity perfectly and keep showing the cleanest zones to work with.

GOLD SHOOK THE MARKET – STRUCTURE STILL UNBREAKABLE!📌 CURRENT MARKET UPDATE (GOLD – 4H)
The market continues to respect the wave structure exactly as projected:
- Wave (1) – (2) has already completed
- Wave (3) tapped into the Liquidity zone 4250–4260, creating a clean corrective reaction
- Price is currently in a technical retest phase, perfectly normal within a strong macro uptrend
🎯 Key Level to Watch
The Swing Zone 4147–4150 remains solid — this is the core foundation of the entire bullish structure.
- Only if this zone breaks will the trend lose strength
- EMA34 & EMA89 continue trending upward, acting as strong dynamic support
✅ Main Scenario (High Probability)
Price makes a mild correction before pushing up to complete Wave (5) of (3).
Expected pullback zones:
🔹 4210 – 4180
🔹 Reaction confirmation → bullish continuation toward:
- 4310 – 4325 (Resistance)
- 4365 – 4370 (Liquidity – Completion of Wave (C))
Current liquidity flow still favors buy setups at support retest.
⚠️ Sub-Scenario (Low Probability)
If a 4H candle closes below 4147 → deeper correction toward EMA200 (4060–4080).
↳ Currently, there is NO sign of this scenario.
✅ TODAY’S TREND SUMMARY
Trend: Corrective – Accumulation
Optimal Buy Zones: 4210 → 4180 → 4150
Targets:
- 4310 – 4325
- 4365 – 4370
Trend invalidation: Break 4147

Fib Analysis - Bullish Trendbased on previous analysis with Fib. This is the idea i have for the current trend on XAU USD. Also based on potential news later on in the day in the US. I can see this being very bullish

XAUUSD: Bullish Continuation Confirmed - Retest of OBWe are observing a textbook breakout and retest setup that confirms the continuation of the bullish trend in Gold. The price has successfully pulled back into a critical institutional demand zone (the Order Block), offering a high-probability long entry before targeting the next structural high.
Technical Rationale & Analysis
Trend Confirmation: The price action has respected the ascending Trend Line and achieved a strong Breakout from the recent Consolidation zone. This action shifts the short-term structure firmly to the upside.
Support Flip & Retest: The previous resistance level of the consolidation has effectively flipped to become new support. The price has pulled back directly to this area, which coincides with an unmitigated Order Block (OB). This completed retest suggests institutional buyers are defending this level.
High-Probability Entry Zone: The current price is sitting directly on the key Order Block (OB), which represents the origin of the last major impulsive move. This is the optimal demand zone for a low-risk, high-reward entry.
Target Supply: The primary target is the structural high, defined by the confluence of an Order Block and a Fair Value Gap (FVG) above $4,300. Price is expected to move to fill this supply/imbalance zone.
Key Confirmation
Since the price is already in the demand zone, watch for lower timeframe confirmation (e.g., on the 1H or 30m chart). A strong bullish candle close or a clear reversal pattern off the OB is needed to confirm the demand has fully absorbed the selling pressure.
Disclaimer: This analysis is based on technical patterns and is for educational purposes only. Always conduct your own risk management and research.

Possible XAUUSD swingREad text in chart.... Updates will follow
TRade with proper risk
Patience is the way! Ieios

Gold: Bullish Fundamentals, but Technicals Still Blocking the BOHello everyone, gold continues to gain support from macro data after the ADP report showed a surprise loss of 32,000 private-sector jobs, strengthening expectations of a 0.25% Fed rate cut in the December meeting. This normally benefits gold as USD and yields cool down.
However, the chart still refuses to confirm any breakout. Price remains compressed inside 4,195–4,205 with low volume, sitting right on the Ichimoku cloud. Overhead resistance/FVG 4,215–4,225 and support at 4,180 keep price locked in a tight 4,180–4,225 range.
Ahead of today’s PCE data, gold is likely to stay boxed in until the market receives a stronger catalyst from PCE or the Fed.

GOLD Consolidation Starts (Correction zone) Buyers Slow ExitNow after the all time high of 3482.
GOLD enters into a Consolidation zone Starts or (Correction zone) Buyers Slow Exit.
So at current market price 4180 Sell and again buy at 4000 and again sell at 4170 range and again buy at 3890 and again sell at 4050 and again buy at 3890 and again sell at 4160 and again buy at 3737.
This is for Education Purpose only, am still testing WD Gann theory!

XAUUSD (Gold) Sell SetupHi All,
Hope everyone is doing good. Here is my small gold analysis & trade (just for the educational purposes).
Green Pips To All
Amen

XAUUSD: Trend in 30-Min timeframeThe color levels are very accurate levels of support and resistance in different time frames, and we have to wait for their reaction in these areas.
You should be noted, that we have two trend (green & purple)
So, Please pay special attention to the very accurate trend, colored levels, accurate channel and you must know that SETUP is very very sensitive.
Be careful
BEST
MT

XAU/USD Bullish Structure Activated – Premium Swing Setup Ahead🏆 XAU/USD GOLD BREAKOUT BLUEPRINT 📈
Swing Trade | Bullish Momentum Confirmed
═══════════════════════════════════════
📊 TRADE SETUP AT A GLANCE
🟢 Asset: XAU/USD (Gold vs U.S. Dollar)
📍 Strategy: Swing Trade | Moving Average Breakout
⚡ Bias: BULLISH | Momentum Confirmed
📊 Timeframe:
⏰ Setup Type: Technical Breakout + Price Action
🎯 ENTRY STRATEGY
✅ Entry Zone: Flexible Entry Levels
Market Order or Limit Orders acceptable
Align with current support/resistance structure
Confirm breakout candle closure above moving averages
💡 Confirmation Signals:
Price breakout above key moving average (MA)
Volume confirmation
Support hold above
🛑 RISK MANAGEMENT
Stop Loss Level: 4,050.00 ⛔
Strategic placement below swing low
Protects against false breakout
IMPORTANT: Adjust SL based on YOUR personal risk tolerance & strategy
Risk/Reward Ratio: Minimum 1:2 recommended
⚠️ Disclaimer: This is MY suggested level only. You have complete discretion to set your own stop loss based on your trading plan, account size, and risk management rules.
🎖️ PROFIT TARGETS
Primary Target: 4,260.00 🚀
Strong resistance zone identified
Overbought levels approaching
Key technical barrier zone
📌 Target Rationale:
Resistance confluence
Previous rejection zone
Risk:Reward alignment
⚠️ Disclaimer: This is MY suggested target only. You retain full control over your take-profit levels. Exit at YOUR predetermined levels based on your strategy, profit goals, and market conditions.
💼 RELATED PAIRS TO MONITOR (CORRELATION ANALYSIS)
📍 USD INDEX (DXY) - Strong Inverse Correlation ⬇️
Why Watch: Gold is priced in USD. Weaker dollar = Stronger gold
↓ DXY pressure supports XAU/USD upside
↑ DXY strength threatens gold rally
Key Level: Watch 104.50 - 105.00 zone
📍 EURUSD - Inverse Dollar Relationship ⬆️
Why Watch: Euro strength indicates dollar weakness, bullish for gold
↑ EURUSD strength = Tailwind for XAU/USD
↓ EURUSD weakness = Headwind for gold
Key Level: Watch 1.1000 - 1.1100 support
Correlation: 0.75+ inverse (very strong)
📍 GBPUSD - Inverse Dollar Relationship ⬆️
Why Watch: Similar to EUR; British Pound weakness/strength affects gold demand
↑ GBPUSD strength = Supportive for XAU/USD
Key Level: Watch 1.2700 - 1.2800 zone
Correlation: 0.70+ inverse relationship
📍 US 10Y YIELD (TNX) - Inverse Relationship ⬇️
Why Watch: Rising yields = Stronger dollar + Higher opportunity cost for holding non-yielding gold
↑ TNX pressure = Headwind for gold
↓ TNX decline = Tailwind for gold
Key Level: Watch 4.20% - 4.50% threshold
Impact: Direct fundamental driver
📍 S&P 500 (SPX) - Risk Sentiment Correlation ⬇️
Why Watch: Risk-off = Flight to safety (gold rallies); Risk-on = Equities rally (gold declines)
⬆️ SPX weakness = Typically bullish for gold (safe-haven demand)
Key Level: Watch 6,800 - 6,850 support zone
Correlation: -0.30 to -0.50 (inverse; moderate)
📍 OIL (WTI/BRENT) - Inflation Proxy ⬆️
Why Watch: Oil/inflation expectations influence real rates and gold demand
↑ Oil strength = Inflation concerns = Bullish for gold
Key Level: Watch $75 - $80 zone
Correlation: 0.40+ positive
🔑 KEY CORRELATION POINTS
DXY (Dollar Index) moves in the OPPOSITE direction to gold with a -0.85 correlation (very strong inverse). This is the primary driver—when the dollar weakens, gold strengthens, and vice versa.
EURUSD & GBPUSD both show strong inverse correlations at -0.75 and -0.70 respectively. Euro and Pound strength indicate dollar weakness, which supports gold upside as secondary support signals.
TNX (10-Year Yield) maintains a -0.80 inverse correlation. Rising yields strengthen the dollar and increase the opportunity cost of holding non-yielding gold, while declining yields support gold appreciation. This is a fundamental driver of gold price action.
SPX (S&P 500) has a moderate -0.40 inverse correlation reflecting risk sentiment. When equities decline (risk-off), investors flee to safe-haven assets like gold. When stocks rally (risk-on), gold typically retreats as capital rotates to higher-yielding assets.
Oil (WTI/Brent) shows a +0.40 positive correlation. Rising oil prices often signal inflation concerns, which supports gold demand as an inflation hedge and real asset store of value.
📋 PRE-TRADE CHECKLIST
✅ Moving average breakout confirmed?
✅ Volume supporting the move?
✅ DXY weakness OR USD decline confirmed?
✅ 10Y Yield below 4.50% zone?
✅ Risk/Reward ratio minimum 1:2?
✅ Your personal SL/TP levels SET?
✅ Position size calculated per YOUR risk?
✅ Economic calendar clear for next 24hrs?
Happy Trading! 🚀📈
Risk What You Can Afford to Lose | Trade Smart | Manage Risk

XAUUSD Facing Resistance Near Key Supply ZoneGold has moved into a previously active price area where selling pressure has appeared in the past. Recent candles show hesitation after the upward move, suggesting possible exhaustion around this level.
If the market fails to stay above the mid-range area, a retracement toward the lower support zone may develop. A firm hold and clear acceptance above resistance would shift focus back toward the upper range.
