Overtrading Gold – Biggest Account KillerOvertrading Gold – Biggest Account Killer
🧠 What Overtrading REALLY Means in Gold
Overtrading is not just trading too often — it’s trading without edge, patience, or contextual alignment.
In XAUUSD, overtrading usually looks like:
Multiple entries in the same range
Chasing price after impulsive candles
Trading every wick, every breakout, every news spike
📌 Gold gives the illusion of opportunity every minute — but institutions trade very selectively.
🧨 Why Gold Is the Perfect Trap for Overtraders
Gold is engineered (by behavior, not conspiracy) to punish impatience 👇
🔥 Extreme volatility
🔥 Fast candles & long wicks
🔥 Sudden reversals
🔥 News-driven manipulation
🔥 Liquidity sweeps above & below range
💣 Result?
Retail traders feel forced to trade — and end up trading against structure and liquidity.
🧩 The Overtrading Cycle (Account Destruction Loop)
Most gold traders repeat this cycle unknowingly ⛓️
1️⃣ Enter early (no confirmation)
2️⃣ Stop-loss hit by wick
3️⃣ Re-enter immediately (revenge)
4️⃣ Increase lot size
5️⃣ Ignore bias & HTF context
6️⃣ Emotional exhaustion
7️⃣ Big loss → account damage
📉 This cycle has nothing to do with strategy — it’s pure psychology.
🧠 Why Strategy Stops Working When You Overtrade
Even a 60–70% win-rate strategy will fail if:
❌ Trades are taken outside optimal time
❌ Entries ignore higher-timeframe direction
❌ Risk increases after losses
❌ Rules are bent “just this once”
📌 Gold exposes discipline weakness faster than any other market.
⏰ Time Is the Hidden Edge in Gold
Gold does NOT move efficiently all day ⏱️
🟡 Asian Session → Range & traps
🟡 London Open → Liquidity grab
🟢 New York Session → Real direction
Overtraders:
❌ Trade Asian noise
❌ Enter mid-range
❌ Chase NY expansion late
Smart traders:
✅ Wait for liquidity first
✅ Trade after manipulation
✅ Enter once direction is clear
📉 Statistical Damage of Overtrading
Let’s talk numbers 📊
🔻 More trades = more spread & commission
🔻 Lower average R:R
🔻 Lower win probability
🔻 Higher emotional stress
🔻 Faster drawdowns
💡 One A-grade setup can outperform 10 random gold trades.
🧠 Psychology: The Real Root Cause
Overtrading is driven by internal pressure 👇
😨 Fear of missing out
😡 Anger after stop-loss
😄 Overconfidence after win
😴 Boredom during ranges
Gold feeds emotions — and then punishes them.
📌 Institutions wait. Retail reacts.
🛑 How Professionals Control Overtrading
Real solutions — not motivational quotes 👇
✅ Maximum 1–2 trades per session
✅ Trade only at predefined time windows
✅ Fixed risk per trade (no exceptions)
✅ Daily stop after 2 losses max
✅ Journal every impulsive entry
📘 If it’s not planned before price moves, it’s emotional.
🏆 Golden Rule of XAUUSD
💎 Gold is not hard because it’s random
💀 Gold is hard because it exposes impatience
You don’t need more trades.
You need more discipline.
📌 Final Truth
Most XAUUSD accounts don’t blow because of:
❌ Bad indicators
❌ Bad analysis
❌ Bad strategy
They blow because of overtrading driven by emotion.
📉 Overtrading is the biggest account killer in gold trading.
Trade ideas

XAU/USD – Bullish Trend Confirmed, Buy on PullbacksMarket Context
Gold remains firmly bullish, continuing to trade within a well-defined ascending channel. After a strong impulsive rally, the market is now entering a technical pullback phase to rebalance liquidity, which is a healthy behavior in a trending market rather than a sign of reversal.
From a macro perspective, dovish Fed expectations and the outlook for lower interest rates continue to support Gold. This keeps downside moves corrective in nature and favors trend-following BUY strategies.
Technical Structure (H1)
• Bullish structure remains intact with Higher Highs and Higher Lows
• Price is reacting at key confluence zones (trendline support + demand + Fibonacci)
• No confirmed bearish structure break at this stage
Trading Plan – MMF Style
Primary Scenario – Trend-Following BUY
• Preferred BUY zone: 4,296 – 4,292
• Stop Loss: below 4,286
Targets:
TP1: 4,327
TP2: 4,348
TP3: Extension if bullish momentum continues
→ Strategy: wait for pullbacks into key demand zones. No FOMO chasing at highs.
Alternative Scenario
• If price breaks and closes clearly below 4,241, short-term bullish structure weakens
• Stand aside and wait for a new structure confirmation
MMF Perspective
In a bullish market, the goal is not to predict the top, but to buy pullbacks at high-probability zones with favorable risk–reward.
As long as price holds above key supports, the primary bias remains BUY.

Textbook Breakout: Why 4270 Is Now a Buy ZoneYesterday, Gold finally resolved the range with a breakout to the upside — following the technical path , not my gut feeling from the day. And when the market chooses the textbook option, we respect it.
Right now, price is consolidating in a tight range, and the normal continuation path points toward a push above 4300 (4320 being my preferred zone).
In the short term, any dips toward 4270 — even slightly below — should be viewed as buying opportunities, in line with the new bullish structure.
A deeper pullback toward 4245 (the broken resistance) would be too aggressive after such an important breakout. If the market goes that low, it’s no longer a healthy bullish continuation — it’s a warning that momentum is fading.
In short: Gold is bullish now.
But if it retests 4245, it’s not bullish anymore.

Fed Cuts Rates, USD Weakens — Gold’s Moment Has Arrived!Based on the current market landscape, XAUUSD is entering a phase where buyers hold a clear advantage , supported by both favorable macro conditions and a technical structure that reinforces a new bullish leg. This is a period where gold isn’t rising just because of news — it now has a solid foundation to sustain its trend.
To begin with, the Fed’s 0.25% rate cut — from 4.00% to 3.75% — immediately pressured the USD. Lower rates naturally drive capital away from USD-denominated assets and toward safe-haven assets like gold. In addition, J obless Claims are projected to rise to 220K, up from 191K, signaling a slowing labor market. A weaker labor market often pushes the Fed further into an easing stance — a key catalyst that helps gold maintain its upward momentum.
On the chart, price is rebounding from the 4,190 support zone, an area that has repeatedly shown strong buying interest. The structure remains above the Ichimoku cloud, signaling that the medium-term uptrend is still intact . The accumulation happening directly inside this support area further strengthens the scenario of XAUUSD retesting the 4,240 resistance. As long as 4,190 holds, the bullish momentum is essentially “open and ready” for buyers.
Combining both fundamentals and technicals, gold is standing in front of a clear opportunity to extend its bullish expansion. This is a phase where the market is less noisy, the bullish bias is clean and decisive , and monetary policy is providing a solid launchpad. If buyers keep control above 4,190, the 4,240 target becomes only a matter of time.

XAUUSD in Uptrend, Awaiting Technical PullbackHi everyone, Domic here. Let’s take a closer look at gold today!
Overall, both news and technicals favor buyers. Gold has surged to around $4,270/oz, up $32 from yesterday, reaching its highest level in over a month. The Fed’s 0.25% rate cut, lowering the benchmark to 3.5–3.75%, has clearly weakened the USD — a positive catalyst for gold. Meanwhile, silver also hit a new high around $64.22/oz. According to Edward Meir, silver’s strong momentum is lifting gold and other precious metals, signaling a return of capital to safe-haven assets.
Looking ahead, the market eyes the Nonfarm Payrolls report on December 16 for clues on the next rate moves. Discussions over the next Fed chair, with front-runner Kevin Hassett supporting rate cuts, further strengthen expectations of a prolonged low-rate environment, keeping gold in a favorable position among safe-haven assets.
On the H4 chart, XAUUSD’s uptrend is clear. Price sits above both EMAs, with the short EMA (red) near 4,221 and the long EMA (blue) near 4,188, confirming the medium–long-term uptrend. The recent breakout pushed gold to 4,270–4,280 with rising volume, indicating active buying rather than a random spike. However, the gap between price and the short EMA is wide, making a technical pullback likely.
Preferred scenario:
Gold may retrace to a nearby support zone before resuming its uptrend. The first support is around 4,240–4,250, where price previously consolidated before the breakout — a potential shallow pullback before bouncing higher.
If selling intensifies, the 4,220–4,225 zone near the red EMA offers a good retest point, aligning with the broken resistance. In a stronger pullback, the long EMA (blue) near 4,188 acts as the next safety net, preserving the medium-term uptrend.
→ As long as price stays above this zone on H4, any dips are just pullbacks within the uptrend.
Wishing you successful trades!

XAU/USD | A drop before a bullish move? (READ THE CAPTION)Good morning folks, Amirali here.
As you can see, last night with FOMC news, Gold price surged from 4194 all the way to 4238 before dropping again to 4204 and now it's being traded at 4214 level.
Gold is respecting the supply zone and has shown reaction to it multiple times. I expect Gold to challenge the supply zone again, should it fail to go through, a drop to 4160 to sweep all the sellside liquidity there and then again another upwards move for it to happen is likely.

#XAUUSD: First Sell And Then Buy At The Correction +2000 Pips! Dear Traders,
Gold presents two opportunities: first, sell at the premium selling zone and then buy at the correction or discounted buying zone. This strategy aims to gain approximately +2000 pips or more. Our chart analysis supports this approach. Currently, the price exhibits extreme bullish momentum nearing exhaustion. Once buyers are depleted, sellers’ volume will surge rapidly at $4385. However, this selling momentum won’t last as a swing move, revealing our buying point or discounted buying point. This will ultimately drive the price to $4500.
Premium Selling Zone:
- Gold’s current extreme bullish momentum is approaching exhaustion.
- Our analysis suggests a high-probability selling opportunity at $4385, where buyer exhaustion is expected to trigger a rapid influx of sellers.
- This initial move could yield immediate profits as the market corrects.
Discounted Buying Zone:
- The anticipated selling movement won’t persist as a swing trend.
- Following the corrective dip, our discounted buying zone offers an ideal entry point for long positions.
- This secondary move is projected to propel gold prices to $4500, potentially generating +2000 pips or more.
Detailed Gold Chart Analysis (12/12/2025):
- Trend: A strong bullish trend with momentum indicators signalling overbought conditions.
- Support & Resistance:
- Key Resistance: $4385 (Premium Selling Zone)
- Key Support: Discounted Buying Zone after the corrective dip.
- Market Structure: The current movement concludes the final leg of an impulse wave, nearing exhaustion.
- Indicators:
- RSI: Approaching 78 (overbought)
- MACD: Showing divergence, hinting at a potential bearish correction
Please exercise accurate risk management while trading gold.
Team Setupsfx_

GOLD → Consolidation before reaching ATH FX:XAUUSD has been rising for the fifth consecutive day amid a weakening dollar and expectations of a dovish Fed policy. The market is testing intermediate resistance before reaching ATH.
The Fed cut rates by 25 basis points, but the market expects two cuts in 2026, not one, as stated in the regulator's forecasts. The possible appointment of a new “dovish” Fed chair is putting pressure on the dollar. The increase in US unemployment claims (to 236K) confirms fears of a slowdown in the labor market.
Tomorrow, US employment (NFP) and retail sales data will be released, followed by inflation (CPI) data on Thursday. Friday: Bank of Japan decision.
The results could significantly adjust expectations for interest rates.
The upward trend in gold continues, but its stability will be tested by macro data. Weak employment and inflation figures will support growth, while strong data could trigger a correction.
Resistance levels: 4353, 4380, 4400
Support levels: 4329, 4305
The market may consolidate before breaking through the nearest resistance. Locally - 4333, 4329, 4318. The bullish trend may continue afterwards.
Best regards, R. Linda!

XAUUSD: Bullish Push to 4295?FX:XAUUSD is eyeing a bullish continuation on the 4-hour chart , with price bouncing within an upward channel after recent lower highs and higher lows, converging with a potential entry zone near support that could spark upside momentum if buyers hold the channel amid volatility. This setup suggests a rally opportunity post-correction, targeting higher resistance levels with overall risk-reward exceeding 1:3.5 .🔥
Entry between 4160–4175 for a long position. Targets at 4245 (first), 4295 (second). Set a stop loss at a valid break below the upward channel, yielding a risk-reward ratio of more than 1:3.5 in total. Monitor for confirmation via a bullish candle close above entry with rising volume, leveraging gold's resilience in the channel.
Fundamentally , gold is consolidating around $4,193 in mid-December 2025, with today's FOMC meeting on December 10 drawing intense focus as the Federal Reserve is widely expected to deliver a 25-basis-point rate cut —the third consecutive reduction—bringing the key rate to about 3.6%, the lowest in nearly three years. However, the decision may come with hawkish guidance signaling a potential pause in future cuts amid divisions among officials urging caution, influenced by conflicting economic data like resilient labor markets and cooling inflation. Investors will scrutinize Fed Chair Powell's post-meeting press briefing for clues on the 2026 outlook, where dovish signals could boost gold's safe-haven appeal by weakening the USD further, though hawkish tones might cap gains. 💡
📝 Trade Setup
🎯 Entry (Long):
4160 – 4175
(Entry inside this zone remains valid with proper risk & capital management.)
🎯 Targets:
• 4245 (first)
• 4295 (second)
❌ Stop Loss:
A valid break & close below the upward channel
⚖️ Risk-to-Reward:
More than 1:3.5 overall
💡 Your view?
Does XAUUSD hold the channel support and push toward 4295 — or will FOMC volatility create another dip first? 👇

GOLD WEEKLY CHART MID/LONG TERM ROUTE MAPHey everyone,
Please see our weekly chart timeframe Route map and Trading plans for the week ahead.
We are seeing a repeat of the same ranging action again. We still have a long range candle body close gap above at 4294, with 4059 acting as support. We can expect price action to play between these two levels. We now also have EMA5 cross and lock above to strengthen the gap toward 4294. Conversely, a ema5 lock back below 4059 would reopen the broader retracement range.
We’ll keep these long timeframe structures in mind as we continue with our plan to buy dips.
We will keep you all updated as this chart idea unfolds.
Mr Gold

Gold 1H – Will 4232 Trap Liquidity or 4170 Spark Expansion?🟡 XAUUSD – Intraday Smart Money Plan | by Ryan_TitanTrader (08/12)
📈 Market Context
Gold trades inside politically-driven liquidity as Donald Trump signals that the current method of tariffing through the US Supreme Court is “more direct, less cumbersome, and much faster.”
This introduces fresh uncertainty for USD flows, increasing short-term volatility across commodities.
Expect engineered sweeps on both sides as institutions react to policy-sensitive sentiment shifts.
On H1, price compresses between premium supply (4230–4232) and discount demand (4170–4168).
A confirmed MSS + BOS + displacement is required before any directional leg becomes valid.
🔎 Technical Framework – Smart Money Structure (1H)
Current Phase: Liquidity-rich compression inside a minor bullish channel
Key Idea: Sweeps first, real move later
Liquidity Zones & Triggers
• 🔴 SELL GOLD 4230 – 4232 | SL 4240
• 🟢 BUY GOLD 4172 – 4170 | SL 4162
Bias shifts only via structural break + clean displacement.
Expected Institutional Sequence:
sweep → MSS/CHoCH → BOS → displacement → FVG/OB retest → expansion
🎯 Execution Rules (matching your exact zones)
🔴 SELL GOLD 4230 – 4232 | SL 4240
Rules:
✔ Price taps 4231–4232 → bearish MSS/CHoCH on M5–M15
✔ BOS down + strong displacement candle
✔ Entry on bearish FVG fill / supply OB retest
Targets:
1. 4200
2. 4185
3. 4170
🟢 BUY GOLD 4172 – 4170 | SL 4162
Rules:
✔ Sweep below 4169 → bullish MSS/CHoCH
✔ BOS up + displacement from discount
✔ Entry on FVG fill or refined OB retest
Targets:
1. 4186
2. 4210
3. 4230 – 4232
⚠️ Risk Notes
• Headlines may induce fake sweeps; do not pre-commit without BOS + displacement
• No averaging inside compression
• SLs must sit at structural invalidation
• Reduce risk during tariff-related spikes
📍 Summary
Today’s playbook offers two institutional paths:
• 4231 sweep → bearish MSS → BOS → retest → delivery into 4170
or
• 4169 sweep → bullish MSS → BOS → retest → expansion back toward 4230+
Trade confirmations only.
Let gold show its hand — patience is your edge. ⚡️
📌 Follow @Ryan_TitanTrader for daily Smart Money breakdowns.

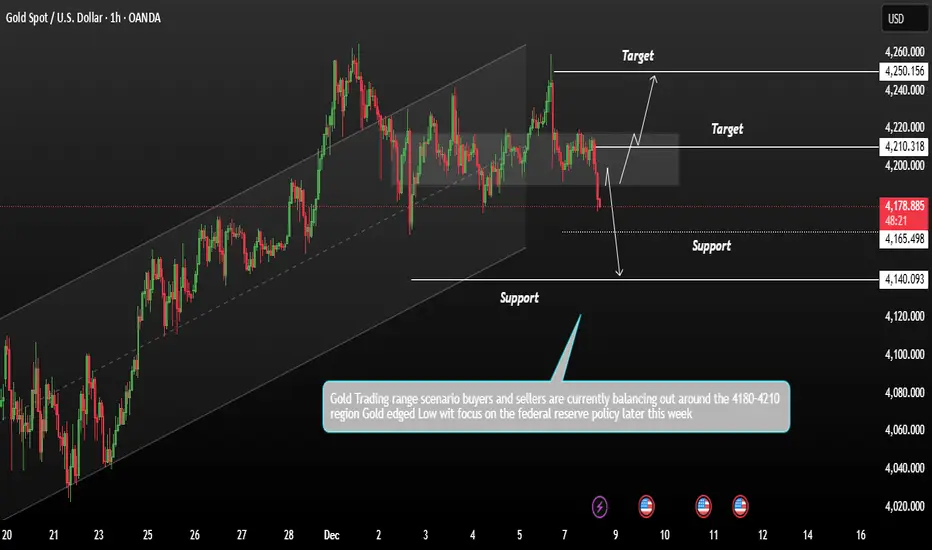
GOLD Consolidation Scenario pattern what should next move ?Gold has been respecting both the upper and lower trendlines for several sessions. After a strong climb during the previous days, the market has now moved into a consolidation phase near the mid-range of the channel, signalling that buyers and sellers are currently balancing out around the 4180–4210 region.
In the highlighted zone, price is fluctuating inside a tight range, indicating indecision but also suggesting that a larger move is building. This grey area represents a key decision zone a breakout above it could reactivate bullish momentum, while a breakdown below it may open the door for deeper retracement.
If buyers manage to defend the near-term support around 4200–4210, and price pushes back above the consolidation block, an upside breakout open the path toward the next target are 4250 / 4260, aligning with the upper side of the broader channel.
If price fails to hold the current support zone, then a rejection from this consolidation area can push gold downward toward the next key support at 4165. A decisive break below 4165 would indicate that sellers are taking control, and the market could slide further toward the deeper support around 4140, which is marked as a major demand zone and the lower boundary of the channel structure.
You may find more details in the chart,
Trade wisely best of Luck Buddies.
Ps; Support with like and comments for better analysis thanks for supporting.
XAUUSD Bullish Trend in Play — Path Open Toward 4,300 TargetHello traders! Here’s my technical outlook on XAU/USD (Gold) based on the current market structure. Gold remains in a broader bullish trend, supported by a clearly defined rising Trend Line that has guided price action since the beginning of the impulsive move. After the initial breakout from the Support Level, the market formed a well-structured range, followed by a corrective pullback and another consolidation phase, confirming healthy bullish rotation. Price is currently trading above the key Support Level near 4,140, while attempting to stabilize above the rising Support Line, which keeps buyers in control of the short-term structure. The recent breakout from the second range indicates renewed bullish momentum, with price now approaching the major Resistance Level around 4,260–4,270. As long as Gold holds above the support zone and respects the ascending trendline, the bullish scenario remains valid. The structure suggests continued pressure toward the upside, with TP1 positioned near 4,300, which aligns with the next key resistance area. A clean breakout above this level could open the door for further trend continuation and higher upside targets. However, a failure to hold the Support Line could lead to a deeper pullback toward the lower support zone. For now, the technical structure favors the buyers, with bulls aiming for a retest and breakout of the 4,260–4,300 resistance zone. Please share this idea with your friends and click Boost 🚀

THE KOG REPORT THE KOG REPORT:
In last week’s KOG Report, we wanted to see the immediate resistance fail and give us the short trade into defence which worked well. Due to there being now break of defence and our indicators suggesting a long, we managed to get a long into the higher defence box which ultimately broke. You can see the pull back having taken place and the result was our red box targets and target region on Excalibur being completed for the end of the week.
The power of boxes and Excalibur coupled with the indicators again giving us direction for the market and a decent result on gold.
So, what can we expect for the week ahead?
Quick one this week so in brief. Key level resistance for Monday is the 4310 region which will need to break to then attempt a higher high, while the key level of support is sitting at 4260-5 and below that 4250. If either of these levels below are targeted and we get a RIP, we’ll be looking to long into the higher level. It’s that higher level that needs to be monitored this week and will need to break! Failure again there can result in another strong sell off coming up to the Christmas break so let’s play caution and remember it’s December; liquidity is all over the chart and many institutions are winding down for the festive period. December is known to be a very choppy month as most professional traders take it easy.
RED BOXES:
Break above 4310 for 4320, 4333, 4335 and 4348 in extension of the move
Break below 4290 for 4275, 4365, 4260 and 4253 in extension of the move
Please do support us by hitting the like button, leaving a comment, and giving us a follow. We’ve been doing this for a long time now providing traders with in-depth free analysis on Gold, so your likes and comments are very much appreciated.
As always, trade safe.
KOG

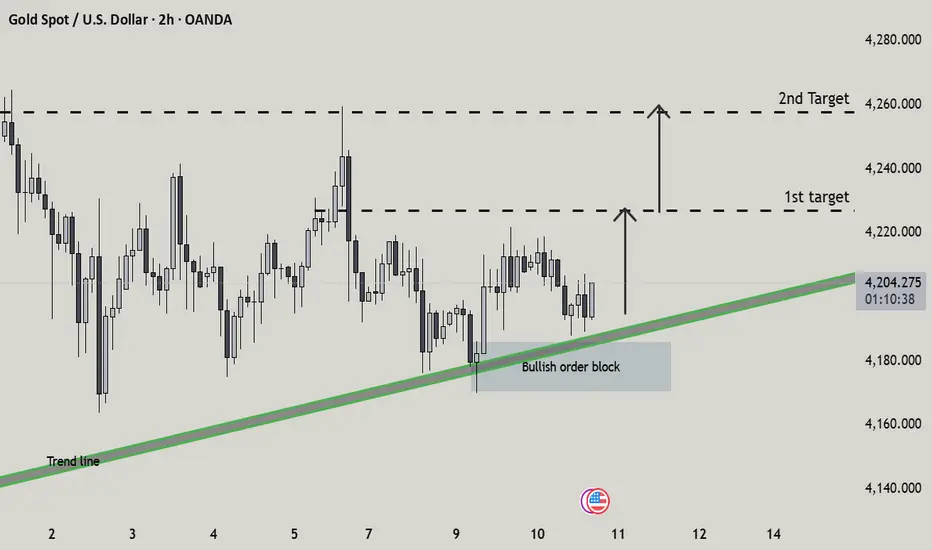
Gold Poised for a Breakout? Trendline Support + OBThis chart shows Gold respecting a strong ascending trendline while also tapping into a clearly defined bullish order block, suggesting a potential upward reaction. Price is hovering near support with projections toward the first target around 4,220 and a second target near 4,260 if momentum continues. The setup highlights a classic confluence of structure, demand, and breakout potential—often a precursor to strong moves in trending markets.
Do you think Gold will break above the first target zone, or will it reject and fall back to the trendline again?
GOLD Current Consolidation range remains bullishGold Consolidation bullish range after price holds the support manage bulls the signal the end of consolidation and start of the next up side.
Gold prices hovered near $4,200/oz on Monday, stabilizing after last week’s decline as traders awaited the Federal Reserve’s final policy meeting of the year. Markets widely expect the Fed to begin cutting rates, while mixed U.S. employment data and core inflation in line with expectations have strengthened the case for additional monetary easing.
From a technical perspective, the current range remains bullish. If bulls manage to defend the 4,200 support zone, if the break the support then again for bullish chance 4190 then gold may regain upward momentum. A sustained hold above this level opens the door for a potential move toward the 4,242 / 4,282 resistance area.
You may find more details in the chart.
Trade wisely best bod Luck.
Ps; Support with like and comments for better analysis thanks for supporting.

Gold Price Update – Clean & Clear ExplanationGold Price has been moving within a descending trendline structure but is currently approaching a strong support zone where a reversal is expected.
Key Highlights:
Support Zone: Price is reacting around a major demand area near 4175–4185, indicating potential buying pressure a breakout above the descending trendline signals bullish momentum.
1st Target: Around 4225
2nd Target: Around 4255
The chart indicates two possible accumulation movements before a strong upward push marked in red below the support area, showing the invalidation region this setup suggests a high-probability long opportunity if price confirms support and breaks upward from the trendline structure.

XAUUSD 4H MA50 break signals lower prices.Gold (XAUUSD) has been trading within a Channel Up in the past 1.5 month. Within this pattern, every time the 4H MA50 (blue trend-line) broke downwards, the price tested the Higher Lows trend-line.
As a result, we expect Gold to reach 4115 next, which will be an interesting cluster as marginally below will be the Support Zone o the 4H MA200 (orange trend-line) and more importantly the 1D MA50 (red trend-line). That will most likely decide the long-term trend.
---
** Please LIKE 👍, FOLLOW ✅, SHARE 🙌 and COMMENT ✍ if you enjoy this idea! Also share your ideas and charts in the comments section below! This is best way to keep it relevant, support us, keep the content here free and allow the idea to reach as many people as possible. **
---
💸💸💸💸💸💸
👇 👇 👇 👇 👇 👇

Gold 30-Min — Volume Buy Reversal Triggered⚡Base : Hanzo Trading Alpha Algorithm
The algorithm calculates volatility displacement vs liquidity recovery, identifying where probability meets imbalance.
It trades only where precision, volume, and manipulation intersect —only logic.
✈️ Technical Reasons
/ Direction — LONG / Reversal 4200 Area
☄️Bullish momentum confirmed through strong candle body.
☄️Structure shifted with higher-low near key demand base.
☄️Volume expanding confirms order-flow alignment upward.
☄️Buyers reclaimed imbalance with sustained clean break.
☄️Algorithm detects rising momentum under low liquidity.
⚙️ Hanzo Alpha Trading Protocol
The Alpha Candle defines the day’s real control zone — the first battle of momentum.
From this origin, the Volume Window reveals where the next precision strike begins.
⚙️ Hanzo Volume Window / Map
Window tracked from 10:30 — mapping true market behavior.
POC alignment exposes institutional bias and breakout potential zones.
⚙️ Hanzo Delta Window / Pulse
Delta window monitors real buying vs. selling power behind each move.
Tracks volume aggression to expose who controls the candle — buyers or sellers.
When Delta aligns with Volume Map, momentum becomes undeniable.

Gold - The bullrun top happens now!✂️Gold ( OANDA:XAUUSD ) is heading for a major reversal:
🔎Analysis summary:
After the all time high breakout back in 2024, Gold has been rallying about +115% until today. During this entire move, Gold did not create any real correction. Considering that Gold is currently retesting a major resistance trendline, the bullrun top happens now.
📝Levels to watch:
$4,000
SwingTraderPhil
SwingTrading.Simplified. | Investing.Simplified. | #LONGTERMVISION

XAUUSD: Rejection at Resistance - Support Zone at 4,270 in FocusHello everyone, here is my breakdown of the current XAUUSD setup.
Market Analysis
Gold (XAUUSD) is trading within a broader bullish structure, but the current price action suggests a short-term corrective move. After breaking above the descending Triangle Resistance Line, price entered a consolidation Range, where accumulation formed before a bullish Breakout. This breakout pushed XAUUSD higher toward the key 4,350 Resistance, which has acted as a strong reaction zone in the past.
Currently, at this resistance level, price showed clear hesitation and rejection, signaling that sellers are becoming active again. The market is now pulling back from the highs, moving toward the 4,270 Support Zone, which aligns with the previous breakout area and the rising Triangle Support Line. This zone is critical, as it represents the main demand area keeping the structure bullish.
My Scenario & Strategy
My scenario is short-term bearish as long as XAUUSD remains capped below the 4,350 Resistance. I expect a controlled pullback toward the 4,270 Support, where buyers may attempt to defend the trend.A clean breakdown below the support zone would confirm a deeper correction toward the Triangle Support Line.
However, if price holds above 4,270 and shows strong bullish reaction, the broader uptrend remains intact and another attempt toward the highs may follow. For now, the focus is on the pullback phase, with 4,270 as the key level to watch.
That's the setup I'm tracking. Thank you for your attention, and always manage your risk.

Elite | XAUUSD 30m Accumulation Under Premium ZoneOANDA:XAUUSD
Gold continues to move inside a tightening accumulation structure below the buy-side liquidity pool at 4250–4260. Multiple sweeps into the 4180 demand block have resulted in higher lows and trendline support continuation. As long as demand holds, price continues to build long-side liquidity for a break upward.
Bullish Continuation Scenario (Primary Bias)
Price must hold above 4185 and break the short-term breaker at 4218–4222.
Once reclaimed:
🎯 Target 1 → 4232
🎯 Target 2 → 4250–4260 (main liquidity objective)
🎯 Extended → 4274 rejection ceiling
Bearish Breakdown Scenario
If price closes below 4,200.316, the bullish structure collapses.
📉 Objective 1 → 4170
📉 Objective 2 → 4155 (invalid zone hit)
📉 Objective 3 → 4120 HTF rebuy zone
Note:
Until price breaks 4222, gold is still in consolidation.
No breakout = no trend continuation.
⚠️ For educational purposes only.

XAU/USD | A free fall or an bullish attempt? (READ THE CAPTION!)As you can see, Gold has been moving on a range recently, with no clear intention as to where it is headed. A possible scenario could be dropping down to the 4164 NDOG and then an uptrend move above the pool of liquidity above 4265 and the 4272 FVG.
However if it fails to make a move at that level, it'll drop further to 4111-4159 IFVG, which then I expect it to bounce back and go up again. However, if it fails to make a move then, we will witness a free fall of Gold.
Let's see what happens.
