GOLD UPDATE VIEW – XAUUSD Eyes 3540 as Bullish Momentum Builds As highlighted in this morning’s analysis, Gold continues to show impressive strength while the USD weakens on expectations that the FED will cut rates soon. This is driving capital away from cash and back into Gold as a safe-haven asset.
🔎 Current Market Update
After consolidating around 3480 – 3490, Gold has now broken out strongly, moving towards the buy-side liquidity zone (3509 – 3515).
The overall structure remains bullish, with no clear signs of reversal yet.
Market is likely to test liquidity around 3509 – 3515, and if momentum holds, the next big target sits at the 3540 resistance zone.
📊 Updated Trade Plan
BUY ZONE (trend-following): 3488 – 3485
SL: 3480
TP: 3500 – 3509 – 3515 – 3530 – 3540
SELL ZONE (high risk): 3540 – 3543
SL: 3550
TP: 3530 – 3520 – 3510
👉 Current market conditions favour buying pullbacks in line with the trend. Consider shorting only if there is strong confirmation around 3540.
⚠️ Risk Note
Volatility remains very high, with sudden liquidity grabs possible. Always stick to TP/SL levels to protect your account.
💡 Summary: Gold’s bullish momentum remains intact. As long as the FED outlook supports rate cuts and USD stays weak, Gold is likely to keep climbing, with 3540 as the key upside target.
✅ Follow MMFLOW TRADING for daily market insights and updated trade plans on Gold.
GOLDMINICFD trade ideas

Gold still holding on Bulls are gonna see more this weekend? TVC:GOLD price overall is bullish and has now formed an Ascending Triangle. As price is now doing a rest on those previous highs resistance will now become suitable support. So we're most likely to see more bulls this week as investors focus on Bulls but anything can happen Daily time frame confirmation . Do let me know what you think on the comment session.

XAUUSD Buy Setup Again - Lets Dive InHello All,
Hope everyone is doing well. Again with a small buy setup for Gold SL & Target set on the chart. Lets see how it works now.
Best of Luck

DeGRAM | GOLD reached the $3540📊 Technical Analysis
● XAU/USD surged into the 3,540 zone but shows exhaustion candles near resistance, with the chart projecting a corrective pullback.
● A retest of 3,500 support is likely, and failure to hold risks further downside toward 3,440 within the broader consolidation structure.
💡 Fundamental Analysis
● Hawkish Fed comments and stabilizing US yields are reviving dollar strength, which could cap gold’s upside in the short term.
✨ Summary
Bearish below 3,540; targets 3,500 → 3,440. Invalidation on a close above 3,545.
-------------------
Share your opinion in the comments and support the idea with a like. Thanks for your support!

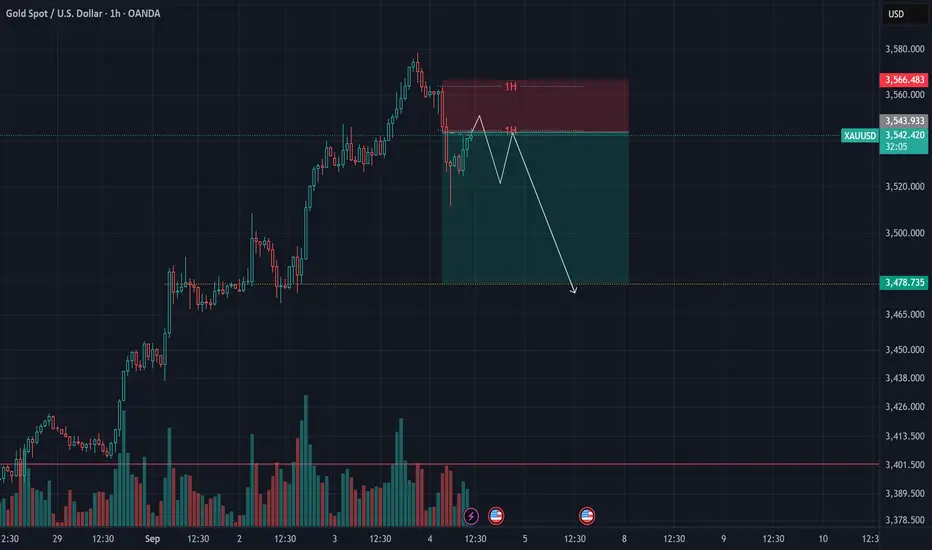
Gold Analysis – September 3, 2025In recent days, Gold has been relentlessly printing new highs, and this continued up until yesterday. However, today’s price action is showing the first signs of a possible correction.
Looking at the broader chart, the trend is still decisively bullish, meaning any counter-trend trades carry significant risk.
🔸 For sellers, a strong confirmation would only come if we see a 4H close below 3468 – that’s where a bearish outlook starts to make more sense.
🔸 If you’re still aiming for a counter-trend short, the 3540 – 3560 zone on the 1H timeframe could be considered, but only with strict risk management.
The potential downside target sits near 3473.
⚠️ Keep in mind: a 1H close above 3565 invalidates this setup.
XAUUSD – Bearish Crab Signals a Potential PullbackXAUUSD – Bearish Crab Signals a Potential Pullback
Today’s macro backdrop is weighing on gold as the USD recovers and bond yields edge higher, reducing expectations of an imminent Fed rate cut. This has cooled safe-haven demand and opened the door for profit-taking after the strong rally.
On the H4 chart, price has completed a Bearish Crab pattern at key extension levels, with reversal signals emerging near the 3,550 peak. This suggests the market may be entering a short-term corrective phase.
Key levels to watch:
Near-term resistance : 3,540–3,555
Target support 1 : 3,475–3,450
Target support 2 : 3,350–3,330
Deeper support : 3,290–3,270
The short-term bias has shifted toward the downside. Any technical pullback is likely to offer opportunities for sellers to rejoin.
Where do you think gold will find its next support in this correction?

Gold and Its Hidden Catalyst: Is a New Bull Cycle on the HorizonBy Ion Jauregui – Analyst at ActivTrades
Gold (Ticker AT: GOLD) is once again at the center of financial debate. After years of solid gains and an undisputed role as a safe haven, a little-explored factor could trigger an unprecedented bull cycle: the potential revaluation of the United States’ official gold reserves.
The Hidden Catalyst
The United States holds 261.5 million troy ounces in official reserves, valued on the books at only $42.22 per ounce, or roughly $11 billion in total. However, the current gold price hovers around $3,500 per ounce, revealing a vast gap between accounting value and market reality. Some lawmakers, including Senator Cynthia Lummis, have proposed updating these reserves to market prices. The impact would be colossal: such an adjustment would represent about 3% of U.S. GDP, potentially used to reduce the deficit, lower public debt, or create a strategic fund tied to new reserves in bitcoin.
Global Implications
A revaluation of this magnitude would not only reinforce gold’s monetary role but also free resources to alleviate deficit pressures and debt interest obligations. At the same time, it could have an inflationary side effect, acting as an indirect monetary injection that weakens the dollar against gold and other currencies. If realized, this move could influence other central banks, creating a chain reaction with greater revaluation of global reserves and increased demand for gold as a strategic asset. Central banks’ interest already supports this thesis: in 2024, net purchases exceeded 1,000 tonnes of gold for the third consecutive year, and in 2025 buying momentum remains high. This trend validates gold’s role as a strategic monetary asset and increases pressure to adjust its official valuation.
Investor Perspective
A potential official revaluation of U.S. reserves could become one of the largest bullish catalysts in decades, solidifying gold as a hedge against U.S. fiscal risk, the erosion of the dollar as a global reserve currency, and geopolitical tensions. For investors, maintaining strategic exposure to the precious metal appears more relevant than ever. This can be achieved through physical gold, gold-backed ETFs, gold mining stocks, or hybrid instruments such as gold loans with additional yield.
The Gold Zapatero Sold at a Loss
During José Luis Rodríguez Zapatero’s government, the Bank of Spain carried out one of the largest reductions in gold reserves in recent history. Between 2005 and 2007, it sold around 242 tonnes, nearly half of the national stock, which fell from 523 tonnes to just 282 tonnes. In 2007 alone, more than 130 tonnes were sold under European central bank agreements aimed at diversifying assets and investing in sovereign debt. Since then, Spain’s gold position has remained virtually unchanged at around 281 tonnes, with no significant purchases, unlike other central banks that have increased their reserves in recent years.
At today’s price of $3,500 per ounce, Spain’s current gold reserves (281 t) would be worth approximately $31.6 billion. In contrast, the 242 tonnes sold under Zapatero fetched only ~$3.5 billion, meaning those reserves would now be worth ~$27.2 billion, more than seven times the sale price at the time.
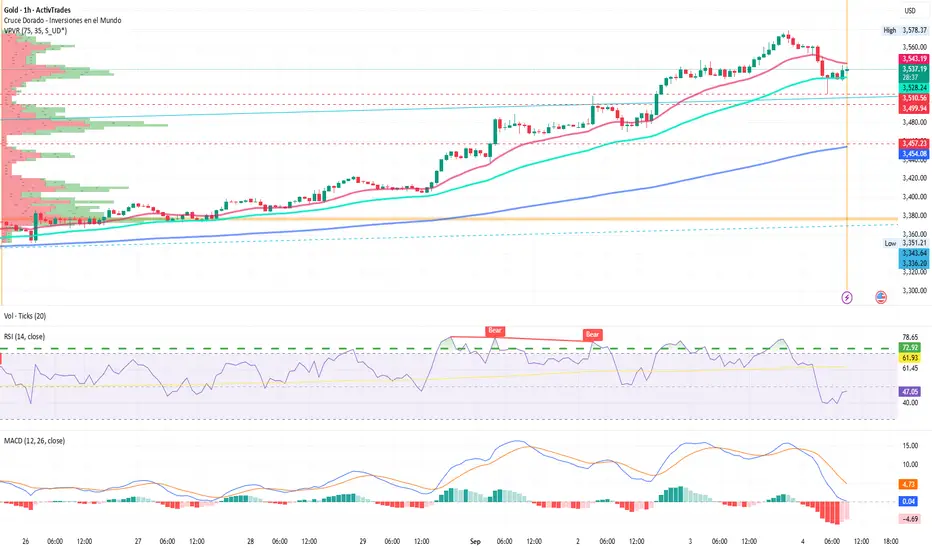
Technical Analysis of Gold (Ticker AT: GOLD)
Gold cash is currently trading slightly above $3,500 per ounce, consolidating after the strong bullish surge in August. The technical structure shows a market still dominated by buyers, although signs of overextension and sideways movement are emerging. The price has lost the 50-day moving average support and currently rests weakly above the 100-day average.
Key Levels
Immediate Resistance: $3,578.37 – a psychological zone coinciding with recent highs and selling pressure.
Next Resistance: $3,600 – round number and likely target if bullish momentum continues.
Immediate Support: $3,510 – a short-term reference; a break could trigger a deeper correction.
Relevant Support: $3,499.57 – confluence zone from the last impulse, acting as strong support for the recent bullish move.
Technical Indicators
RSI: ~39.41%, in oversold territory, suggesting potential price recovery.
MACD: bearish signal, with a negative histogram reflecting fatigue in the bullish impulse.
Moving Averages: price comfortably above the 50-day average, maintaining the underlying bullish trend.
Point of Control (POC): $4,777.97 in the previous accumulation zone.
Probable Scenarios
The technical bias remains bullish as long as gold holds relevant support and stays above the POC. However, oversold conditions increase the likelihood of temporary sideways consolidation to prepare for new highs. A drop below $3,457 would test the 200-day moving average and challenge the current trend, though institutional buyers may use the $3,510 support area to reposition. The recent surge has pushed prices above a long-term range recently broken with some force, suggesting a potential revisit of supporting trend lines to retest and surpass current highs.
Planned Fiat Devaluation and Return to the Gold Standard?
Gold sits at an inflection point where structural and technical forces converge. On one hand, the hypothesis of an official revaluation of U.S. reserves introduces a potentially transformative factor that could start a broad new bull cycle. The market shows a clear underlying positive trend with necessary consolidation phases. For institutions, gold is gaining appeal as a hedge against U.S. fiscal risk, dollar pressure, and uncertainty. In the short term, the market is defending supports and seeking to recover above the 50-day moving average. Long-term institutional accumulation and global monetary policy reinforce the thesis that gold will continue playing a central role in the international financial architecture—not just as a safe haven, but as a backbone of the future monetary system. Europe, and particularly Spain, will need to take measures to position its reserves strategically in line with this trend.
*******************************************************************************************
The information provided does not constitute investment research. The material has not been prepared in accordance with the legal requirements designed to promote the independence of investment research and such should be considered a marketing communication.
All information has been prepared by ActivTrades ("AT"). The information does not contain a record of AT's prices, or an offer of or solicitation for a transaction in any financial instrument. No representation or warranty is given as to the accuracy or completeness of this information.
Any material provided does not have regard to the specific investment objective and financial situation of any person who may receive it. Past performance and forecasting are not a synonym of a reliable indicator of future performance. AT provides an execution-only service. Consequently, any person acting on the information provided does so at their own risk. Political risk is unpredictable. Central bank actions can vary. Platform tools do not guarantee success.
Gold Trade Plan 04/09/2025Dear Traders,
After the strong rally in gold, there was a $60 correction, which shows us that the third bullish wave has been completed and the price has entered a corrective phase. The 0.23 Fibonacci and 0.38 Fibonacci levels are potential reversal zones to the upside. Considering the ascending trendline shown in the chart, the 0.38 Fibonacci level intersects with the trendline. It seems that the price may drop to this zone, and the 0.38 level would be a very suitable area for a buy position with a target of over 2000 pips.
Regards,
Alireza!

Xau short update Tp hit , it was a good entry but since we have again fundamental news today let's sit back.


Fomo is too big, selling pressure adjusts ADP-NF⭐️GOLDEN INFORMATION:
Gold (XAU/USD) extends its pullback from record highs near $3,579, easing lower in Thursday’s Asian session as calmer bond markets and stable equities trigger profit-taking amid overbought conditions. A firmer US Dollar adds pressure, though cooling labor market data and expectations of Fed rate cuts later this month help limit losses. Traders now await Friday’s Nonfarm Payrolls report for further direction.
⭐️Personal comments NOVA:
Gold price is accumulating around 3529, there are signs of downward adjustment to gain liquidity, be careful of larger declines
⭐️SET UP GOLD PRICE:
🔥SELL GOLD zone: 3600- 3598 SL 3605
TP1: $3585
TP2: $3568
TP3: $3552
🔥BUY GOLD zone: $3476-$3474 SL $3469
TP1: $3485
TP2: $3500
TP3: $3510
⭐️Technical analysis:
Based on technical indicators EMA 34, EMA89 and support resistance areas to set up a reasonable BUY order.
⭐️NOTE:
Note: Nova wishes traders to manage their capital well
- take the number of lots that match your capital
- Takeprofit equal to 4-6% of capital account
- Stoplose equal to 2-3% of capital account

Gold is ready to make new record XAUUSD is holding above support and pushing higher, targeting the new high zone around 3530 if momentum sustains.

GOLD Breakout Alert | Is $3,500 Next for XAUUSD?old has officially broken out of a key consolidation zone around 3375 – 3400, retesting the structure with strength. The bullish channel remains intact, showing higher highs and higher lows since the start of the year.
📈 Key Levels to Watch:
Support Zone: 3375 – 3400 (former resistance, now support)
Upside Potential: 3500+ if momentum continues
Invalidation: A daily close back below 3375
💡 Trading Idea:
As long as price holds above the red demand zone, bulls are in control. A healthy retest could set the stage for the next impulsive rally toward the channel top.
⚠️ Risk Note: Always manage risk carefully — markets can shift quickly.
👉 What’s your outlook on GOLD? Do you see this breakout running toward 3500+, or will bears drag it back inside the range? Share your thoughts below!
❤️ Don’t forget to like this post and drop your analysis in the comments — let’s learn together!

GOLD SHORTExpecting Gold short if H1 bearish engulfing.
SL - High of current day
TP - TP1 - 100 pips, TP2 - 200 pips, TP3 - Low of current day, TP4 - 3500
GOOD LUCK!

GOLD SHORTExpecting Gold short.
Entry - high of yesterday.
SL - high of the current week.
TP - TP1 - 100 pips, TP2 - 200 pips, TP3 - 300 pips, TP4 - 400 pips, TP5 - low of the current week.
GOOD LUCK.
NOTE: IF NEWS ARE GREEN/SELL, THE SELL MIGHT GO SHORT IMMEDIATELY.

XAUUSD short 3570 for intradayXAUUSD short 3570 for intraday from current rate til EOD short term short with potential to ride it down longer

Gold: A Potential Sell-off LoomsGold's climb has been nothing short of unprecedented. The precious metal surged by over 2,500 pips in just 11 days and a remarkable year-to-date gain of over 34%, or a 10,000-pip move. This kind of rapid ascent shows that a significant market correction is looming as traders begin to take profits.
Based on historical patterns, Gold often experiences high volatility toward the end of the year, which usually followed by a sharp downward move. The 3600.00 price level is a key psychological and technical resistance point, making it a potential entry for a sell trade.
You may consider a sell trade at or near the 3600.00 price level, anticipating a correction from the current overextended run.
Target are 3450.00 and 3300.00 price levels. (as seen in the chart)
Stay safe in the market and trust your analysis.

Gold will reach gann number 3729 cant break that number for nowGold will reach Gann number 3729 cant break that number for now. so Sellers can enter around 3729. After fall from 3729 buy the dip and Target for buy will 3988.

GOLD poor economic data report send gold to new all time high,we saw the US10Y AND THE DXY SINKING .
if we move gold to 3599-3600 ,i will like to sell on that supplyroof to close the week.
as the week open GOLD will sell,
#gold #xauusd


GOLD: Absolute Price Collapse Ahead! Short!
My dear friends,
Today we will analyse GOLD together☺️
The market is at an inflection zone and price has now reached an area around 3,589.77 where previous reversals or breakouts have occurred.And a price reaction that we are seeing on multiple timeframes here could signal the next move down so we can enter on confirmation, and target the next key level of 3,580.33.Stop-loss is recommended beyond the inflection zone.
❤️Sending you lots of Love and Hugs❤️

Gold LONGAlright Folks, Gold delivered last 2 week as seen on this chart: www.tradingview.com
Now we have an interesting situation. At the moment the bets on Fed rate cuts are glowing, Gold reached an interesting point. This is a decisive point, where Gold will decide to either keep up with the momentum upwards. Now we will switch to the 1Hr timeframe to watch price action out for a break above friday's high and an entry on the 1Hr OB . Please this setup follows a clear fundamental narrative as well. As from wednesday we shall understand a clear direction. Looking at the other risk assets, the investors are switching to risk off, + the possible reduction of the opportu8nity cost of holding non-risk assets like gold. Tensions all over the world making to and fros. we have 2 possible scenarios for half day of monday, bullish continuation directly + a break and retest . If we see a deep retracement on Monday, look for a retest on the 1hr OB down there..
trade what you see, not what you think

GOLDAverage Hourly Earnings (m/m): Expected to rise by 0.3%, unchanged from previous.
Non-Farm Employment Change: Forecast at 75,000 new jobs, slightly above last month's 73,000.
Unemployment Rate: The latest figure is expected today but the forecast is not provided here.
How the US Dollar (USD) Might React to the Data:
If the data exceed forecasts (stronger jobs growth, higher hourly earnings, lower unemployment):
This signals a robust labor market and potential inflationary pressure.
The Federal Reserve might maintain or raise interest rates to prevent overheating.
The USD would likely strengthen as higher rates attract foreign capital and boost demand for the dollar.
If the data come in weaker than forecasts (slower jobs growth, stagnant or falling earnings, higher unemployment):
This suggests economic slowdown and reduced inflation risks.
The Fed may consider cutting or pausing rate hikes to support growth.
The USD would likely weaken as interest rate expectations decline and capital flows out.
Summary:
Positive labor data generally boost USD.
Negative labor data generally weaken USD.
Market reaction depends on how results influence the Fed’s monetary policy outlook.
If the actual unemployment rate is also released, I can provide an updated interpretation of its impact on the dollar.Here are the current US labor market data forecasts:
Average Hourly Earnings m/m: 0.3% (previous 0.3%)
Non-Farm Employment Change: 75,000 (previous 73,000)
Unemployment Rate: Expected today (forecast not specified)
How the USD Could React:
If actual data are greater than forecasts (e.g., stronger job gains, higher wage growth, lower unemployment), this signals a robust economy that could sustain Fed rate hikes or reduce the chance of cuts. The US dollar would likely strengthen as investors anticipate higher interest rates attracting capital inflows.
If actual data are less than forecasts (e.g., weaker job growth, flat wages, higher unemployment), it could indicate economic slowing and potential Fed easing. In this scenario, the US dollar would likely weaken as expectations shift toward lower interest rates or rate cuts.
The reaction depends on how these labor indicators influence market expectations around Fed monetary policy. Strong labor data usually support a firmer USD, while weaker data lead to a softer USD.
If the exact unemployment rate number releases, I can update the analysis further.Here are the current US labor market data forecasts:
Average Hourly Earnings m/m: 0.3% (previous 0.3%)
Non-Farm Employment Change: 75,000 (previous 73,000)
Unemployment Rate: Expected today (forecast not specified)
How the USD Could React:
If actual data are greater than forecasts (e.g., stronger job gains, higher wage growth, lower unemployment), this signals a robust economy that could sustain Fed rate hikes or reduce the chance of cuts. The US dollar would likely strengthen as investors anticipate higher interest rates attracting capital inflows.
If actual data are less than forecasts (e.g., weaker job growth, flat wages, higher unemployment), it could indicate economic slowing and potential Fed easing. In this scenario, the US dollar would likely weaken as expectations shift toward lower interest rates or rate cuts.
The reaction depends on how these labor indicators influence market expectations around Fed monetary policy. Strong labor data usually support a firmer USD, while weaker data lead to a softer USD.
