Time for GOLD To DROP! (is XAUUSD heading to the downside?)For weeks gold (XAUUSD) has been sky rocketing to the upside, however there have been many new signals indicating that it could be a bearish move to the downside. Nothing keeps going up forever! Gold has broken major support levels + trend line and channel breakout. Time to sell!
Trade ideas
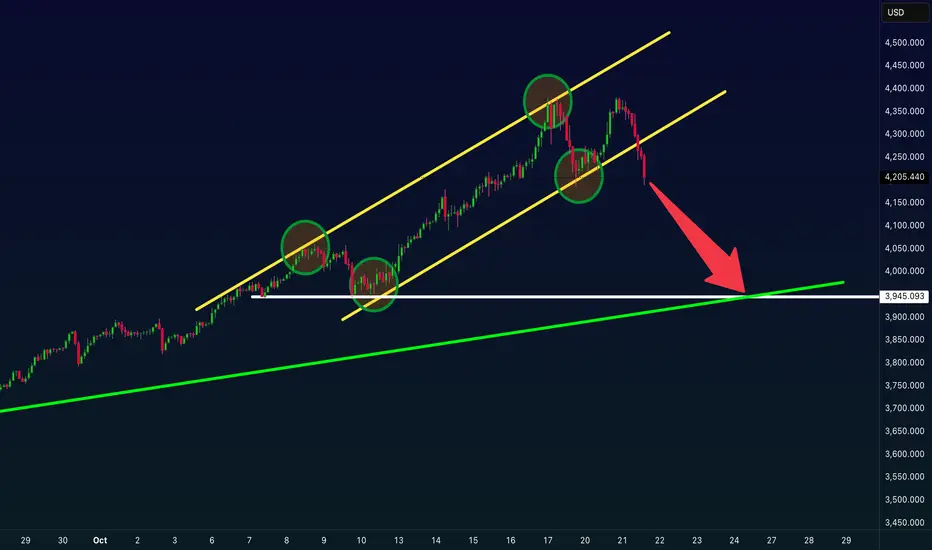
XAUUSD Bearish Structure Breakdown and Retest SetupSimple Analysis & Description:
The chart shows a Change of Character (CHOCH) at the top, signaling a possible end to the bullish trend.
Two major breakdowns occurred after price failed to maintain the ascending trendline, confirming bearish momentum.
A clear Break of Structure (BOS) formed, shifting market direction from bullish to bearish.
Price made a retest of the broken structure (highlighted yellow zone), which often acts as a new supply zone.
The gray zone below marks the next potential demand area or target zone, where price could react or find support.
The Ichimoku Cloud is now above the candles, indicating bearish pressure and potential continuation to the downside.
Summary:
➡️ Trend: Bearish
➡️ Key Zone: 4,297–4,329 (supply / retest zone)
➡️ Target Zone: 4,221 area (potential demand/support)


Gold Bearish Bias for the Day📅 Tuesday, Oct 21, 2025
🕓 4H Timeframe
1️⃣ Market Context
After a strong impulsive bullish run, GOLD is currently consolidating near a heavy supply zone ($4340–$4370).
Price has failed to make a new higher high and is now showing early signs of exhaustion — potential short-term distribution in progress.
2️⃣ Bias: Bearish (Intraday/Short-Term)
Expecting a retracement or corrective leg back into the previous demand zone ($4200–$4230).
This could form a clean short-term sell opportunity before the next major bullish continuation resumes.
3️⃣ Trade Plan
Entry Zone: 4340–4360 (Short/Sell entries from premium supply zone)
Stop Loss: Above 4375 (above previous swing high / invalidation)
Targets:
TP1 → 4290
TP2 → 4250
TP3 → 4205 (final demand zone retest)
RRR: 1:3+ potential depending on entry precision
4️⃣ Confirmation Triggers
✅ Bearish engulfing or rejection wick from supply zone
✅ BOS (Break of short-term structure) on lower TF (1H/15M)
✅ Volume drop on retest = ideal entry signal
5️⃣ Intraday Summary
If GOLD holds below 4360 — bias stays bearish.
Only a clean 4H close above 4375 will flip structure bullish again.
Until then, focus on shorting premium areas toward discount levels below $4250.
💬 Conclusion:
"Sell the premium, buy the discount" — today GOLD looks ripe for a controlled bearish correction before the next leg up. Stay patient, wait for confirmation, and don’t chase longs inside supply.


Double top Pattren Formed ! Gold faced strong rejection from the major supply zone around 4375
Demand Zone: Around 4207, where buyers may look to step in again

WE ARE SELLING If you couldn't enter around 3am then you can still sell around 4340-45 and target tp at 4250 if you don't want stress and if it's able to close below 4190 then you targets another sell at 4195-4200 and hold, if you like to hold from 4340-4345 too, you can hold till it moves below 4190 then you add another position but it could fail to move below 4250 or any of the rectangular block below so manage it though it looks like it's going to sell more for some days but still it best to manage it by locking profits if it reaches 4250 or closing it.

4,200 or 4,285? Gold’s Next Move Decides It All📊 Market Overview
Gold remains under pressure at the start of the week, trading below last week’s record highs, after a sharp correction from the 4,380s down to the 4,240 zone.
Investor sentiment is cautious as the market navigates a mix of uncertain U.S. economic data, a still-closed U.S. government, and renewed geopolitical tensions across multiple regions — all of which are fueling both fear and indecision in the market.
During early Asian hours, gold showed a mild recovery but continues to move sideways in a tight consolidation range, reflecting indecisive liquidity buildup before the next major move.
🧠 Technical Structure (MMFLOW View)
Gold is consolidating between short-term support near 4,206–4,204 and resistance around 4,285–4,287.
Liquidity has started to cluster above and below the current range, suggesting that a breakout is imminent.
The 4,166 – 4,140 region remains a major Smart Money re-entry zone, aligned with the CP BUY ZONE + OBS demand block.
On the upside, 4,313 – 4,342 stands as a key supply zone where large sellers previously stepped in.
Until price breaks out decisively, traders should expect choppy intraday conditions with limited follow-through.
🔑 Key Levels to Watch
🟢 BUY ZONE (Liquidity Re-entry Zone)
Zone: 4,206 – 4,204
SL: 4,200
TP: 4,210 – 4,215 – 4,220 – 4,230 – 4,240 – 4,250 – ???
🔴 SELL ZONE (Liquidity Reaction Zone)
Zone: 4,285 – 4,287
SL: 4,292
TP: 4,280 – 4,275 – 4,270 – 4,260 – 4,250 – ???
⚙️ MMFLOW Scenarios
1️⃣ Bullish Scenario:
If gold sustains above the 4,200 – 4,210 support area, a short-term rebound toward 4,270 – 4,285 can be expected.
Breaking above 4,287 would open room toward 4,313 – 4,342 (OBS Sell Zone), where Smart Money may begin distributing again.
2️⃣ Bearish Scenario:
A clean break below 4,200 could trigger a deeper retracement toward 4,166 – 4,140 (CP BUY ZONE).
This would still represent a healthy correction within the broader bullish macro structure.
⚡ MMFLOW Insights
Market remains neutral-to-bullish, but current movement reflects accumulation within a compression range.
Sideway structure indicates the market is loading liquidity for the next impulsive leg.
Patience is key — traders should wait for clean breakout confirmations before scaling positions.
⚠️ Trading Notes
✅ Use tight Stop Losses — gold’s volatility remains unpredictable during macro uncertainty.
✅ Avoid over-leveraging while price stays inside the sideway channel.
✅ Focus on reaction zones (CP, OBS, and liquidity sweeps) for precise entries.
🧭 Quick Summary
Gold trades sideways below record highs.
Key support: 4,206 – 4,204, key resistance: 4,285 – 4,287.
Short-term bias: Range-bound with bullish undertone.
Best approach: Buy dips at liquidity zones; wait for breakout confirmation before trend trades.

Simple XAUUSD Strategy That Just Made 100 Pips!Gold played out beautifully today with a clear 100-pip move to the downside. After testing resistance near 4240, price showed rejection with strong bearish candles, confirming exhaustion from buyers and giving a clear sell signal.
The structure shifted from higher lows to lower highs, signaling the start of a short-term correction. Once price broke below the intraday support zone, momentum carried it smoothly down toward 4145 — completing a perfect swing move.
No complex indicators were needed. Just clean market structure, rejection candle confirmation, and patience for entry. The dollar strength added extra pressure on gold, aligning with the technical view.
Key takeaway: follow structure, not emotion. A simple rejection and structure break can deliver more than any over-complicated setup. Consistency comes from clarity.
Trade closed around 4145 with a solid 100-pip gain. Now watching the 4140–4130 zone for possible reaction or bounce setup before the next move.
#XAUUSD #Gold #PriceAction #Breakout #SmartMoney #TechnicalAnalysis #DayTrading #Scalping #TradingView

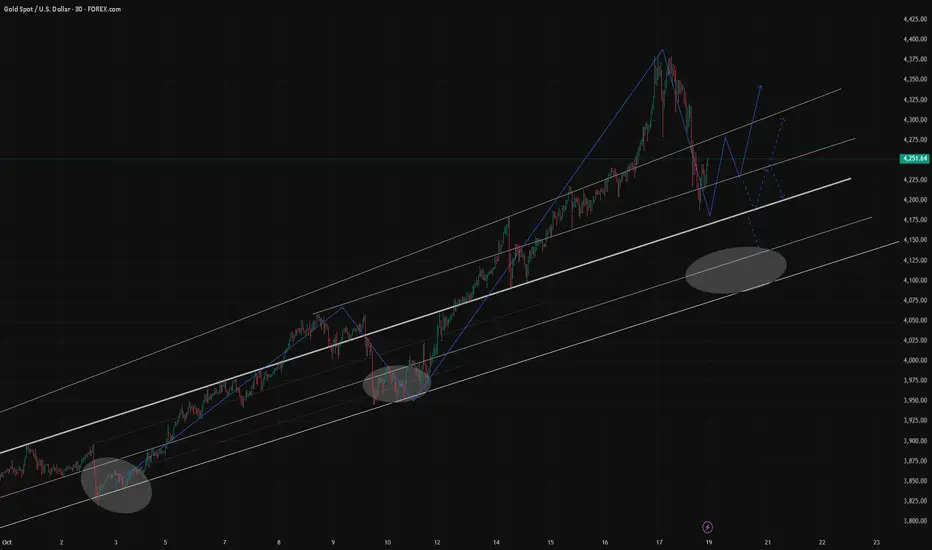
XAU/USD: Consolidating Above Breakout Zone with Bullish MomentumXAU/USD maintains its bullish structure inside the ascending channel, forming a new A-B-C pattern following a clean breakout above the compression zone. Price is currently consolidating above the 4200 level, establishing a potential base for the next impulsive leg.
A sustained move above 4200 could open the way for a rally toward 4290, retesting the resistance zone. With higher highs and channel integrity in place, momentum remains strong, supporting the continuation of the broader uptrend.

Technical Analysis – Rising Wedge Breakdown ProbabilityAnalysis
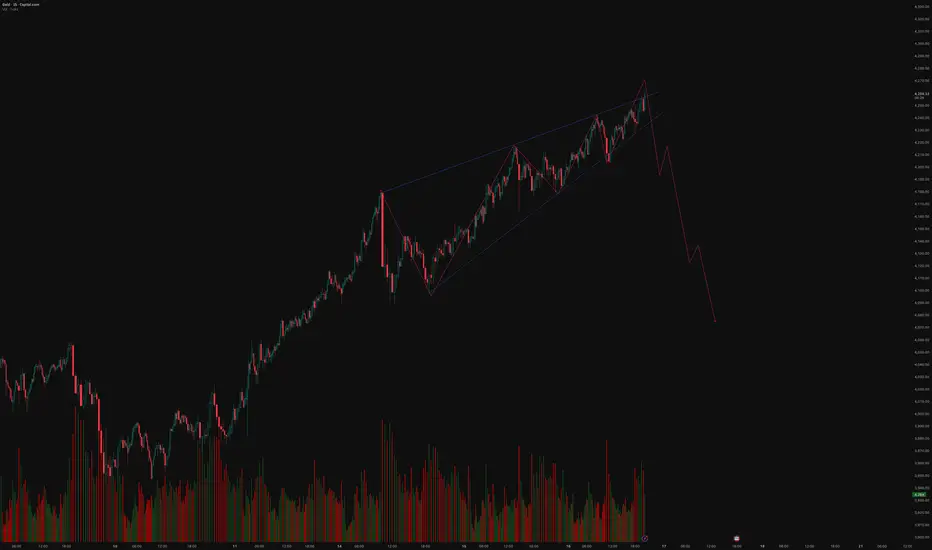
Pattern: A rising wedge has formed with converging trendlines — higher highs and higher lows narrowing into the apex.
Volume: Noticeable volume contraction during the formation, which often precedes a breakdown.
Current Position: Price appears to have made an upward breakout attempt, which may turn out to be a false breakout, a common precursor to a sharp downside move.
Projection: Once the lower trendline breaks decisively, a fast and impulsive decline toward lower support zones is probable — as shown by the projected path in red.
Summary
The structure suggests bearish momentum building up beneath the surface, with the recent false breakout likely to trap late buyers.
If confirmed with a close below the wedge support, this pattern could trigger a strong downside wave, potentially retracing the entire wedge formation.
Disclaimer
This analysis is for educational and technical discussion purposes only.
It does not constitute investment advice or a trading recommendation.
Please conduct your own research or consult a certified financial advisor before taking any trading positions.
Gold Forms Double Top — Bears May Target 4150Gold ultimately formed a double top, and the decline followed a similar pattern to last Friday. Similarly, it failed to hold above 4352 amidst volatility, falling to around 4317 before rebounding. However, the rebound also failed to effectively convert resistance near 41 into support, leading to a rapid decline! The price has once again returned to support near the MA30 on the 4H chart.
A rapid decline is often accompanied by a rebound, but if the rebound fails to break through resistance, it can only serve as a buffer during the downtrend. If the pattern arrangement and indicators also favor a bearish trend, the subsequent decline is likely to be even more drastic (absent breaking news).
Now the price has rebounded to the resistance zone, and the strong resistance is still around 4300. If the rebound cannot gradually recover, then we must pay attention to the trend support. If it falls below, a similar trend as marked in the figure is likely to appear, and the short position may point to around 4150 or even lower.

XAUUSD_2H_SellGold Analysis
Elliott Wave Analysis Style
Medium-Term Time Frame
The market is in wave 5 of the uptrend, and the end of wave 5 can be considered as the numbers 4202, 4222, and 4244 dollars, after which the market enters a strong decline and moves towards 4004 and 4044 dollars.

GOLD Resistance? what's next??#GOLD.. perfect move as per our last idea regarding gold cut n reverse area.
now market just broke his supporting region and if market hold that region than it will convert to resistance area.
that is around 4281-892 to 4287-88
keep close and holding or that region means we can expect a further dip .
NOTE: we will go for cut n reverse above that region on confirmation.
good luck
trade wisely

XAUUSD Bearish analysis EMA50 Breakdown 📉 XAUUSD (Gold) Technical Update 💰
Gold faced strong rejection from the major supply zone around 4375 🔻
After breaking below the 50 EMA, bearish momentum is clearly building on the 30M timeframe ⚙️
Current Price: 4330 🟡
🎯 Technical Targets:
1️⃣ 4313 – First support level
2️⃣ 4287 – Second target zone
📍 Key Demand Zone: Around 4207, where buyers may look to step in again 🏦
💡 Bias: Bearish below 4375 / Watch for reactions near 4313 and 4287 for potential short-term scalps or pullbacks.
#XAUUSD #Gold #PriceAction #ForexAnalysis #TechnicalAnalysis #TradingSetup #BearishTrend 📊

XAUUSDBased on my previous analyses, where I projected gold to rise from $2,900 toward $4,500, the price has now reached $4,380. However, this is not the end of the move. There is still a small upward leg remaining, likely targeting around $4,565 to complete this wave count. After that, gold is expected to enter a corrective phase lasting roughly one year, with a potential decline toward the $3,200–$3,120 range. For now, we’ll continue following this current wave until it completes, and then we’ll proceed with the next stages of the analysis.

Gold Rebounds From Demand zone- Bulls Eye 4500$ Target Technical Analysis (1H Chart)
Structure:
Gold remains in a strong ascending channel, with price consistently respecting both the upper and lower trendlines.
The lower black trendline (marked by blue arrows) has acted as a dynamic support multiple times.
The upper black line is serving as a trendline resistance, with potential rejection zones near $4,550–$4,560.
Current Pattern:
Inside the main channel, a smaller parallel structure (rising wedge/inner channel) is forming — showing potential accumulation or continuation within the trend.
This usually precedes a breakout move toward the upper zone of the larger channel.
Key Levels:
Support: $4,200 – $4,220 (Major support zone)**
Current Support Zone: Around $4,250 (near trendline confluence and previous rejections)
Resistance: $4,455 – $4,560 (target zone / channel top)**
Technical Bias:
✅ Bullish above $4,200 support
❌ Bearish breakdown below $4,200 may open room to $4,100–$4,050
💹 Price Action View
Triple rejection from the midline shows short-term liquidity grabs before continuation.
Each rejection was followed by higher lows, showing buyers’ defense (sign of demand zone creation).
The blue arrows represent areas where price tapped liquidity and rebalanced inefficiencies — typical of smart money retracements before continuation.
Next expected move:
Price may:
Tap once more near $4,250 (liquidity sweep of recent lows)
Then rally toward $4,450–$4,550
🧭 SMC (Smart Money Concept)
Liquidity & Demand Zones:
Liquidity below $4,250 (equal lows)
Demand Zone: $4,200–$4,240 → ideal institutional entry
Imbalance/FVG: Between $4,300–$4,360, which price may fill before next push
Market Structure:
Higher Highs & Higher Lows intact (bullish structure)
Internal BOS (Break of Structure) on minor pullbacks confirms healthy trend
Expectation: Re accumulation phase → move to premium zone (above $4,500)
SMC Setup Idea:
Wait for liquidity sweep at $4,250
Entry: On bullish BOS on lower TF (M15–M30)
TP1: $4,400
TP2: $4,550
SL: Below $4,200

XAUUSD Update GOLD price Rejected at 4380, Bearish ?After rejected at 4380 price, Gold's price have a big posibility will have a correction more further.
We will follow the price as it would be make a lower low on next movement.
Bearish seasson will come ? We'll see
Another sign that we must give attention on it :
- The Biggest Red daily candle ( almost 2000 pips )
- Candle momentum
- Double top at 4380
- long wick on weekly candle
Have a blessing week ahead !

GOLD XAUUSD: Looking to short.Bearish within bullish. Is that a thing? Waiting for the first BOS and then a pullback. Then probably looking for sell entry once the second BOS happens.
However if the first BOS didn't happen then it will continue bullish.
Go GOLD!

Position Longs with 4250 as Key SupportGold maintained a consolidative pattern on Monday, gradually rebounding after testing the 4188 low and reaching a high near 4270. Technically, the price is currently trading within a bull flag consolidation pattern on the hourly chart. Key support has shifted higher to the 4250 level, while initial resistance lies in the 4280-90 zone. The market awaits a directional breakout.
For trading, use 4250 as a key support reference to position long orders on dips. The near-term target is the 4280-90 area. If gold manages to close firmly above 4290 during the U.S. session, it would signal a potential end to the consolidation phase, opening the path toward 4300 and possibly 4310. Conversely, a breakdown below 4250 would indicate a deeper correction risk.
Closely monitor the 4280-90 resistance band and the integrity of 4250 support. Trade in the direction of the confirmed breakout and ensure strict stop-loss placement for risk control.

What to Do When the Market Is in an Uptrend?Hello everyone,
When the market is rising , most traders get excited. Every price push feels like a wave of enthusiasm – everyone believes they are on the winning side. But in reality, even in the most favorable conditions, not everyone makes a profit . The simple reason: a rising market does not automatically mean a win; it’s about knowing when to buy and when to wait . I’ve seen many traders jump into positions just because the price is going up, only to be surprised when the market pulls back . An uptrend is not a straight line up, but a series of higher highs – pullbacks – higher highs , and the winners are those who know how to choose the right timing.
Confirm the Trend – Don’t Confuse Uptrend with a Technical Rebound:
Before placing a trade , the first step is to confirm whether the market is truly in an uptrend . A proper uptrend should have higher highs and higher lows , with the price staying above moving averages like EMA 20, EMA 50, or above the Ichimoku Kumo cloud . If the price just bounced from a low after a sharp decline, it may only be a technical rebound , and confusing the two can make you buy at the top . For example, when gold keeps forming new highs at 1,920 – 1,940 USD/ounce, while the lows remain higher than the previous ones, the money flow clearly supports the uptrend .
Buy on Pullbacks – “Buy the Dip” Is a Smart Entry:
Once the uptrend is confirmed, the next step is to choose the right entry point . Don’t rush to follow the price when the market is flying , as every uptrend has pause phases . Each minor correction or pullback is a chance to buy the dip . Watch important support zones , such as Fibonacci 0.5 or 0.618 or unfilled FVG areas . When the price touches these levels and shows a reversal signal , it is usually the highest probability entry point .
Note: even in an uptrend , the market may experience shakes due to profit-taking or short-term adjustments . This is normal and should not cause panic. In fact, the pullback is an opportunity to buy at a better price . Wait for a confirmation signal from candlestick reversals or indicators like RSI not oversold . For example, if gold rises from 1,900 to 1,940 and then pulls back slightly to 1,915 – 1,920, this can be a good entry , instead of chasing at the peak .
Risk Management – Stop Loss and Take Profit:
Even when the market is rising , risk management is crucial. Place Stop Loss below higher lows or the nearest support zone to protect against sharp pullbacks. Take Profit can be set at the next resistance zone , or use trailing stop to lock in profits as the price continues upward. For example, buying gold at 1,915 USD/ounce , you could place SL below 1,905 and TP near the resistance at 1,950 USD.
Monitor Macro News – Don’t Let Big Waves Sweep Away Profits:
A strong trend always has a reason behind it: monetary policies , inflation data , or global capital flows . Staying informed helps you avoid being caught off guard.
I’ve covered this part, you can click here to read more.
Patience and Discipline – Two Weapons to Survive an Uptrend:
One of the biggest challenges for traders is… standing still . When the market keeps rising , FOMO (fear of missing out) can make you jump in immediately, but most hasty trades end up buying right before a pullback . I’ve made this mistake many times – buying when the price is flying , then watching the position turn red in a few hours. Later, I realized that in an uptrend , patience to wait for a pullback is the key to winning. Wait for the price to return to a support zone , wait for a confirmation signal , then enter.
Discipline is not only about entry timing but also risk management . Place Stop Loss below the nearest low , Take Profit at the next resistance zone , and if the price continues upward , move SL favorably – trailing stop protects profits without exiting too early. Emotions are the biggest enemy of a trader ; greed or rushing leads to wrong decisions. Following your plan and discipline avoids unnecessary losses.
An uptrend is a perfect time to increase profits , but it can also make traders complacent . If you can identify the trend , wait for the right entry , and maintain discipline , you will not only ride the wave but also survive it. Is the market rising? The question is not whether to buy or not , but whether you have enough patience to wait for the right moment .

Gold Weekly Review — Historic Volatility & Next Week’s Key LevelThis week, gold experienced a historic level of volatility, a truly remarkable movement that left many traders astonished.
During the session, prices tested the 4200–4180 support zone for the first time. The nearly $200 decline effectively released the heavy selling pressure that had been building up in recent days, while also creating new opportunities for bullish entries.
As expected, once prices entered the support region, they rebounded strongly, closing above 4250 with a recovery of nearly $70 (all of which I had clearly indicated in advance).
From the 30-minute chart, the candlestick structure still suggests further upside potential. However, given the weekend uncertainty, any unexpected bearish news could trigger a pullback when markets reopen on Monday.
If no major negative developments occur, bullish momentum may continue to drive gold higher. Resistance is likely to be concentrated around the 4280–4300 zone — once price enters this region, both short-term buyers and trapped long positions may start adjusting their holdings, which could increase the likelihood of a short-term correction.
On the 4-hour chart, this nearly $500 rally has just completed its first test of the MA30 support. The MA5 (near 4270) currently acts as the key resistance, followed by MA10 (around 4292).
If during consolidation, the price can hold above MA20 (around 4246), it will likely attract renewed buying interest, potentially driving prices back toward 4380 or even higher.
Conversely, if prices remain under pressure and fail to stay above the MA20, attention should shift to the MA30 support. A break below this level could open the way to a test of the MA60(near 4100).
Therefore, for next week’s trading, these levels will be our key focus points.
As I mentioned earlier this week, the medium-term long positions have been closed, and we will wait for new opportunities to emerge. If the market drops toward 4100 or even lower, I will consider re-entering long positions from those lower levels.
A friendly reminder — always align your trading strategy with your own risk tolerance and financial situation. Medium-term setups require patience and strong risk-bearing capacity. If your current condition doesn’t allow for that, please avoid blind following to prevent unnecessary losses.
Lastly, note that gold still has two unfilled gaps around 4019–4024 and 3887–3898. If the trend turns bearish, these gaps may present potential trading opportunities.
That’s all for today.
We’ll discuss specific intraday trading opportunities when the market opens.
If you have any questions or need guidance, feel free to leave me a message.
GOLD/XAUUSD Long Trade Risking 1% to make 2.23%TVC:GOLD / OANDA:XAUUSD Long Trade
Entry: 4259 - 4266
TP: 4354
This is good trade.
Don't overload your risk like Greedy gambler!!!
Be Disciplined Trader, risk what you can afford.
Use proper risk management.
Disclaimer: Trading is risky, only idea, not advice.
