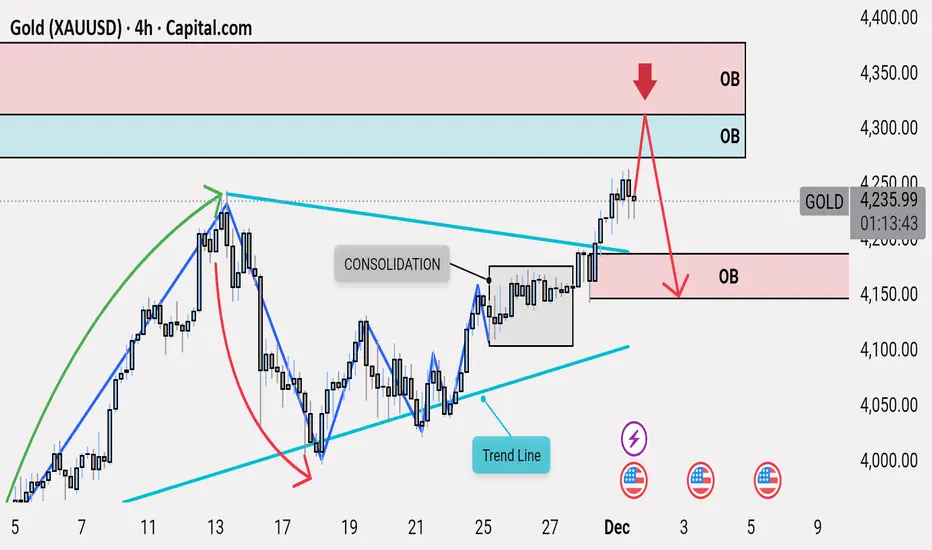
HIGH-PROBABILITY SELL | Upper Order Block RejectionThe market recently broke out of a consolidation zone, which had been holding price in a tight sideways structure. This breakout cleared the liquidity above the range, and price briefly surged past the trend line, showing temporary bullish momentum. However, this move is corrective within the broader bearish framework.
Price has now entered the imbalance region, leaving a clean Fair Value Gap (FVG) above, signaling inefficiency that the market is likely to revisit on the downside. Above this, the price is approaching a strong, unmitigated Upper Order Block — the key supply zone on the chart.
This Upper OB sits above the liquidity cleared during the consolidation breakout, making it the strongest potential rejection point. A reaction from this zone would likely trigger a sell-off back toward the Lower Order Block, filling the remaining FVG on the way down. This aligns with the original bearish structure, with the recent upward move being only a corrective retracement.
If the Upper OB holds, the expected move is a decline, making this a high-probability sell setup. Only a strong breakout above the OB with sustained closings would invalidate this bearish scenario.
Trade ideas
SELL NOW XAUUSD
🔻 SELL SIGNAL – XAUUSD (Gold USD)
📍 Entry: 4,205.35
🛑 Stop-Loss: 4,215.29
🎯 Take-Profit: 4,183.90
Description:
Price rejected resistance and formed a lower high. Bearish momentum continues after a breakdown from the recent uptrend. Expect further downside if the candle closes below the entry level.

Gold (XAUUSD) Range-Bound After ATH Rejection – Gold (XAUUSD) continues to consolidate in a high-timeframe range between ~$4,200 and $4,247 after failing to sustain above the psychological $4,250 zone. The 15-min structure shows repeated defense of the 4,200 higher-low area, while upside momentum fades quickly into the 4,240–4,247 supply cluster. Volume profile highlights thinning participation near the highs, typical of distribution or profit-taking following the strong November rally. Until a decisive breakout or breakdown occurs, range-bound conditions dominate with alternating impulsive spikes and tight coils.#Gold #XAUUSD #PreciousMetals #TechnicalAnalysis #MarketStructure #NotATradingCall

XAUUSD Bullish Reversal Setup from Extreme POI – SSS Liquidity SChart Analysis
1. Market Context
The chart shows XAUUSD after a decline, now tapping into an EXTREME POI (Point of Interest).
Price reached a previous demand zone where strong reactions occurred before.
2. Liquidity Structure
Multiple areas are labeled “SSS” (Sell-Side Liquidity / Sell-Side Sweep).
Price appears to have:
Swept liquidity beneath local lows (SSS).
Tapped the extreme POI.
Shown an immediate rejection wick, indicating buyers stepping in.
This suggests the market may be exhausting sellers and preparing for a bullish leg.
3. Execution Zone
The grey region represents the entry zone (likely a demand imbalance / mitigation area).
The large blue box above marks the risk-to-reward projection for a long position.
4. Targets
You’ve placed two clear targets:
Target 1
A mid-range liquidity level at approximately 4217.279.
Represents a logical first take-profit based on prior structural inefficiencies.
Target 2
The upper area (labeled “TARGET”), aligning with:
Prior swing highs
A supply zone
A premium pricing zone (after retracement)
This would be the full TP for the bullish move.
5. Bias Summary
Bias: Bullish
Reason: Liquidity sweep + POI tap + structure showing potential for upside displacement.
The setup aligns with Smart Money Concepts:
Sweep → Mitigation → Displacement → Targeting Imbalances & Liquidity Pools

GOLD Consolidation bullish run momenmtumGold moved into consolidation after a bullish run. The metal pulled back to $4110/oz on Tuesday as investors booked profits following Monday’s six-week high. The market is now focused on U.S. interest rate expectations, with growing anticipation of a rate cut next week. Traders are also awaiting remarks from Federal Reserve Chair Jerome Powell later today for additional guidance on the Fed’s rate trajectory.
Price retested the 4205 zone and rebounded, indicating a healthy pullback within the uptrend If bulls successfully hold the 4210 support range, upward momentum could strengthen quickly On the upside, the next major resistance levels to watch are 4260 and 4300.
You may find more details in the chart.
Trade wisely best of luck buddies.
Ps; Support with like and comments for better analysis thanks for supporting.
Bulls keep gold prices above 4200⭐️GOLDEN INFORMATION:
Gold (XAU/USD) trades softer in Thursday’s Asian session but stays within its weekly range as bearish momentum remains limited. A mild rebound in the US Dollar from Wednesday’s late-October low, along with upbeat equity sentiment, weighs on the safe-haven metal.
Still, meaningful USD gains appear capped by expectations of another Fed rate cut next week, which helps support non-yielding gold. Ongoing geopolitical risks from the prolonged Russia-Ukraine conflict also limit downside pressure. Traders are likely to remain cautious ahead of Friday’s key US inflation data
⭐️Personal comments NOVA:
Continue to move sideways - gold price accumulated in early December around 4200
⭐️SET UP GOLD PRICE:
🔥SELL GOLD zone: 4230 - 4232 SL 4237
TP1: $4220
TP2: $4210
TP3: $4200
🔥BUY GOLD zone: 4173 - 4171 SL 4166
TP1: $4190
TP2: $4200
TP3: $4215
⭐️Technical analysis:
Based on technical indicators EMA 34, EMA89 and support resistance areas to set up a reasonable BUY order.
⭐️NOTE:
Note: Nova wishes traders to manage their capital well
- take the number of lots that match your capital
- Takeprofit equal to 4-6% of capital account
- Stoplose equal to 2-3% of capital account

GOLD ANALYSIS 12/04/20251. Fundamental Analysis:
a) Economy:
• USD:
The USD is recovering slightly after a strong decline earlier this week, mainly due to profit-taking flows from gold and bonds. However, the overall trend of the USD remains weak because the market believes the Fed will keep interest rates low and maintain the rate-cutting cycle to support economic growth.
• U.S. Stock Market:
U.S. equities are rising modestly thanks to expectations of a rebound in Q4 corporate earnings and capital rotating back into the tech sector. This reduces safe-haven demand, but the bullish momentum is not strong enough to exert significant downward pressure on gold.
• FED:
The Fed continues to signal a dovish stance, prioritizing economic stability over inflation control. The market is pricing in the possibility of two rate cuts in 2026, providing strong support for gold.
• TRUMP:
The Trump administration is pushing aggressive stimulus packages and trade-protection policies. Uncertainty surrounding tax strategies and pressure on China–Mexico is creating a mild risk-off sentiment, supporting gold.
• Gold ETF (SPDR):
SPDR continued to sell 1.71 tons yesterday → a slightly negative signal, indicating institutional outflows from gold as prices approached all-time highs → mildly bearish for gold.
b) Geopolitics:
• Ongoing instability in the Middle East and Venezuela, with small conflicts occurring frequently.
• U.S.–China tensions persist over technology and trade.
These factors maintain a cautious market tone and form a supportive foundation for gold to rebound.
c) Market Sentiment:
The market is in a mildly risk-on state, but not stable. Funds still move into gold as a defensive asset whenever the USD or equities show signs of profit-taking.
→ Gold continues to trade within a range, but with a bullish bias.
Asian markets are entering the year-end physical-gold buying season → supportive for gold.
2. Technical Analysis:
Trend:
• Price is holding above the rising trendline.
• MA20 – MA50 are about to cross upward → signal of short-term recovery.
• RSI is rebounding from the 30 zone → selling pressure has weakened.
Pattern:
• The U.S. session bottom has formed → price is retesting the trendline and building a new bullish structure.
• Scenario: a pullback to the trendline followed by a bounce.
RESISTANCE: 4,229 – 4,241 – 4,264
SUPPORT: 4,206 – 4,194 – 4,186
3. Yesterday’s Market (03/12/25):
• Gold moved sideways gently within a 45-dollar range.
→ The bearish structure was rejected and left a long wick → a signal that buyers have returned.
4. Trading Strategy for Today (4/12/25):
🪙 SELL XAUUSD | 4232 – 4230
SL: 4236
TP1: 4224
TP2: 4218
🪙 BUY XAUUSD | 4171 – 4173
SL: 4167
TP1: 4179
TP2: 4185

Gold Buy only / never SellTechnical analysis: Gold is showcasing underlying Bullish trend and is comfortably Trading above #4,200.80 psychological barrier throughout the session (Xau-Usd Spot prices). The pullback can extend as High as the Resistance (former Support now turned to Resistance) on Hourly 1 chart which is currently Trading at #4,208.80 and #4,218.80 - #4,222.80 Resistance zone respectively, I do expect #4,227.80?test in extension before new Short-term Sellers appear. The real market news should soon enough be digested by market as Gold is bound to give one more Lower High’s before the Bullish Medium-term trend resumes. As DX is on decent recovery and Bond Yields still Trading above the Resistance zone, I was expecting some Selling action / momentum on Gold which is currently over and #4,300.80 benchmark is ahead of us.
My position: I have been Buying Gold aggressively from #4,222.80 Support throughout yesterday’s session many times and closing m orders as near as #4,242.80 Resistance. I Bought Gold this morning #4,185.80 aggressively as well with set of Buying orders. I will continue Buying aggressively above #4,208.80 Resistance is invalidated. #4,300.80 and #5,100.80 Medium-term Targets.

XAUUSD SMC Outlook - Quick UpdateGold formed a Strong High near 4240 and later shifted downward with a clear CHOCH + BOS.
Price is currently moving around 4194, showing a pause after the drop.
What to look for next: A possible pullback toward 4200-4210. If price respects that zone, we may see continuation toward 4185 → 4160.
Market structure is leaning bearish for now - patience is key.
Caution : This is not a financial advice

XAUUSD Short to PV.in a one-hour range, blue line was the most respected level among the candles.
if H1 closes below the open, there is a higher chance of continuation,

Gold Bulls Smash Through the Flag PatternGold has climbed sharply, and after that sudden burst of momentum, the market naturally shifted into a cooling phase, forming a descending flag.
This pullback does not reflect weakness; instead, it represents a controlled pause as the market resets after a strong advance.
Sellers are attempting to push prices lower, yet the decline remains shallow. That limited retracement reveals that buyers are still firmly positioned and ready to defend the trend at every dip.
At this stage, price is breaking out of the flag with clear conviction, signaling that bullish strength is returning to the market. The breakout candle, supported by increasing volume, highlights strong market intent and renewed confidence from buyers.
With momentum building again, the next impulsive move is likely to extend toward the 4,300 target.

XAUUSD: Breakout From ConsolidationAfter an extended period of sideways consolidation, the market finally broke out of the consolidation range with strong momentum and also broke through the descending trend line, confirming a clear bullish shift in structure. This breakout indicates that buyers have regained control after absorbing liquidity from both sides of the range.
Following the breakout, price attempted to push further into the upper Fair Value Gap and toward the Upper Order Block but failed to sustain continuation, leading to a corrective move back into the previously broken structure. This retracement is normal and aligns with typical price behavior when retesting major breakout levels.
Price has now reached the Lower Order Block, which acted as a major reaction zone earlier. The rejection from this OB, combined with the fact that it sits directly below the breakout structure, strengthens the likelihood that this zone will serve as the primary demand area for a potential continuation to the upside. As long as the Lower OB holds, the bullish outlook remains intact.
If price maintains support above this Order Block, the next objectives become the upper FVG and the Upper Order Block, as both contain resting liquidity and unmitigated imbalances that the market may want to target. These zones stand as the next main areas of interest for bullish continuation.
However, a break and close below the Lower OB would invalidate the bullish scenario and open the possibility for a deeper drop, as it would signal a structural failure of the current demand zone. Until that happens, the bias remains bullish with expectations of upward continuation following this retest.

XAUUSD: Will It Continue to Decline?Last week, I had been continuously suggesting going long on gold, and the market aligned with my analysis by breaking through the $4,200 level rapidly. However, not every trader followed my strategy to go long.
There are likely still many traders who chose to go short and thus incurred losses. A downward correction is expected next week, which may be your last chance to exit .
I send out accurate signals every day after the market opens, so don’t miss out.

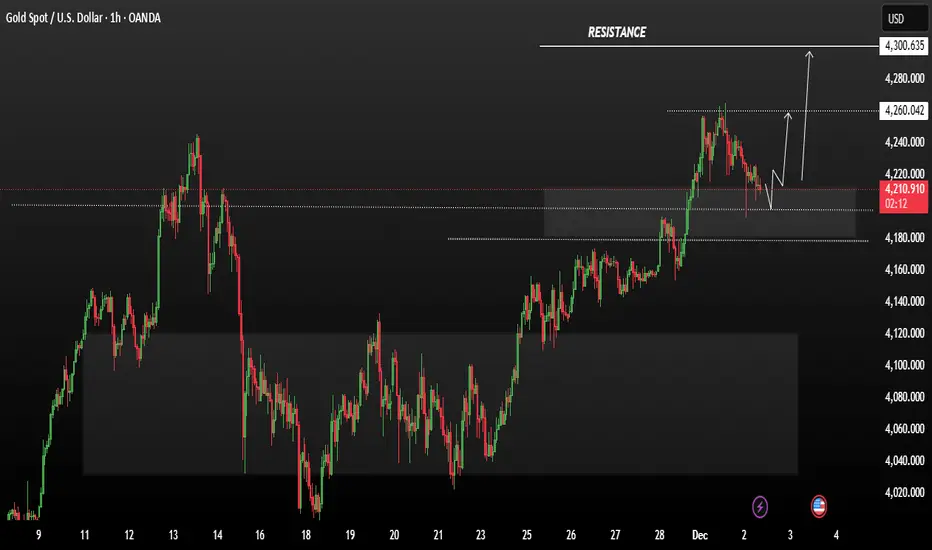
GOLD (XAU/USD): Bullish ContinuationThere is a strong likelihood that Gold will continue to appreciate following a confirmed breakout above a significant intraday/daily resistance cluster.
We anticipate a move upwards to at least 4300.

12.01 Euro early-session plan for goldXAUUSD (Gold vs. USD) 1-hour Trading Plan for Today’s Europe & US Sessions (Long-Only)
1. Primary Strategy: Buy on Pullback (Priority Execution)
- Trigger: Price pulls back to the 4218-4225 zone (near the "Support Zone" + 0.382 Fib support on the chart) + bullish candlestick pattern forms (e.g., bullish engulfing, hammer).
- Entry: Go long immediately.
- Stop Loss: Below 4210.
- Targets: First target at 4255; if broken, second target at 4285 (Target Zone 1 on the chart).
2. Secondary Strategy: Buy on Breakout (Supplementary Execution)
- Trigger: Price holds above 4255 + closes as a solid breakout bullish candle (no long upper wick).
- Entry: Go long with a smaller position (60%-70% of the primary strategy’s position size).
- Stop Loss: Below 4240.
- Targets: First target at 4285; second target at 4302 (Target Zone 2 on the chart).
3. Supplementary Strategy: Add Position on Extreme Pullback (Execute Cautiously)
- Trigger: Price unexpectedly pulls back to 4214 (0.382 Fib support) + shows reversal signals (e.g., doji, volume-spiked bullish candle).
- Entry: Add to the position with a small size (total position ≤ 1.5x the primary strategy’s size).
- Stop Loss: Below 4200.
- Targets: First target at 4246 (current price level); second target at 4255.
GOOD LUCK!
LESS IS MORE!

Gold continues to be bought in the $4200-$4205 range.Gold continues to be bought in the $4200-$4205 range.
My chart analysis shows that the uptrend in gold prices is not yet fully over, currently stabilizing above $4200.
The $4185-$4200 range is currently the strongest support level for gold.
The $4150-$4160 range is currently the most effective resistance level for gold.
Our strategy remains unchanged: as long as the gold price remains above $4195, we will continue to buy low and sell high, profiting from price fluctuations.
In fact, we have already completed two successful trades tonight.
The current strategy remains clear:
Buy: $4200-$4205
Stop Loss: $4185
Take Profit: $4230-$4250
It should be noted that if the gold price falls below $4195, it may be oversold and fall back to around $4150, which is the most likely pullback level. Therefore, strictly adhering to the trading plan is crucial.
Yes, I have a complete table on my public channel recording all my trading signals over the past three months.
Here is my trading model:
1. I set a fixed stop-loss range of 20 pips, based on current market volatility.
2. Profit targets: Profit targets are not fixed. I adjust the profit range independently based on market trends, but I ensure each trading signal yields at least 5 pips of profit.
3. Holding time: I will never close a position prematurely unless the stop-loss is triggered.
4. Order allocation: 1 lot corresponds to $8,000 to $10,000 in capital.
5. I have my own trading system, and I wait for orders to be executed at the appropriate price.
6. I use 1-3 swing trading strategies daily. When using high-frequency trading (HF), I stop all other trading activities, focus solely on HF, and choose an effective trading timeframe. I typically conduct HF trading three hours after and three hours before the US stock market closes. This significantly improves my win rate.
Therefore, this chart summarizes all the trading signals I release on my public channel. Due to very limited time, I only release 1 to 2 trading signals per day on my public channel.
Of course, if you want to achieve the same returns as me, you need to closely monitor all my trading signals and align your trading hours with mine, but this may not be easy. Therefore, I strongly recommend:
You can contact me to establish a long-term, stable partnership.
I will help you plan your funds and build a safe and reliable trading system based on your schedule, order size, and trading habits. This is a win-win collaboration.
