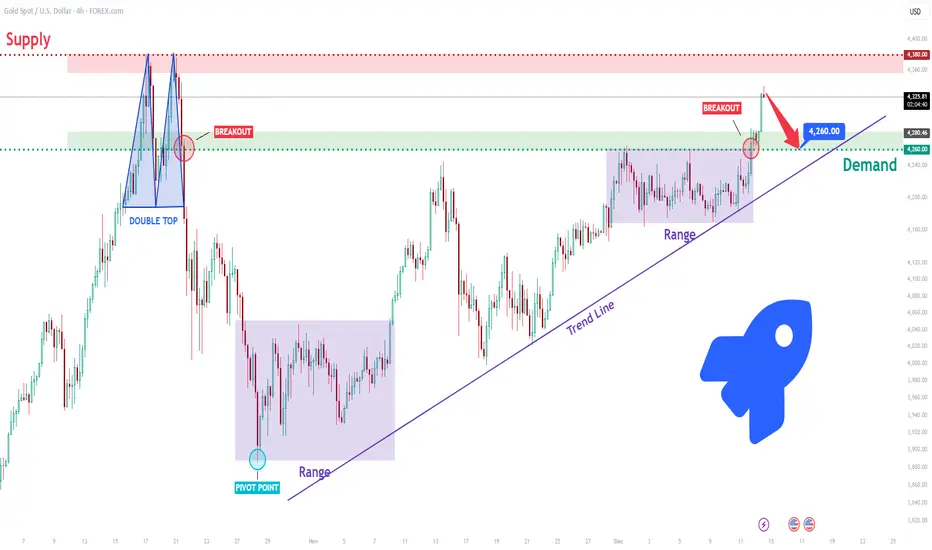
XAUUSD Short: Bears Aim for Pullback Into $4,260 Demand ZoneHello, traders! The current XAUUSD price action is showing early signs of bearish pressure after failing to sustain momentum above the upper resistance zones. Earlier, the market formed a strong Double Top inside the major Supply Zone, which triggered a sharp downside reversal and highlighted the presence of active sellers at the top of the structure. This rejection pushed gold back toward the mid-range levels, signaling a shift in market sentiment. After that decline, XAUUSD entered a prolonged Range phase, where price consolidated and accumulated liquidity for the next move. Although buyers attempted to regain control, the Trend Line breakout attempts showed weakening bullish strength, as each move higher was met with increased selling interest. The second consolidation Range formed near the upper supply boundary, confirming that the market was losing upward momentum.
Currently, gold broke out above the Range high but quickly faced resistance near $4,330, where sellers stepped in aggressively. Price is now pulling back and showing signs of returning toward the $4,260 level — a key decision zone that aligns with previous structure and where demand has recently weakened. As long as XAUUSD remains below the $4,330 resistance and fails to reclaim the local high, the bearish scenario becomes the primary outlook. A sustained move back into the Range and a breakdown below $4,260 would confirm stronger seller dominance and open the path toward deeper corrective movement.
My scenario is a continuation to the downside toward the $4,260 Demand Zone, especially if price breaks below $4,260 and loses the ascending structure. A clean breakdown of this level may trigger a broader bearish continuation. Manage your risk!
Trade ideas
Elite | XAUUSD 30m Accumulation Under Premium ZoneOANDA:XAUUSD
Gold continues to move inside a tightening accumulation structure below the buy-side liquidity pool at 4250–4260. Multiple sweeps into the 4180 demand block have resulted in higher lows and trendline support continuation. As long as demand holds, price continues to build long-side liquidity for a break upward.
Bullish Continuation Scenario (Primary Bias)
Price must hold above 4185 and break the short-term breaker at 4218–4222.
Once reclaimed:
🎯 Target 1 → 4232
🎯 Target 2 → 4250–4260 (main liquidity objective)
🎯 Extended → 4274 rejection ceiling
Bearish Breakdown Scenario
If price closes below 4,200.316, the bullish structure collapses.
📉 Objective 1 → 4170
📉 Objective 2 → 4155 (invalid zone hit)
📉 Objective 3 → 4120 HTF rebuy zone
Note:
Until price breaks 4222, gold is still in consolidation.
No breakout = no trend continuation.
⚠️ For educational purposes only.

XAU/USD | A free fall or an bullish attempt? (READ THE CAPTION!)As you can see, Gold has been moving on a range recently, with no clear intention as to where it is headed. A possible scenario could be dropping down to the 4164 NDOG and then an uptrend move above the pool of liquidity above 4265 and the 4272 FVG.
However if it fails to make a move at that level, it'll drop further to 4111-4159 IFVG, which then I expect it to bounce back and go up again. However, if it fails to make a move then, we will witness a free fall of Gold.
Let's see what happens.

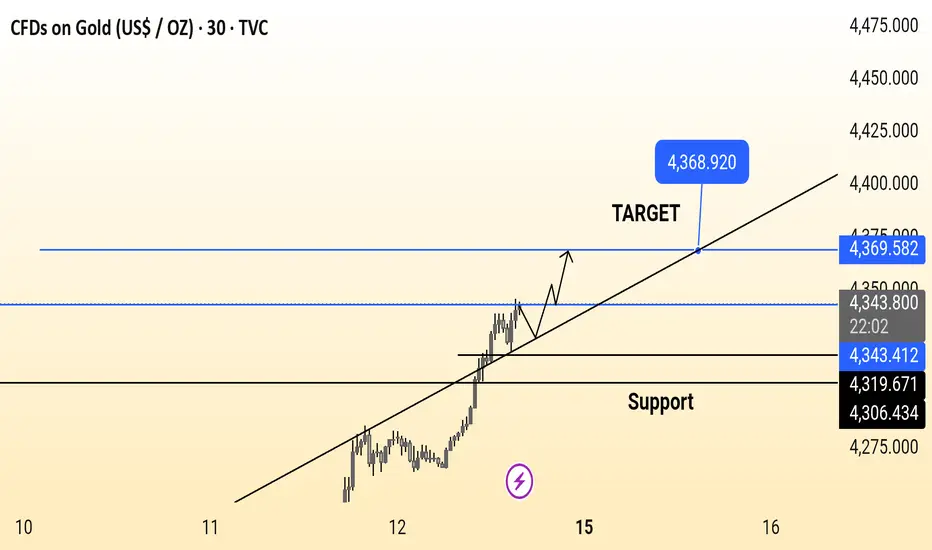
GoldGold is trending upward on the 30-minute chart, holding above support and following an ascending trendline. Price is expected to continue its bullish move toward the target zone around 4,368–4,370, as long as it stays above the key support levels.
Gold completes its corrective phase and heads toward $4,250OANDA:XAUUSD is moving within a remarkably well-structured ascending channel, and the overall market structure clearly highlights the strength of the buying momentum. Each swing produces higher highs and higher lows, confirming that the bullish dynamic remains intact despite a few natural pauses along the way. The recent pullback looks more like a healthy technical breather than a sign of weakness, often the kind of pause that sets the stage for a new upward acceleration.
The price is now approaching a key support zone, where the lower boundary of the channel aligns with a previously proven demand area. If the market reacts here, buyers could find a highly favorable re-entry opportunity that aligns perfectly with both the channel structure and the logic of the current trend. In that scenario, the natural upside target is around 4,250 dollars, a level that combines the channel’s midline with a historical resistance, giving even more weight to this objective.
The bullish outlook remains valid as long as the price holds above the support zone and the ascending trendline. A decisive break below these levels would redefine the market context and open the door to a deeper correction, but for now, market conditions continue to favor long positions.
Stay disciplined in your market reading, validate your setups carefully, and protect your capital with strict risk management. Good luck.

XAUUSD 4H Analysis“Quick market update: Gold is showing signs of a potential bearish pattern. I’m noticing lower highs, weakening momentum, and price failing to break above the recent resistance zone. If price breaks below the support level, it could confirm further downside. Not financial advice — just sharing my chart observation.”

Gold Eyes 4,207 Rebound as USD Softens & Venezuela Tensions RiseHey Traders, in today’s trading session we are monitoring XAUUSD for a potential buying opportunity around the 4,207 zone. Gold continues to trade within a broader uptrend, and the current pullback is bringing price into a key support–resistance confluence aligned with the ascending trend structure.
Fundamentals:
The US Dollar remains under pressure, with markets increasingly leaning toward a dovish shift from the Federal Reserve, reinforcing gold’s classic negative correlation with the USD. A softer Dollar environment typically boosts demand for metals, and this week’s macro flow continues to point in that direction.
At the same time, geopolitical tensions between the U.S. and Venezuela are escalating, increasing global uncertainty and driving markets toward safe-haven assets. Gold is already reflecting this risk premium, and any further escalation could accelerate flows into XAU.
Next Step:
We’re watching price reaction closely around 4,207 for a potential continuation of the broader bullish structure.
Trade safe,
Joe.

Textbook Breakout: Why 4270 Is Now a Buy ZoneYesterday, Gold finally resolved the range with a breakout to the upside — following the technical path , not my gut feeling from the day. And when the market chooses the textbook option, we respect it.
Right now, price is consolidating in a tight range, and the normal continuation path points toward a push above 4300 (4320 being my preferred zone).
In the short term, any dips toward 4270 — even slightly below — should be viewed as buying opportunities, in line with the new bullish structure.
A deeper pullback toward 4245 (the broken resistance) would be too aggressive after such an important breakout. If the market goes that low, it’s no longer a healthy bullish continuation — it’s a warning that momentum is fading.
In short: Gold is bullish now.
But if it retests 4245, it’s not bullish anymore.

Market Accumulating Liquidity, Two Clear Scenarios for TodayGold continues to move within a bullish structure, but short-term order flow shows distribution inside the OBS Sell Zone 4,236. Price is currently trapped in the middle of the range, suggesting the market may need a liquidity sweep before choosing its next direction.
Fundamentally, expectations of a dovish Fed still support gold on deeper pullbacks — but intraday, the two MMF flow setups are extremely clear.
📊 Technical Outlook (MMF Flow – H1)
🔸 OBS SELL ZONE: 4,236
• Strong reaction on first touch → supply confirmed
• Downtrend line converges here → high probability of liquidity traps
🔸 OBS BUY ZONE: 4,197
• First key demand zone below
• Aligned with channel support → likely bullish reaction
🔸 Sell-side Liquidity: 4,181
• If price sweeps this area → ideal reversal point
🔸 Premium SELL Reaction Zone: 4,284
• If gold expands upward → priority area for distribution / short-term correction
🎯 Two Main MMF Scenarios
Scenario 1 – SELL reaction → BUY trend continuation
• Price retests 4,236
• Bearish reaction → pushes price toward 4,197 – 4,181
• Reversal signal appears
• Targets: 4,236 → 4,284
➡️ This is the cleanest play following today’s liquidity flow.
Scenario 2 – Direct bullish expansion
• Price breaks and closes above 4,236
• Retests this zone
• Expands toward 4,284
➡️ Requires strong bullish momentum — no confirmation, no trade.
🧭 MMF Intraday Bias
• Bullish as long as price holds above 4,197
• Neutral → Bearish only if price closes below 4,181 (failed liquidity sweep)
The market is preparing for a breakout — let liquidity do its job before choosing direction.

4250–4180: The Box Controlling GoldDespite a week filled with major fundamental releases, gold spent the entire period trapped inside a 4250–4180 range.
Even Friday’s strong early rally into 4250 failed to hold, with the daily close producing a sharp sell-off that left traders without a clear directional bias.
Today’s Asian session opened with renewed buying interest, lifting price back toward 4220, the midpoint of the range. But without a decisive breakout, the medium-term direction remains unclear.
Technically, both the medium-term and long-term trends are still bullish. However, as long as price remains locked inside this range, taking trades carries elevated risk.
What I want to see next:
Bullish scenario:
A fresh attempt to break above resistance, followed by either a clean breakout or a tight consolidation right below it — a classic pressure-building structure.
Bearish scenario:
A breakdown below 4175–4180, which could open the door for a move back toward 4100 or even lower.
Until we get clarity, I remain on the sidelines.
#XAUUSD: First Sell And Then Buy At The Correction +2000 Pips! Dear Traders,
Gold presents two opportunities: first, sell at the premium selling zone and then buy at the correction or discounted buying zone. This strategy aims to gain approximately +2000 pips or more. Our chart analysis supports this approach. Currently, the price exhibits extreme bullish momentum nearing exhaustion. Once buyers are depleted, sellers’ volume will surge rapidly at $4385. However, this selling momentum won’t last as a swing move, revealing our buying point or discounted buying point. This will ultimately drive the price to $4500.
Premium Selling Zone:
- Gold’s current extreme bullish momentum is approaching exhaustion.
- Our analysis suggests a high-probability selling opportunity at $4385, where buyer exhaustion is expected to trigger a rapid influx of sellers.
- This initial move could yield immediate profits as the market corrects.
Discounted Buying Zone:
- The anticipated selling movement won’t persist as a swing trend.
- Following the corrective dip, our discounted buying zone offers an ideal entry point for long positions.
- This secondary move is projected to propel gold prices to $4500, potentially generating +2000 pips or more.
Detailed Gold Chart Analysis (12/12/2025):
- Trend: A strong bullish trend with momentum indicators signalling overbought conditions.
- Support & Resistance:
- Key Resistance: $4385 (Premium Selling Zone)
- Key Support: Discounted Buying Zone after the corrective dip.
- Market Structure: The current movement concludes the final leg of an impulse wave, nearing exhaustion.
- Indicators:
- RSI: Approaching 78 (overbought)
- MACD: Showing divergence, hinting at a potential bearish correction
Please exercise accurate risk management while trading gold.
Team Setupsfx_

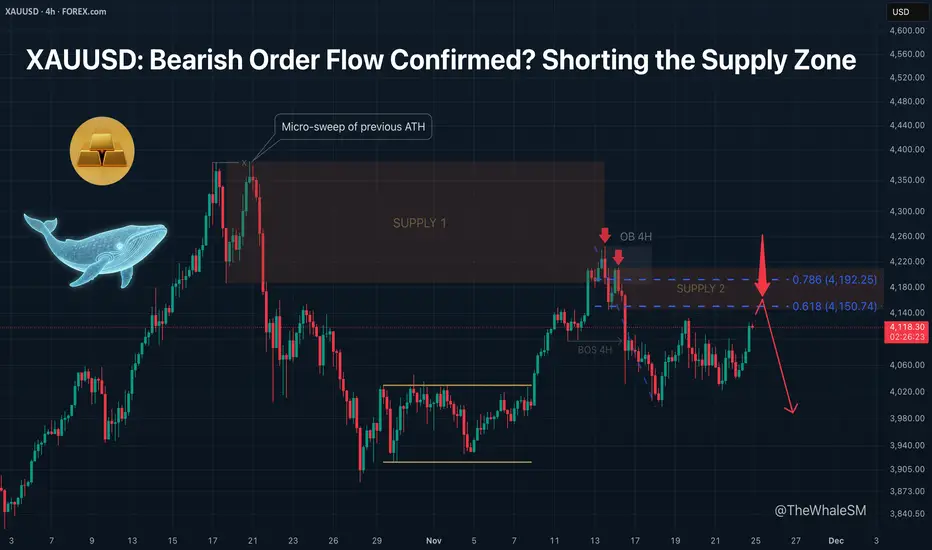
XAUUSD: Bearish Order Flow Confirmed? Shorting the Supply Zone.After updating the All-Time High (ATH), Gold performed a micro-sweep of liquidity from the previous ATH. This move was engineered via a Supply Zone . Following the sweep, this zone was mitigated, initiating a bearish order flow that broke the 4H structure to the downside (BOS 4H).
After the structural break, the price began approaching a second Supply Zone . A reversal is possible from this area to continue the bearish order flow, targeting an update of the structural low at $4000 . A full break of this low would indicate a high probability of a deeper correction on the higher timeframe.
✅ Short Setup Conditions:
Aside from the mitigation of the Supply Zone, I am looking for a reversal reaction from the 61.8% Fibonacci retracement level . The price must find acceptance below this level upon reaching it.
❌ Invalidation:
The short scenario is invalidated if the 61.8% level is broken. In that case, Gold will face further resistance at the 78.6% Fib level , but forming a short setup there is less probable than from the 61.8%.
~~~~~~~~~~~~~~~~~~~~~~~~~~~~~~~~~~~~~~~~~~~~~~~~~~~~~~~~~~~~~~~~~
The principles and conditions for forming the manipulation zones I show in this trade idea are detailed in my educational publication, which was chosen by TradingView for the "Editor's Picks" category and received a huge amount of positive feedback from this insightful trading community. To better understand the logic I've used here and the general principles of price movement in most markets from the perspective of institutional capital, I highly recommend checking out this guide if you haven't already. 👇
P.S. This is not a prediction of the exact price direction. It is a description of high-probability setups that become valid only if specific conditions are met when the price reaches the marked POI. If the conditions are not met, the setups are invalid. No setup has a 100% success rate, so if you decide to use this trade idea, always apply a stop-loss and proper risk management. Trade smart.
~~~~~~~~~~~~~~~~~~~~~~~~~~~~~~~~~~~~~~~~~~~~~~~~~~~~~~~~~~~~~~~~~
If you found this analysis helpful, support it with a Boost! 🚀
Have a question or your own view on this idea? Share it in the comments. 💬
► Follow me on TradingView for timely updates on THIS idea (entry, targets & live trade management) and not to miss my next detailed breakdown.
~~~~~~~~~~~~~~~~~~~~~~~~~~~~~~~~~~~~~~~~~~~~~~~~~~~~~~~~~~~~~~~~~
Gold Consolidation Outlook – Bullish Bias Above Local SupportGold is consolidating within its current range and is showing signs of a potential bullish continuation, supported by its reaction to local support levels.
Technically, gold strengthened following the latest U.S. economic data, while investors await comments from Fed Chair Jerome Powell Recently, price tested the 4200 zone and quickly broke above it, signalling strong upward momentum. As long as the 4200 support level holds, gold is likely to remain bullish. However, this week’s fresh labour data has added some uncertainty to the medium-term policy outlook.
If bulls manage to sustain a bounce above the 4200 support, maintaining strong momentum, the next upside targets and resistance zones are seen at 4240–4265.
You may find more details in the chart,
Trade wisely best of luck buddies.
Ps; Support with like and comments for better analysis thanks for supporting.

Selena | XAUUSD 30M – Demand Reaction Setup | Sweep → Retest PEPPERSTONE:XAUUSD
Price has returned into a previous demand zone where market absorbed sell-side liquidity. As long as price holds above the invalidation line, gold has strong probability to push back upward toward premium pricing. Break below demand → structure flips bearish & deeper discount test opens.
Key Scenarios
🟢 Bullish Case – Reversal From Demand 🚀
Hold above 4165–4180 zone →
🎯 Target 1: 4212
🎯 Target 2: 4246
🎯 Target 3: 4270–4285 liquidity fill
❌ Bearish Invalidator
Clean break + candle close below 4165 →
🎯 Downside sweep into 4146 → 4110–4120 (major support)
Current Levels to Watch
Resistance 🔴: 4246 / 4270–4285
Support 🟢: 4165–4180 demand block
⚠️ Disclaimer: For educational purposes only. Not financial advice.

Gold 1H – Will 4242 Displace or 4170 Unlock the Next Leg?🟡 XAUUSD – Intraday Smart Money Plan | by Ryan_TitanTrader (04/12)
📈 Market Context
Gold squeezes into engineered liquidity as Donald Trump signals policy authorization for ultra-compact car production in the U.S., adding risk-on volatility to USD narratives. Markets may front-run sentiment shifts into commodities like gold. Expect fast bilateral sweeps before institutions reveal intent.
On H1, structure toggles between premium supply at 4242–4244 and discount demand at 4170–4168. The next directional leg requires MSS + BOS + displacement confluence.
🔎 Technical Framework – Smart Money Structure (1H)
Current Phase = liquidity-rich compression at H1 extremes
Liquidity Zones & Key Triggers
• 🔴 SELL GOLD 4242 – 4244 | SL 4252
• 🟢 BUY GOLD 4170 – 4168 | SL 4160
Bias invalidation only via structure break + displacement validation.
Expected Sequence = Sweep → MSS/CHoCH → BOS → Displacement → Retest → Expansion
🎯 Execution Rules (unchanged methodology, matching your zones)
🔴 SELL GOLD 4242 – 4244 | SL 4252
Rules:
✔ Zone tap 4243 → bearish MSS/CHoCH (M5–M15)
✔ Clean bearish BOS down + candle displacement
✔ Entry on FVG fill or OB retest after displacement
Targets:
1. 4200 – 4190
2. 4182 – 4176
3. 4170 – 4168
🟢 BUY GOLD 4170 – 4168 | SL 4160
Rules:
✔ Sweep under 4169 → bullish MSS/CHoCH + BOS up
✔ Displacement candle away from discount
✔ Wick rejection into FVG fill / OB retest confirm
Targets:
1. 4186
2. 4210
3. 4242+
⚠️ Risk Notes
• Both sweeps = traps until BOS + Displacement confirms intent
• No averaging inside compression
• SL = structural invalidation only
• Reduce size during headline-driven spikes
📍 Summary
Two institutional paths today:
• 4243 sweep → bearish MSS/BOS → retest → delivery into 4170
or
• 4169 sweep → bullish MSS/BOS → retest → expansion into 4242+
Trade the structure. Let price narrate the intent. Patience = edge. 🚀
📌 Follow @Ryan_TitanTrader for daily Smart Money breakdowns.

Elise | GOLD (XAUUSD) – 30M | Demand Retest → Reversal SetupOANDA:XAUUSD
Price is resting on demand after sweeping downside liquidity — a typical accumulation behavior before premium re-pricing. As long as market holds above the liquidity sweep zone, bullish continuation is favored toward prior inefficiencies and supply reaction levels. A breakdown below demand = structural momentum flip.
Key Scenarios
🟢 Bullish Case (Primary Bias) 🚀
Hold above 4170–4180 →
🎯 Target 1: 4199.63
🎯 Target 2: 4215
🎯 Target 3: 4248–4260 retest zone
❌ Bearish Failure Point
Break & close below demand zone →
🎯 Downside expansion into 4145
🎯 Deep sweep into 4115 liquidity cluster
Current Levels to Watch
Resistance 🔴: 4215 / 4248–4260
Support 🟢: 4170–4180 sweep block
⚠️ Disclaimer: For educational purposes only. Not financial advice.

XAUUSD Intraday Plan | Powell Spike Fades, 4219 Back in FocusWe saw a solid push into the 4,251 resistance yesterday following Powell’s speech, but the move was short-lived. Price retraced all gains during the Asian session and is now trading around 4,215 — once again sitting below the 4,219 resistance.
The overall outlook remains unchanged:
Buyers must reclaim the 4,219 resistance to target 4,251, with 4,285 becoming achievable if momentum strengthens.
If selling pressure builds, we could see the 4,185 Reaction Zone tested again. A break below 4,185 would expose the Support Zone, where buyers may look to react.
📌Key levels to watch:
Resistance:
4219
4251
4285
Support:
4185
4144
4102

classic liquidity-taking + mitigation + reversal concept 1. Premium Array (Upper Zone)
Located near the top of the recent price range.
Labeled as “Here is the zone for Bearish.”
A Buy-Side Liquidity (BSL) label is marked above recent highs, suggesting this zone is expected to attract liquidity for potential bearish setups.
2. Discount Array (Lower Zone)
Positioned near the bottom of the current range.
Labeled as “Here is the zone for bullish.”
A Sell-Side Liquidity (SSL) mark shows where liquidity could be taken before a bullish reversal.
3. Expected Market Structure Paths
Two projected arrows are drawn:
One arrow shows price possibly dipping into the lower bullish zone before moving upward.
Another arrow suggests a potential move toward the upper bearish zone.
Overall Structure
Price is currently around 4215.
The chart is showing a classic liquidity-taking + mitigation + reversal concept used in ICT/Smart Money trading.
The zones mark premium (sell area) and discount (buy area) regions relative to current price levels.

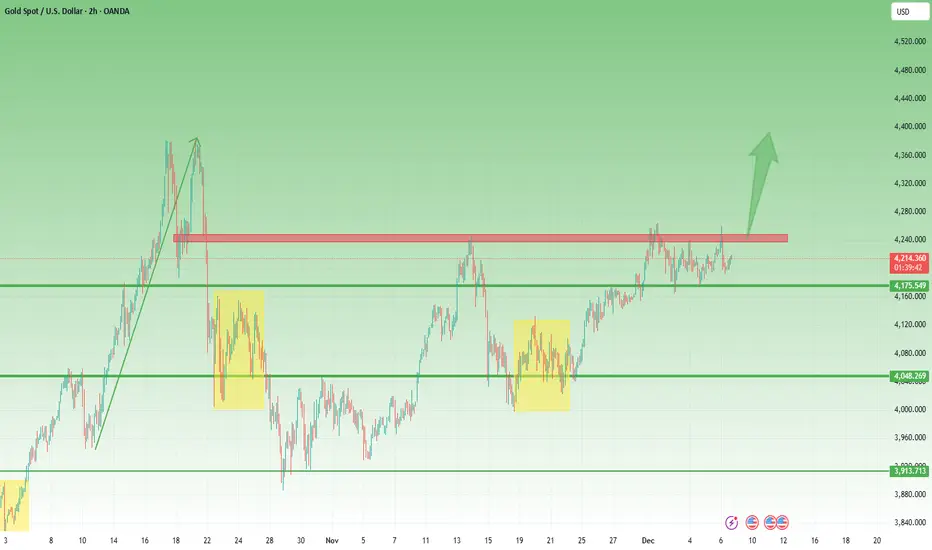
GOLD (XAU/USD): Strong Bullish Signal📈Gold has been in a significant consolidation phase since October, with the market remaining within a broad horizontal range on a daily chart.
Given the recent bullish movement, Gold now appears to be strongly bullish.
A breakout above the resistance level of this range suggests the completion of a bullish accumulation period.
This development opens up the potential for further growth.
The next resistance level to observe is 4,300.

XAUUSD Buy Setup – Breakout Zone & Targets |12AM OutlookGold (XAUUSD) is holding above the invalidation zone and showing signs of recovery after a sharp dip. Price is currently near 4,198, with an entry zone around 4,210. If bullish momentum continues, the upside targets are:
Target 1: 4,220
Target 2: 4,230
This analysis is based on breakout structure and trend alignment. Risk is defined with invalidation below 4,194. Always confirm with your own analysis before executing trades.
DISCLAIMER : THIS IS JUST FOR EDUCATIONAL PURPOSE I AM NOT A FINANCIAL ADVISOR

XAUUSD – 11/12: After major news, only trade at liquidity zones XAUUSD – 11/12: After major news, only trade at liquidity zones
Yesterday brought significant market news, so today’s price action lacks a clear trend.
In this environment, I avoid guessing direction and focus solely on two potential liquidity areas:
Sell timing zone near 4.219
Buy OB zone at 4.197–4.194
Asian session pressure favoured sellers, but the higher-timeframe trend remains intact.
Thus, the plan is simple: short-term sells, buy at good support, no one-sided positions.
🎯 Scenario 1 – Timing SELL at 4.219 (experienced traders only)
Sell zone: around 4.219
Note: This is a timing execution, NOT a pre-set limit order.
Acceptable deviation: ~2 points.
If ideal timing is 4.219 but you only see price after it reaches 4.221 → skip it.
TP guide: at least 15 points, e.g. 4.204–4.203.
Idea:
4.219 is an upper liquidity pocket where many FOMO buys accumulate.
If price sweeps this area and weakens, I take a short sell in line with the Asian session bias — purely intraday.
⭐️ Scenario 2 – BUY at OB 4.197–4.194
Buy zone: 4.197 – 4.194
Setup invalid below: 4.191
TP: +15 points or more, e.g. 4.209–4.212.
Reasoning:
This OB zone previously generated strong upside movement, indicating institutional interest.
If price revisits and shows bullish reaction, it becomes a high-R:R buy opportunity.
1️⃣ Fundamentals & market psychology
After an extended rally, gold bulls are becoming cautious due to uncertainty over how quickly the Fed will ease in 2025.
Cuts are expected — the question is how fast and how often.
This puts gold into a choppy, range-bound phase instead of a clean breakout environment.
So today, instead of trend-trading, I prefer reading liquidity levels and reacting to price behaviour.
2️⃣ Plan & discipline
No trades in the messy 4.20x zone.
Execute only at:
Timing Sell 4.219 (±2 points)
Buy OB 4.197–4.194 (void below 4.191)
Risk per trade: 1–2% max, no holding when invalid.
If price breaks both zones and trends strongly, I step aside and wait for new structure.
👉 Above 4.219 → only SELL timing
👉 Into 4.197–4.194 → only BUY
👉 Below 4.191 → buy setup invalid

XAUUSD in Uptrend, Awaiting Technical PullbackHi everyone, Domic here. Let’s take a closer look at gold today!
Overall, both news and technicals favor buyers. Gold has surged to around $4,270/oz, up $32 from yesterday, reaching its highest level in over a month. The Fed’s 0.25% rate cut, lowering the benchmark to 3.5–3.75%, has clearly weakened the USD — a positive catalyst for gold. Meanwhile, silver also hit a new high around $64.22/oz. According to Edward Meir, silver’s strong momentum is lifting gold and other precious metals, signaling a return of capital to safe-haven assets.
Looking ahead, the market eyes the Nonfarm Payrolls report on December 16 for clues on the next rate moves. Discussions over the next Fed chair, with front-runner Kevin Hassett supporting rate cuts, further strengthen expectations of a prolonged low-rate environment, keeping gold in a favorable position among safe-haven assets.
On the H4 chart, XAUUSD’s uptrend is clear. Price sits above both EMAs, with the short EMA (red) near 4,221 and the long EMA (blue) near 4,188, confirming the medium–long-term uptrend. The recent breakout pushed gold to 4,270–4,280 with rising volume, indicating active buying rather than a random spike. However, the gap between price and the short EMA is wide, making a technical pullback likely.
Preferred scenario:
Gold may retrace to a nearby support zone before resuming its uptrend. The first support is around 4,240–4,250, where price previously consolidated before the breakout — a potential shallow pullback before bouncing higher.
If selling intensifies, the 4,220–4,225 zone near the red EMA offers a good retest point, aligning with the broken resistance. In a stronger pullback, the long EMA (blue) near 4,188 acts as the next safety net, preserving the medium-term uptrend.
→ As long as price stays above this zone on H4, any dips are just pullbacks within the uptrend.
Wishing you successful trades!

Ready for Big Move | Liquidity Sweep Setup Explained📌 Market Structure Update:
Gold is currently trading inside a tightening triangle pattern, showing clear liquidity grabs on both sides. After yesterday’s strong drop, price tapped a key demand zone and reacted aggressively. Now the market is moving between well-defined supply & demand zones, giving both bullish and bearish setups.
🔶 Key Observations
🟫 Major Supply Zone (Top Zone)
Price previously rejected strongly from this area, showing sellers are active here. If price retests this zone again, expect another possible sell reaction.
🟨 Intraday Supply Zone
A smaller supply just below the major zone. Price may spike into this area before giving downside continuation or bull trap.
🔷 Triangle Structure
Price is squeezing between diagonal support & resistance. A breakout is coming soon.
📉 Bearish Scenario
Failure to break the triangle top or rejection from the yellow zone may push price back into demand, and a break of the blue support could target the 4,180 liquidity zone.
