Gold Spot – Bearish Setup After Rising Wedge Breakdownold (XAU/USD) on the 1H chart shows a clear rising wedge pattern that recently broke to the downside. Price rejected the upper resistance near 4,237 and is now trading around 4,209, below the wedge support. This breakdown suggests potential bearish momentum toward the next support zone at 4,180.
This is my personal analysis based on price action and structure. Markets can change quickly, so manage risk accordingly.
Targets:
Entry Zone: 4,209
Target: 4,180
Invalidation: Above 4,237
DISCLAIMER : THIS IS JUST FOR EDUCATIONAL PURPOSE I AM NOT A FINANCIAL ADVISOR
Trade ideas

Elite | XAU/USD – Institutional Buy Zone Retest + Liquidity Run OANDA:XAUUSD
Gold continues to respect the rising trend support, generating repeated support bounces along the diagonal structure. Price recently swept sell-side liquidity inside the institutional buy zone (4182–4196) and reacted bullishly, showing willingness to target upside imbalance.
Bullish Scenario – Preferred Outlook
If price holds above the entry zone at 4208–4215:
🎯 Target 1 → 4244 – 4248
🎯 Target 2 → 4256 – 4260 liquidity zone
A break above Buy-Side Liquidity opens the way for continuation into the imbalance above.
Bearish Invalidations
Break below 4182 removes bullish strength and may shift price back toward discounted levels.
⚠️ This analysis is for educational purposes only — not financial advice.

XAUUSD – Brian | Volume Profile before FedXAUUSD – Brian | Volume Profile before Fed: watch for a rebound to sell down
Market snapshot
Ahead of the Fed's interest rate announcement, gold is moving sideways within a fairly wide range, not yet choosing a clear direction.
In the H1 timeframe, the price fluctuates around the value area, making it very suitable for short-term trading according to the Volume Profile instead of trying to predict the meeting outcome.
Volume Profile – Key price areas
Nearest VAL: around 4.197 – the bottom of the current value area, where there was previous buying support.
Above, the FVG area + VAH/POC cluster is around 4.210 – this is an "air pocket" area where selling pressure can easily appear when the price fills the liquidity gap.
Below, the target for a downward wave if the Fed is not too dovish is around 4.13x (area 4.130–4.135) – coinciding with the old buy zone on the chart.
Trading scenario according to Volume Profile
Watch for a light Buy reaction at VAL 4.197
If the price slides to 4.197 and a nice rejection candle appears on H1/M15, a short scalp buy can be considered:
Idea: capture the rebound from VAL back to the middle/top of the value area, do not hold the position long.
Sell when the price fills FVG around 4.210 (priority scenario)
After the rebound from VAL, the FVG area 4.210 will be where Brian prioritizes watching for a Sell:
Reference sell entry: around 4.208–4.212
TP1: 4.185–4.180
TP2: 4.165–4.160
TP3: area 4.13x (4.130–4.135) if a strong sell-off occurs after the Fed
SL should be placed neatly above the FVG/VAH area (e.g., 4.218–4.220), avoid setting it too far.
Fed context – Why trade cautiously?
The focus this week is the FOMC meeting:
The market is waiting to see if Chairman Powell can create enough consensus to continue cutting interest rates with very few members opposing, similar to the previous 25 bps cut.
If the Fed maintains a dovish tone → USD weakens, yields cool down, gold is likely to bounce back after the sweep.
If Powell signals a "hawkish rate cut" (concern about inflation, cut less – talk tough) → yields rise, gold may complete a deep decline to the 4.13x area before stabilizing again.

XAU/USD: Gold Tests Liquidity Floor, Eyes Reversal BUYGold remains under pressure during the Asian session as a stronger USD and cautious sentiment ahead of key US data keep the market defensive. However, the short-term structure shows weakening downside momentum, suggesting a potential liquidity sweep before a bullish reversal.
📊 MMF Technical Outlook (M30 – H1)
1️⃣ Price is approaching the liquidity zone: 4,176 – 4,170
This area aligns with:
Previous session liquidity sweep
Lower trendline support
Strong BUY reactions in past sessions
👉 High probability for a short-term bottom.
2️⃣ Resistance holds at 4,194 – 4,210
Confluence of supply + descending trendline
Multiple rejections here
👉 Only a strong close above 4,210 confirms bullish continuation.
3️⃣ Current structure favors a “Liquidity Grab → Reversal” pattern
Signals include:
Repeated lower-wick rejections
Weakening downside pressure
Potential W-pattern forming above the trendline
👉 BUY setups become favorable once the liquidity sweep completes.
🎯 MMF Trading Plan – BUY Reversal Priority
▶️ Scenario 1 — BUY at Liquidity Zone
Wait for price to tap and react:
🔹 BUY Zone: 4,176 – 4,170
🔹 SL: below 4,164
🔹 TP1: 4,194
🔹 TP2: 4,210
🔹 TP3: 4,228 (extended target if breakout occurs)
▶️ Scenario 2 — Break & Retest Setup
If price breaks above 4,194:
🔹 Retest BUY: 4,194 – 4,196
🔹 Targets: 4,210 → 4,228
🧭 MMF Daily Bias
Primary Bias: BUY as long as 4,170 holds
Strategy: Accumulate on liquidity dips – avoid chasing mid-range
Invalidation: H1 close below 4,164

Gold Pushing Higher? Key Levels in SightThis chart shows gold steadily climbing along an upward curve, with momentum picking up after a rounded-bottom pattern. Price is now heading toward two marked targets around 4333 and 4379, suggesting the bullish trend may still have room to grow. (Not financial advice.)
Do you think gold can break above the first target zone, or will it pull back before moving higher?

Gold Breaks the Triangle - Liquidity Targets Now in Sight📌 MACRO ANALYSIS REPORT — GOLD BREAKS THE TRIANGLE, BULLISH MOMENTUM ACCELERATES
1. Global Macro Environment
- Gold is navigating a highly supportive macro landscape as global financial conditions continue shifting toward lower yields, softer inflation, and rising risk-hedging flows. The U.S. economy has shown signs of gradual cooling most recently reflected in moderating labor data and softer inflation prints reducing pressure on the Federal Reserve to maintain restrictive policy. These developments keep real yields capped, which historically strengthens gold’s demand profile.
- In addition, rising geopolitical uncertainty and fragile sovereign debt dynamics in multiple regions (Europe, Middle East, parts of Asia) are reinforcing the global bid for safe-haven assets. Central banks especially in emerging markets have continued accumulating physical gold as part of long-term reserve diversification strategies. These macro forces combine to create a structural floor beneath gold prices.
2. U.S. Dollar & Treasury Dynamics
- The dollar has struggled to maintain upside momentum as markets increasingly price in the likelihood of policy normalization in 2025. Although the USD remains broadly resilient, the loss of bullish follow-through has weakened its pressure on commodities, especially gold.
- U.S. Treasury yields also remain near key cycle lows after a sharper than expected deceleration in inflation indicators. Lower yields reduce the opportunity cost of holding non yielding assets like gold, generating a more favorable environment for sustained upside movement. Combined with slowing global growth expectations, gold benefits from these yield/dollar dynamics aligning simultaneously.
3. Liquidity Conditions & Risk Sentiment
- Global liquidity conditions have improved subtly as several major central banks shift from tightening to neutral stances. China continues to inject targeted liquidity to stabilize domestic financial markets and support manufacturing. The Bank of Japan maintains accommodative conditions, while the ECB signals caution amid slowing Eurozone demand.
- Improved liquidity typically increases investors’ willingness to allocate capital toward alternative stores of value and inflation hedges—gold remains a primary beneficiary. Risk sentiment across global equities is stable but not euphoric, leaving investors open to diversifying into metals as a defensive balance.
4. Gold’s Structural Demand
Beyond short-term macro drivers, the long-term structural demand for gold continues to intensify.
- Central bank purchases remain near multi-year highs.
- Retail demand is being reinforced by inflation concerns, currency instability in several emerging markets, and elevated geopolitical risk.
- Institutional allocation into commodity baskets is increasing after years of underweight positioning.
This sustained structural demand provides a strong macro foundation supporting gold’s technical breakout.
5. Technical Confirmation Backed by Macro
- The chart shows a clear symmetrical triangle consolidation, a pattern typically appearing during periods of macro uncertainty. The strong breakout confirms that institutional flows are aligned with the broader macro narrative of falling yields and rising demand for safe haven exposure.
The current ascending leg reflects:
- Strong trend continuation
- Aggressive dip buying
- Absence of major supply zones until 4365–4370 liquidity
This aligns perfectly with the global macro backdrop favoring further upside movement.
6. Forward-Looking Macro Risks
While the outlook is constructive, a few key risks warrant monitoring:
- A surprise rebound in U.S. inflation could revive dollar strength
- Any aggressive Fed communication could temporarily suppress gold’s momentum
- Rapid easing in geopolitical tensions could reduce haven flows
However, none of these risks have materialized convincingly, allowing gold to maintain its bullish structure.
📈 Final Outlook
Gold’s breakout is supported not only by technical strength but also by a robust macro foundation: softening yields, a stalling dollar, central bank buying, improving liquidity, and persistent geopolitical risk.
As long as price maintains its higher-low structure and remains above channel support, the path toward the next major liquidity cluster at 4365–4370 remains firmly intact.

Gold (XAU/USD) Analysis – 15m ChartPrice continues to respect the ascending channel structure with multiple confirmations. After a strong reaction from the lower trendline, we are now looking for potential continuation toward the upper boundary.
Scenario: If the channel holds, price may aim for the mid-range and possibly retest the recent highs.
Key Levels:
Resistance: 4,220
Support: 4,195
Invalidation Zone: 4,175
This is a technical observation based on trend structure and price action. Not financial advice.
DISCLAIMER : THIS IS JUST FOR EDUCATIONAL PURPOSE I AM NOT A FINANCIAL ADVISOR

XAUUSD (1H timeframe)...XAUUSD (1H timeframe) chart clearly.
Price rejected strongly from the red supply zone and I have drawn two bearish downside targets.
Here are the exact targets based on My chart:
---
🎯 Target 1 (Short-term retracement)
➡ $4,270 – $4,275 zone
(this matches the first horizontal line my marked)
This is the first support where price may pause or bounce.
---
🎯 Target 2 (Deeper correction)
➡ $4,235 – $4,245 zone
This is the second major support you marked and aligns with the bottom of the Ichimoku cloud.
---
📌 Summary
Current price: around $4,297
Bearish move expected after supply rejection
Target 1: $4,270 zone
Target 2: $4,240 zone

XAU/USD – Technical Outlook (1H Chart)The chart shows gold consolidating within a clearly defined support zone after pulling back from recent intraday highs. Price has reacted multiple times to this support area, indicating that buyers are still active around the lower boundary.
A short-term bullish reaction is anticipated if the support continues to hold. The projection shows a potential recovery toward the first target near 4219, which aligns with a previous structure level acting as minor resistance.
Above that, a broader resistance zone sits higher on the chart, marked as the final target. This zone coincides with prior swing highs, making it a key area where momentum may slow or reverse if reached.
Key Notes:
Support Zone: Area where buyers have previously stepped in.
Mid-level / 1st Target: 4219 region, aligning with structural resistance.
Major Resistance / Final Target: Upper grey zone highlighted on the chart.
Bias remains neutral-to-bullish as long as the support zone continues to hold.
This analysis focuses on market structure and observable levels—not financial advice, just a technical interpretation of current price action.

XAUUSD (30m) – Breakdown | Supply Mitigation & Liquidity OutXAUUSD – Bearish Retracement Into Supply (30m)
Price has swept downside liquidity and is now retracing into a premium supply zone. Structure remains bearish, and this move looks corrective rather than impulsive. Watching how price reacts inside the unmitigated supply to confirm continuation.

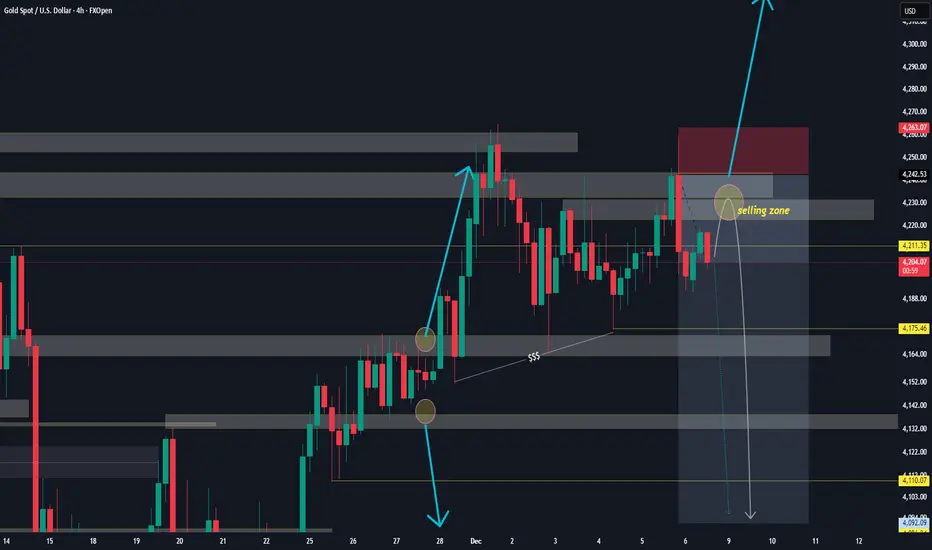
Gold Market Outlook: Rising Momentum Toward ResistanceOverall Market Structure
The gold price (XAUUSD) is moving inside a wide horizontal range:
Resistance zone: around 4,250 – 4,280
Support zone: around 4,160 – 4,120
Price is currently near 4,203, sitting in the middle of the range.
---
✅ Key Features on the Chart
1. Descending trendline break
You can see a downward diagonal trendline that has been broken earlier.
This normally signals that selling pressure has weakened.
2. Ichimoku Cloud
Price is hovering around the cloud:
When price is inside the cloud → market is uncertain
When price pushes above the cloud → bullish momentum increases
Right now it seems price is trying to climb above the cloud.
3. Arrows showing a potential upward move
The chart marks two upside targets:
Target 1: ~4,229
Target 2: ~4,250
These align with:
Minor resistance
Major resistance (range top)
---
✅ What the Price Needs for an Up-Move
For gold to move higher:
1. Hold above 4,200–4,205 support
2. Break above 4,220–4,230
3. Momentum toward 4,250 becomes more likely
---
✅ What Could Signal Weakness
If price drops:
Below 4,200, sellers gain control again
A fall back to 4,160 becomes possible (bottom of the big range)
---
⭐ Summary
The chart suggests possible bullish momentum forming.
But major resistance sits near 4,250–4,280, which has rejected price before.
The market is still range-bound, not in a strong trend.

XAUUSD – Price Action OutlookPrice is hovering around a major resistance area, and the recent candles suggest hesitation from buyers. A clear rejection from this zone may invite selling pressure, while a strong breakout and sustain above it can open the door for further upside.
At this stage, it’s important to wait for confirmation rather than anticipate the move. Gold often gives false breakouts around key levels, so disciplined risk management is essential. Let the price action decide the next direction.

Gold Stalls as Markets Brace for the FedGold is entering a sensitive phase as both news and technicals show the market temporarily hitting the brakes ahead of the Fed’s signal. On the macro side, the delayed release of October–November PPI data to January 2026 adds another layer of uncertainty around inflation. With a lack of critical numbers, investors typically reduce risk exposure, causing safe-haven demand for gold to cool off. At the same time, this week’s Fed meeting is creating notable psychological pressure. Many traders fear Powell may adopt a firmer tone or signal that it is “too early to ease,” which could dampen rate-cut expectations. In this environment, the DXY has inched higher and the 10-year yield is holding near 4.15%, both acting as headwinds for gold.
On the chart, after failing to retest 4,220 USD/oz successfully, gold slipped back toward 4,180–4,190 and is showing visible hesitation. The 4,210–4,220 area remains a short-term ceiling, with repeated upper-wick rejections signaling ongoing profit-taking pressure. To the downside, price is still holding above the Ichimoku cloud and the 4,170–4,180 equilibrium zone, but if this area breaks, the risk of a deeper move toward 4,140–4,150 increases significantly.

Gold: Narrow-Range Oscillation TodayGold is trading in a narrow-range oscillation overall with intense bull-bear confrontation. Influenced by a combination of fundamental and technical factors, the market is in a short-term consolidation phase, awaiting a clear directional breakout. Despite extremely stable intraday performance (volatility less than 0.3%), the backdrop features a high-stakes game with open interest surging to 450,000 contracts. Primarily, amid anticipation of the Fed’s policy announcement, market sentiment remains cautious, making a one-sided trend unlikely.
The Bollinger Bands are showing signs of contraction, and the moving average system is converging, this pattern further confirms gold’s current consolidation state.
Key support and resistance levels are clearly defined:
Intraday Short-term Resistance: $4,225 – $4,230, a critical suppression level for short-term price action.
Strong Resistance: $4,250 – $4,260, a zone that has repelled multiple breakout attempts, accumulating significant profit-taking sell orders.
Intraday Short-term Support: $4,190 – $4,200.
Strong Support: Around $4,175 – $4,180 that is a crucial watershed for bull-bear dynamics.
Trading Strategy:
Buy 4195 - 4205
SL 4180
TP 4225 - 4235 - 4245
Sell 4235 - 4225
SL 4245
TP 4210 - 4200 - 4190

XAU/USD | Further drop for gold? (READ THE CAPTION) Good morning folks, Amirali here with another analysis on Gold.
As you can clearly see, BSL was taken and a pool of liquidity now awaits above the 4264.50 level, exactly below the lower part of the FVG, at 4272.50 level.
Gold also reached the $4174 FVG (in a lower timeframe) and then surged to $4186 level before dropping and now is being traded at 4176 level.
There's an old NDOG at $4164.50 level which I expect a reaction from Gold to it. Just below this NDOG, there's an IFVG in 4111-4159 zone which I believe after the reaction to $4164 level, Gold might drop there and will react to it.
Sincerely, Amirali

XAUUSD Forming Falling WedgeXAUUSD continues to show strong bullish interest as buyers remain in control despite minor corrective phases. The current structure fits a falling wedge pattern that has already shifted momentum upward, with a clean breakout that supports further upside continuation. The market is currently reacting from a short-term rising support trendline, but if price pulls back deeper, the major demand zone below remains a key area where strong bullish reactions are likely to re-enter the market.
Fundamentally, gold remains one of the most attractive safe-haven assets as uncertainty continues around global economic conditions and expectations of future Federal Reserve rate cuts. Lower interest rate expectations weaken the US Dollar and improve demand for gold. Investors are also increasing exposure to gold as central banks continue to accumulate reserves, reinforcing buyer confidence in XAUUSD. This mix of risk sentiment and macro drivers continues to support upward pressure.
Short-term, price may retest liquidity levels below to collect more orders before the next strong bullish wave begins. That deeper discount zone aligns with the ideal confluence for high-probability continuation setups. Once buyers confirm support, I expect a strong impulsive rally targeting the next significant highs, maintaining gold’s bullish trajectory in the current macro environment.
The overall trend is bullish and fundamentals remain supportive. As long as the key demand zones hold and buyers stay active, XAUUSD looks set to push higher and continue delivering profitable upside movement.

Gold Weekly Analysis – Dec 8Hi guys
🔶 Gold Weekly Analysis – Dec 8 (H4)
📈 Overall bias: Bullish
🔸 Resistance 1: 4237.5
If we see a CHOCH + break of structure, I’ll look for a sell setup.
🔸 Resistance 2: 4317.4
If price breaks above the first zone, this is the next major level to watch.
🔹 Support: 4100.4
If price pulls back to this zone and gives a CHOCH confirmation, it can be a great buy setup.

Gold Weekly Trend: XAU/USD Ready to SurgeGold Weekly Trend: XAU/USD Ready to Surge
Gold closes the week with a steady bullish profile, maintaining a structure that reflects strong positioning from larger market participants. The weekly flow shows a market that continues to rotate upward through liquidity pockets while holding firm during corrective phases.
This week’s behavior indicates that buyers remain active on every controlled retracement, keeping the overall structure balanced and directional. The price continues to move in a sequence of expansion → stabilisation → renewed expansion, which is a common pattern when the market is preparing for sustained upside development.
Underlying order flow suggests that Gold is still within a broad accumulation cycle at higher levels, where the market repeatedly absorbs sell-side attempts and transitions back into bullish pressure. The consistency of this pattern signals confidence from long-term participants and reduces the probability of a structural shift at this stage.
As the week closes, the overall environment remains favorable for continued appreciation. Price is advancing in a measured, orderly fashion rather than showing signs of exhaustion. This steady progression typically precedes multi-week continuation phases, especially when liquidity objectives remain active above current trading levels.

Hellena | GOLD (4H): LONG to resistance area of 4298.I suggest to consider the lower timeframe (1H), which has some peculiarities.
I see here an upward impulse in the red wave “3”, which is not over yet.
I believe that we should expect the price in the resistance area of 4298.33.
A small correction in the form of continuation of wave "4" to the area of 4174.78 is also possible. But in general, I am set for long positions.
Manage your capital correctly and competently! Only enter trades based on reliable patterns!

Gold Market Outlook: From Friday’s Volatility to Weekly Strategy
Last Friday was a textbook example of why I prefer to close positions early during the New York session. Everything followed my plan until mid-NY, when price broke the previous high but quickly pulled back to the 4,200 psychological benchmark. This was clear profit-taking ahead of the weekend, a common pattern that reinforces disciplined risk management on Fridays.
The monthly chart tells a compelling story. After breaking a multi-year neutral rectangle, gold entered a strong bullish cycle starting March 2024.
Key observations:
First bull run: 7 months, +28.7% gain → followed by 2-month consolidation.
Second bull run: 2 months, +25% gain → followed by 3-month consolidation.
Third bull run: +25% gain → now in third consolidation zone, likely before an attack on a new historical high.
This cyclical pattern suggests that the current consolidation is a launchpad for the next breakout, with mid-term targets at 4,300 and 4,380, and potential for new all-time highs if m
momentum persists.
On the 4H chart, price remains inside the neutral zone of an ascending channel:
Strong support: 4,192
A break below this level opens the path to the channel’s higher low at 4,164.
More likely scenario: Bullish engagement above 4,220 zone, aiming for a retest of the previous month high (4,246).
This week is packed with catalysts:
Wednesday: Federal Reserve interest rate decision – a critical event that could define gold’s next major move.
Labor market data: Strong U.S. numbers may trigger short-term pullbacks, while weaker data will reinforce bullish sentiment.
Geopolitical tensions and rate-cut expectations continue to provide structural support for gold.

Gold Buyers Lose Momentum as Correction Risks IncreaseHello everyone,
On the H4 timeframe, gold continues to face heavy resistance as it approaches the 4,225–4,235 USD zone — an area that has repeatedly formed bearish FVGs and concentrated liquidity at the highs, causing every bullish attempt to be rejected. The latest strong bearish candle pushed the price below the equilibrium zone and dragged gold back toward 4,200 USD, clearly reflecting a more cautious market sentiment as buyers fail to maintain previous momentum.
From a structural perspective, gold is moving within a weakening sideways phase, consistently forming lower highs around 4,230–4,235 USD. This signals that buyers have lost their advantage, while larger players appear to be distributing positions at resistance. Although the price still trades above the Ichimoku cloud edge, consecutive candle closes below the equilibrium line are creating visible corrective pressure. This pattern is typical before gold attempts a deeper downward move to sweep liquidity beneath current levels.
The Volume Profile further reinforces this view. The dense trading range observed between 11–19 November has established a strong supply zone at 4,220–4,235 USD. Every time the price retests this area, immediate selling pressure emerges, showing sellers are defending the zone effectively while buyers lack the strength to break through. The combination of weakening structure, resistance FVGs, and a significant supply cluster continues to elevate the short-term correction risk for gold.

THE KOG REPORT - UpdateEnd of day update from us here at KOG:
Not a bad week at all with price bouncing the low to give us the long into the region of interest where we wanted to short. We got the short into the defence box which is where we faced a bit of ranging and accumulation but the level held well and we're on our way.
Now, we have support 4240 as the key level for the close while 4265-70 is the level to watch for the break. Defence above, we'll be happy to achieve that for the week.
Wishing you all a great weekend and we'll see you on Sunday for the KOG Report and our view for the week ahead. Please take some time to hit the boost button on our ideas.
As always, trade safe.
KOG

Gold next move (weekly forecast) (8th Dec - 12th Dec-2025)Go through the analysis carefully, and do trade accordingly.
Anup 'BIAS for the week (8th Dec - 12th Dec-2025)
Current price- 4210
1st scenario
"if Price stays below 4235, then next target is 4190, 4170, 4150 and 4110"
2nd scenario
if price stays above 4235 on 4H- TF, then the next target is 4260, 4300,4340.
Best of luck
Never risk more than 1% of principal to follow any position.
Support us by liking and sharing the post.