Selena | XAUUSD 1H – Sweep → Accumulation → Demand Reaction PEPPERSTONE:XAUUSD FOREXCOM:XAUUSD
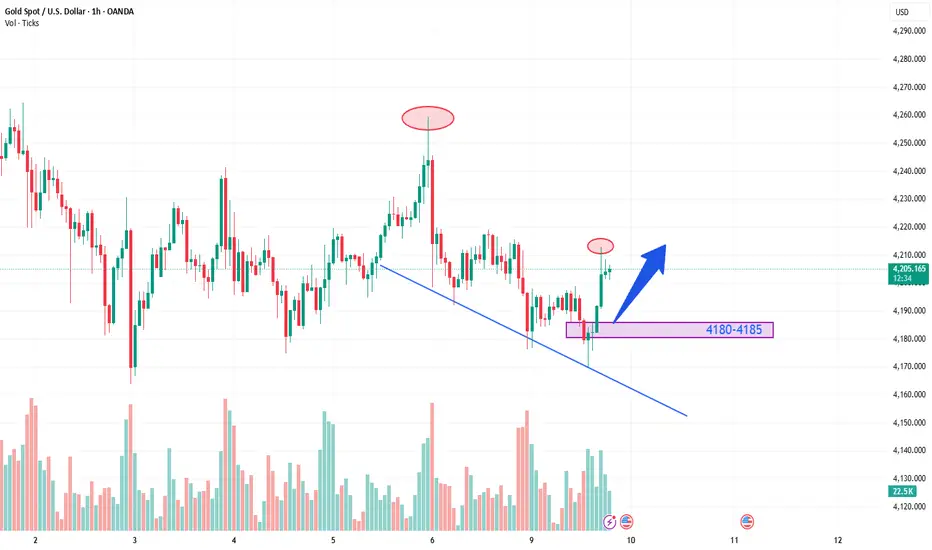
Gold continues to respect the major ascending support channel while repeatedly sweeping sell-side liquidity into the same rebid demand. Current price is compressing below breakout structure, suggesting accumulation before expansion. Untapped buy-side liquidity remains above 4240–4260 — a clean future draw.
Primary Bias — Bullish Delivery if Price Holds Demand
Hold above CRQ Demand 4170–4185 →
🎯 Target 1: 4214 (Breaker reclaim)
🎯 Target 2: 4232 (Pre-FOMC high fill)
🎯 Main Objective: 4256–4268 Buy-Side Liquidity Pool
Break and acceptance below 4165 →
Resistance: 4232 / 4256-4268
Support: 4170-4185 (CRQ Validation) / 4165 (Kill-Switch Level)
⚠️ Disclaimer: This view is for educational purposes only. Not financial advice.
Trade ideas

Gold will rise
On Friday, the US September core PEC annual rate unexpectedly fell to 2.8%, a three-month low. The US dollar index ultimately closed down 0.08% at 98.99. US Treasury yields rose to their highest levels in weeks, as investors anticipated a hawkish rate cut from the Federal Reserve. The benchmark 10-year Treasury yield closed at 4.1410%, while the 2-year Treasury yield, sensitive to Fed policy rates, closed at 3.5710%.
Spot gold rallied briefly during the session, approaching the $4260 mark, but subsequently retreated from its highs, erasing all of its intraday gains and closing below the $4200 level, ultimately falling 0.27% to $4197.13 per ounce. Spot silver historically broke through the $59 mark, setting a new record high for the second consecutive day, ultimately rising 2.03% to $58.3 per ounce.
The sharp drop in gold prices at the end of last week validated my view that one shouldn't overemphasize the potential for price fluctuations within this cycle, as there might be sweeping price action. Therefore, I didn't chase the upward trend on Friday, thus avoiding the significant drop. The price closed near 4195, which basically confirms that gold will maintain last week's range-bound movement this week. We still need to observe the price action within this range, buying low and selling high, and then assess the continuation or breakout of the trend based on market changes. Therefore, the immediate range for gold remains 4260/4170. A breakout above or below this range could lead to 4300 on the upside and 4120 on the downside.
From a technical perspective, both the daily and H4 charts show a range-bound pattern. The daily chart lacks a strong bullish signal, while the H4 chart shows Bollinger Bands narrowing and moving averages converging, indicating no clear direction. The current H4 range is 4230/4180. This means that at the beginning of the week, traders can buy low and sell high within this range. A breakout in either direction would expand the range to last week's 4260/4170. Gold is currently fluctuating around 4190. Aggressive traders can go long directly, while conservative traders can go long at 4180, waiting for the price action from last week during the European and American sessions.
Investment Strategy: Buy gold at 4170-80, stop loss at 4160, target 4230, hold if it breaks through.

Understanding the XAUUSD/BCOUSD SpreadThis is my first post here on TradingView, excited to share some insights on the XAUUSD/BCOUSD spread!
The XAUUSD/BCOUSD spread compares the price of Gold (XAUUSD) to Brent Crude Oil (BCOUSD). This ratio can be a simple yet powerful indicator for understanding market sentiment and risk appetite.
When traders compare gold (a classic safe-haven asset) with oil (a growth-linked commodity), the resulting spread often reflects how the market feels about risk, uncertainty, and economic conditions.
When the spread is rising (bullish spread), it means gold is outperforming oil. This typically indicates risk-off sentiment, higher demand for protection, and weak economic optimism. In short, a rising spread reflects fear, caution, and increased risk aversion.
When the spread is falling (bearish spread), it means oil is outperforming gold. This often signals risk-on sentiment, higher economic confidence, and decreased demand for safe havens. In short, a falling spread reflects confidence, optimism, and greater risk appetite.
Why this spread matters: it blends the behavior of two key macro assets, can act as a leading indicator for risk sentiment shifts, and is useful for traders of indices, commodities, FX, or crypto who want a broader context of market psychology. Monitoring this spread can help you stay aligned with macro flows and improve trading decisions during uncertain conditions.
Disclaimer:
This post is for educational purposes only. Always do your own research before making any trading decisions.

Elite | XAU/USD – 30m | Bullish Compression Targetting ATH 4300$OANDA:XAUUSD
Price continues to defend major support (4,150–4,175) with repeated upside structure shifts (BOS). Descending trendlines are compressing price, signaling breakout readiness. As long as price remains above the demand zone, bullish continuation remains favored.
If price re-tests demand & holds → breakout scenario becomes high probability.
A confirmed break above 4,228 unlocks liquidity toward 4,256 and the extended upper target.
Key Scenarios
🔼 Bullish Breakout Plan
Hold above 4,194 support → bullish bias active
Break & retest 4,228 = entry trigger
🎯 Targets → 4,256 → 4,265+
🔽 Failure Case
Bearish only if price closes below 4,150 zone
Below this → structure collapses + deeper correction likely
⚠ Disclaimer: Market analysis only — not financial advice.

XAUUSD: The Calm Before the Breakout1. Market Volatility
- Gold continues to move strictly inside the descending channel, creating a clear sequence of lower highs and lower lows.
- Each attempt to retest the upper boundary of the channel results in a rejection, confirming that sellers are still controlling short-term momentum.
- The volatility remains controlled and technical, with price respecting channel structure and moving methodically downward.
2. Trader Psychology
- This is the phase where many traders anticipate a reversal too early simply because price has declined for multiple sessions.
- However, professionals wait for structure-based confirmation, not hopeful speculation.
- Gold’s current movement punishes impatience and rewards traders who stay aligned with the dominant trend and wait for clean signals around key levels.
3. Key Drivers / Market Reasoning
Price is actively cycling liquidity between the descending channel and the major support zone at 4148–4160.
Current movement reflects:
- Institutional order-building near channel lows
- Rejection liquidity being created at the upper boundary of the channel
- Absence of strong catalysts during this session, allowing technical structure to dominate
- Market preparation for a larger move once liquidity is fully gathered
Gold is not ready to break out yet—it continues to accumulate orders inside the channel before choosing the next major direction.
4. Trading Strategy
🔸 Primary Plan: Expect a retest of the short-term resistance zone near 4195–4200 (upper channel boundary).
🔸 Sell Setup: Watch for bearish rejection at this zone
→ Target the support zone at 4148–4160 in alignment with the channel direction.
🔸 Buy Setup (Alternative Scenario): Only consider BUY positions if price breaks and closes decisively above 4200–4210
→ This would signal a potential reversal and retest, breaking the descending structure.
🔸 Risk Management: Gold is moving within a tightening channel, meaning a liquidity break can occur sharply.
Maintain controlled lot size and avoid early entries.
5. Trend & Price Outlook
- The overall structure continues to favor downside continuation as long as price remains inside the descending channel.
- The 4148–4160 support zone is the most critical area to monitor—this is where institutional demand previously stepped in.
- Until gold breaks above the descending trendline, the bearish roadmap remains intact and is unfolding exactly as expected.
Stay patient now — this is where smart money positions before the big move.


XAUUSD TRADE UPDATEGOLD abhi apna new high point bna kr k down aane k chance h so abhi jab jab gold down me ak short move de to buy kre new high k liye

XauUsd Gold buy Signal AlertBuy Signal: Long positions valid above 4190.
Targets: 4223–4230.
Stop-Loss: Below 4175.
Price must hold above the breakout level; trade only if momentum supports continuation. Manage risk according to your rules.

GOLD scalping ideaGOLD BUY SETUP ACTIVE
Entry Level: 4201
❌ Stop Loss: 4189
🎯 Target Level: 4220
Price is showing bullish momentum from the lower support zone. Buyers are gaining strength, and the market may push upward toward the next resistance level as demand increases. 📈🔥
⚠️ Disclaimer: This is not financial advice, just my market outlook.

XAU/USD | Gold smashes through the supply zone(READ THE CAPTION)Good morning folks, Amirali here.
As you can see, Gold smashed through the supply zone and it is now being traded in the 4270-4320 FVG zone.
I expect Gold to rise to 4320 level, and then a reaction before reaching the NDOG + LV of 4330 level. If Gold goes through this level, I expect to reach the bearish OB. Should it fail, a drop to FVG zone and consolidatiON there is expected.

XAUUSD – Brian | After the rate cutXAUUSD – Brian | After the rate cut, Volume Profile still favours further downside
1. Market snapshot
After the rate cut, gold saw a bounce but failed to sustain the upside and is still hovering below last week’s highs.
In the Asian session, price only ticked up slightly before being sold off again – a sign that buying pressure is not particularly strong at these levels.
Risk-on sentiment has returned and the USD is seeing a modest recovery, which is weighing on XAU/USD.
That said, expectations for the Fed to maintain a dovish tone could still cap USD strength in the medium term.
Overall, in the short term Brian still leans towards a downside move, preferring to sell into liquidity above rather than chase buys.
2. Volume Profile view – Key levels to watch
On the H1 chart, Volume Profile highlights three main areas:
VAL – Buy scalping zone: around 4,207
→ Current lower value area, where a short technical bounce may appear.
Liquidity / Sell zone: around 4,222
→ Liquidity pocket above, lining up with VAH and a volume cluster – an attractive area to look for sells if price is pushed back up for a retest.
Deeper buy zone: around 4,166
→ Broader demand area below; if price flushes lower after sweeping liquidity, this is where dip-buying interest may show up.
3. Trade scenarios (for reference)
Scenario 1 – Sell at the 4,222 liquidity zone (primary idea)
Idea: Wait for price to retrace into the 4,222 liquidity zone and then look for rejection signals on H1/M15.
Sell zone: 4,220–4,223
Suggested SL: Above 4,230
Targets:
TP1: 4,207 (VAL)
TP2: 4,190–4,185
TP3: 4,170–4,166 (deeper buy zone)
This setup follows the current bearish bias, using the logic of “sell the rally into high-volume + liquidity zones”.
Scenario 2 – Light buys at VAL 4,207 & buy zone 4,166
Scalp buy at VAL:
Entry zone: 4,204–4,207
Target: bounce back towards 4,217–4,220 and then exit, not a long hold.
Buy at the deeper 4,166 zone (cleaner level):
Entry zone: 4,164–4,168
SL: Below 4,158
TP: 4,190 → 4,210 if a clear bullish candle reaction forms and the Fed does not turn overly hawkish.
Both buy scenarios are purely short-term corrective plays, so position size should be kept modest as the main bias remains to the downside.
Be patient and only start thinking about sells once price tags the 4,222 area – avoid forcing entries when price is stuck in the middle of the range.
In summary: Selling around 4,222 is the primary plan, while buys at 4,207 and 4,166 are secondary strategies that only come into play if there is a clear reaction from Volume Profile and price action.

XAUUSD: Market Analysis and Strategy for December 9th.Gold Technical Analysis:
Daily Resistance: 4300, Support: 4145
4-Hour Resistance: 4260, Support: 4165
1-Hour Resistance: 4220, Support: 4170
Short-term, gold still faces significant selling pressure. Today's strong rebound after falling to 4170 in the London market further confirms the recent lack of strong continuity in either bullish or bearish trends. The price is maintaining its position above the trendline, and this continued consolidation is building momentum for future price movements. While awaiting fundamental developments, the market is also brewing a significant one-sided move. The Bollinger Bands widening provide support for short-term upward movement. There is some support. During the US session, pay attention to the support level around 4170. The continued divergence in the MACD/KDJ/RSI indicators increases the risk of market volatility; be wary of unexpected market reversals.
Looking at the 1-hour chart, the price has rebounded strongly upwards, breaking through the resistance level but encountering resistance near the previous high. Indicators show strong upward momentum. Pay close attention to the resistance level around 4220. Once broken, it will likely continue to test the 4260 target in the short term. At that point, you can follow the trend after the breakout.
Trading Strategy:
BUY: 4185~4180
SELL: 4220near
More Analysis →

XAU shorts🩳
2 profiles here. One on confirmed, the other for early birds…. Requires brain cells…
$4240 is on the hunt here and can do it from this handle…
Better confirmed on $4318….
Lassgoo NY!!!!
Next week longs ✅
😎🔑

XAUUSD – Brian | H1 Volume ProfileXAUUSD – Brian | H1 Volume Profile: risk of deep decline as market awaits PCE data
Market snapshot
On H1, gold is declining in a rather "clean" structure, continuously creating lower highs and lower lows.
The 4.175 area is currently the nearest support – if breached, the decline could extend another 50–60 points to lower areas.
Price remains below 4.250 USD, as the market awaits PCE data (Fed's preferred inflation measure) to find a clearer direction.
Technical map – Volume Profile & price areas
Important areas today: 4.210 – 4.200 – 4.175 – 4.164 – 4.133
4.210–4.200: upper area, coinciding with the nearest POC/VAH cluster – selling pressure likely when price retraces here.
4.175: short-term support + area with sell-side liquidity; if this area is lost, price could be pulled to a deeper demand cluster.
4.164–4.133: potential Buy zone in a deep decline scenario – Volume Profile shows significant buying occurred around this area previously.
In short: on H1, the trend is down, prioritize selling according to volume; consider buying only when price falls to a lower discount area.
Trading scenario reference
(Not personalized advice – adjust volume & SL according to your account)
Scenario 1 – Sell following the downtrend structure (priority)
Sell area: 4.210–4.200 (POC/VAH + technical retracement area)
Idea: Wait for price to retrace to this area, observe H1/M15 for rejection candles (long upper tail, pin bar, engulfing…) before activating a Sell order.
Suggested take profit areas: TP1: 4.175
TP2: 4.164
TP3: 4.133 (in case of a strong 50–60 point decline)
Scenario 2 – Buy at deep discount area
Buy area: 4.164–4.133
Idea: Only consider buying when price has "dumped" deeply enough into the buy zone, with clear reversal candles on H1.
At that point, this is a technical retracement play, not trying to catch the bottom of a major trend.
Suggested take profit areas:
TP1: return to 4.175
TP2: 4.200
Macroeconomic context – Why is gold still hesitant?
Gold recorded a slight increase on Friday, but remains within the narrow trading range of the week.
Expectations of a dovish Fed continue to pressure the USD, generally supporting gold in the medium term.
However, buyers are waiting for US PCE data before taking larger positions:
If PCE cools significantly → reinforces the story of an early Fed rate cut → gold could easily rebound.
If PCE remains stubborn → market fears a "hawkish rate cut" scenario from the Fed → yields may rise, adding selling pressure on gold.
Risk management
For the Sell scenario, avoid chasing price in the middle of the area – prioritize waiting for a retracement to POC/VAH before entering, with a tight SL above the 4.210–4.215 area.
If participating in the Buy play at 4.164–4.133, consider splitting TP and moving SL to breakeven as soon as TP1 is reached to avoid constant chart monitoring.

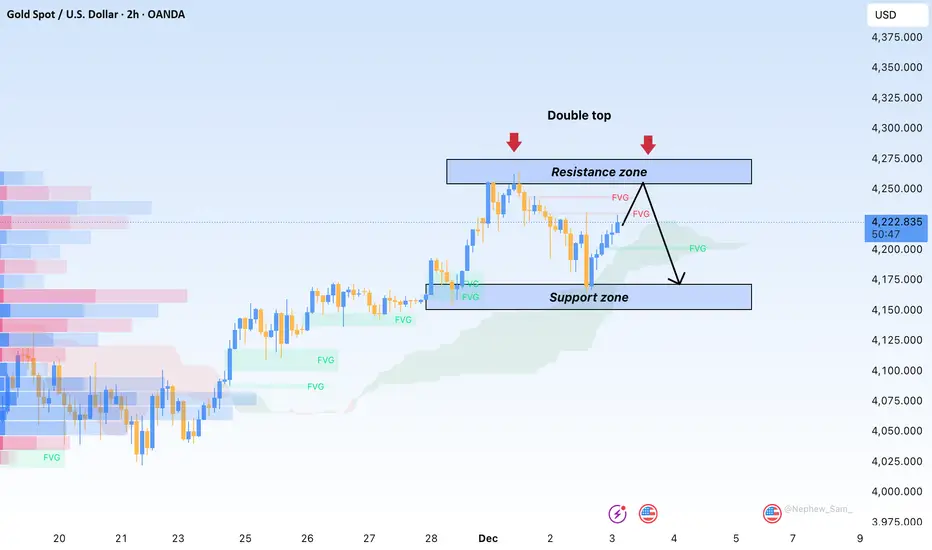
Gold Surges Strongly but Fails to Maintain MomentumHello everyone, the recent movement of gold reflects a market heavily influenced by “news-driven support overshadowed by selling pressure.” XAUUSD made an impressive breakout to 4,237 USD/ounce — the highest level in six weeks — as safe-haven flows returned on geopolitical tensions and expectations that the Fed will continue its rate-cut cycle. But only hours later, profit-taking rushed in, sending gold down more than 30 USD and pulling the metal back to the 4,207 USD region this morning.
This weakness mainly stems from improving risk sentiment: US equities rebounded, with the S&P 500 turning green and the Nasdaq pushing higher as tech stocks led the move. Japanese markets also stabilised as bonds cooled, reducing demand for safety. And with the DXY climbing to 99.18, downward pressure on gold became even more evident — a stronger USD rarely favours the precious metal.
From a technical perspective, the 4,180–4,190 FVG zone helped lift price again after the sharp drop, but gold remains capped beneath the upper FVG resistance. The Ichimoku cloud on the 2H timeframe shows price approaching the Kijun–Senkou intersection — an area that historically attracts selling pressure. This keeps the current price action more aligned with a supply retest rather than the beginning of a genuine bullish trend.
In summary, gold is facing an important test. The 4,235–4,245 region remains the key barrier: a breakout could quickly extend momentum toward 4,260–4,285, while another rejection could push XAUUSD back toward 4,190 to collect liquidity before deciding on its next direction.
Gold (XAUUSD):
Gold (XAUUSD):
The overall trend is bullish; the price is currently in a corrective phase.
Key buy zone: 4141–4114
If price reacts from this area, targets are 4242–4265 and 4375–4395.
A break and close below 4110 invalidates the bullish scenario.

XAUUSD ExpansionMarket Outlook: Bullish / Long
Analysis: Gold has confirmed a classic Market Maker Buy Model (MMBM) on the H1/H4 timeframe. We have successfully completed the Sellside Curve, swept the lows at 4180, and confirmed a Smart Money Reversal via a clear Market Structure Shift (MSS).
The Setup: Price is currently in the "Buy Side Curve" expansion phase. I am monitoring the retest of the Bullish Order Block & Rejection Block (-RB/+OB) zone between 4280 - 4300.
Confluence: The entry zone aligns with the 50% OTE and fills the recent Balanced Price Range (BPR).
Validation: The market has reclaimed the Original Consolidation zone (4211 - 4245), turning it from resistance into support.
Targets:
TP1: 4350 (Internal Range Liquidity)
TP2: 4375 (1D HTF Buyside Liquidity / Key Level 4H)
Invalidation: A 4H candle close below the 4270 Order Block invalidates the immediate bullish continuation.

XAUUSD – Brian | Volume Profile & Fed WeekXAUUSD – Brian | Volume Profile & Fed Week: prioritize Sell at VAH, Buy only when reaching discount price area
1. Market snapshot
On H1, gold retested last week's peak and then dropped immediately, indicating that buying pressure at high price levels remains cautious – investors are not ready to "chase the price."
The current structure does not clearly show a long-term trend, but in the short term, there are signs of distribution around high price levels, favorable for selling scenarios according to Volume Profile.
Today, Brian prioritizes watching for a Sell after the price fills the FVG and touches the VAH, while also preparing a Buy scenario at a lower area if the market sweeps liquidity strongly.
2. Volume Profile & price structure
The VAH area around 4,233–4,235 coincides with the FVG area above:
This is where large volumes were previously traded, making it easy for profit-taking/sell-off forces to appear.
Below, the sell-side liquidity levels are spread around 4,200 – 4,175 – 4,140, coinciding with the lows of previous sessions.
The area 4,172–4,175 is a good balance zone for the Buy scenario: below it is a cluster of liquidity and just above a broader Buy zone around 4,140 on the chart.
3. Trading plan for this week
Scenario 1 – Sell according to Volume Profile (priority)
Entry Sell: 4,233–4,235 (VAH + FVG)
SL: 4,241
TP1: 4,215
TP2: 4,200
TP3: 4,175
TP4: 4,140
Idea: wait for the price to fill the FVG and touch the VAH, observe the H1/M15 candle reaction. If there is a clear rejection signal (long upper tail, pin bar, engulfing…), activate the Sell order. This is a short-term play, based on volume & liquidity, not a chase sell when the price is in the middle of the zone.
Scenario 2 – Buy when the price reaches the discount area
Entry Buy: 4,172–4,175
SL: 4,165
TP1: 4,195
TP2: 4,220
TP3: 4,245
TP4: 4,290
Idea: if the price is strongly sold off sweeping through the sell-side liquidity areas, the area 4,172–4,175 can become a good demand zone to catch the rebound, especially when a nice candle reaction appears on H1. This is a "catch the rebound" buy position in the context of this Fed week, requiring disciplined SL.
4. Macro context – Why is the market hesitant?
Last Friday, gold jumped to 4,260 USD and then quickly fell to 4,200 USD, mainly due to the sharp rise in US bond yields as the market awaited the Fed meeting.
Although the market still prices in a high probability of the Fed cutting 25 bps, sentiment is divided by the "hawkish rate cut" scenario:
The Fed cuts but maintains a tough tone on inflation → yields are unlikely to fall deeply, gold is easily sold at high levels.
USD maintains its range, US economic data is relatively stable, causing money flows to "not dare to all-in" on gold before the dot-plot and Powell's speech.
Therefore, this week is the Fed's week: the short-term direction of gold will depend heavily on the policy message, especially the expected reduction path for next year.
Follow to receive the earliest articles from Brian

Elise | XAUUSD 15m — Sweep → Reaccumulation setupOANDA:XAUUSD
Price grabbed upside liquidity at 4258 and reversed into range accumulation.
Then price swept sell-side into strong demand at 4170–4178, reclaimed structure, and is now retesting micro-trend memory.
Bullish continuation is valid only if price confirms above short-term structure.
Long Scenario (Requires Break)
Break + hold above 4204–4208 enables expansion toward liquidity at:
• Target 1: 4218
• Target 2: 4225 liquidity pocket
Invalidation
Break below 4178 demand base cancels bullish structure and opens retracement toward:
• 4156
• 4138 deep sweep
Currently price is neutral until a bullish breaker confirms.
You do not have an entry just because price is bouncing.
⚠️ This is for educational structure only. Not financial advice

XAU/USD Daily Outlook – Tuesday Strategy
The Tokyo session offered a decent buying opportunity, which I utilized by opening a position at 4175.5 and closing at 4185. This early move reinforces the view that intraday selling pressure remains limited, aligning with my mid-term bullish bias.
Market Context
Investors have largely priced in a Federal Reserve rate cut, but the real risk lies in the magnitude of the easing cycle. A milder-than-expected approach could disrupt linear bullish momentum and introduce volatility. With the Fed decision scheduled for Wednesday, the market is in a cautious stance, balancing technical setups with macro uncertainty.
Technical Outlook
Key Resistance: 4200 (psychological benchmark)
Bullish Scenario: I’ll remain on the sidelines until we see a clean break above 4200.
Once confirmed, I’ll engage long positions targeting 4219 as the next resistance zone.
Bearish Scenario: Price action below 4176 could give sellers momentum, but I’ll avoid shorts unless 4164 is invalidated.
If that happens, targets will be 4152 and 4135.

XAU/USD Gold looking strong bullish trend buy move 📈 XAUUSD (Gold) New Forecast – Bullish Momentum Building
Gold is showing strong bullish structure, and price action suggests a potential continuation to the upside. For buyers, the key focus will be on a clean breakout above the 4218 resistance zone.
🔑 Buy-Side Technical Outlook
If price successfully breaks and sustains above 4218, we could see bullish continuation toward the following resistance targets:
4230
4237
4249
⏱ Recommended Time Frame
Use the 30-minute chart for confirmation. Wait for a decisive breakout with strong candle closure before considering entries.
⚠️ Risk Management
Always apply proper risk management. Avoid overleveraging and ensure your stop-loss aligns with your trading plan.

XAUUSD-Breakout to the upsideAfter breaking through 4250, gold has now risen above 4270. Watch the 4280 resistance level; a successful break above this level could lead to 4300-4320.
Pay attention to the resistance above. The market is currently very risky; be wary of a sharp drop. However, the bullish trend remains strong. We can use the 4250-4260 support level as a buying opportunity on pullbacks.
For more market analysis, please see my link.

Compound interest within the golden rangeGold surged to 4118 yesterday, then fluctuated during the European session before falling rapidly during the US session. Today, the Asian and European sessions continued the bearish trend from yesterday's US session, but after falling to a low of 4170, it rebounded quickly. Currently, both bullish and bearish trends exist. Today, shorting at higher levels and going long at lower levels can be considered.
Overall strategy: Given the current range-bound trading, maintain range-bound trading for now. Further updates will be provided.