XAUUSD remains stable at high levels, focus on what comes nextHey everyone, Erik here.
XAUUSD has been showing strong momentum lately. After a sharp decline, the market quickly recovered, rebounding powerfully from the lower boundary of the newly projected channel. What initially appeared as weakness was actually a calculated shakeout, trapping sellers before reversing upward with confidence.
This behavior is typical of strong bullish trends. It clears out weak positions, triggers stop losses, and restores balance before the next upward movement. At this stage, the market appears to be entering the early phase of a new bullish impulse.
There might be a short consolidation or a slight correction, but the momentum is clearly pointing toward the upper boundary of the channel. For XAUUSD, the bullish continuation scenario seems far more convincing.
My target is around 4,585, near the upper resistance zone of the projected channel. The overall market structure remains decisively bullish, and the emotional surge during the last drop may become the fuel that powers the next strong rally.
Trade ideas

Gold drops sharply, but don't give up just yet.Hello traders,
Gold experienced a sharp decline on October 21st , as investors began to take profits following strong expectations that the U.S. might cut interest rates. This is a necessary correction after a sustained rally that pushed gold to record highs. However, don’t be too quick to assume this signals a strong downtrend – even during this correction, gold still maintains certain strength.
With the easing of trade tensions between the U.S. and China, as indicated by President Donald Trump's forecast of a peace deal , the demand for safe-haven assets like gold might decrease. However, keep in mind that, in the long run, factors such as the Fed’s ongoing low interest rate policy will continue to support gold prices.
The current chart shows gold recovering after a sharp drop to the support level of 4,020,000 USD/ounce , with a strong bullish candle forming above the EMA 34 line (red), signaling the continuation of the long-term uptrend. The next target could be 4,210,000 USD/ounce, but before reaching this level, gold might experience a slight correction, providing an opportunity to enter at a more attractive price. If you are holding gold, be patient and wait for the next breakout.

XAUUSD: Market Analysis and Strategy for October 23Gold Technical Analysis
Daily Resistance: 4380, Support: 4000
4-Hour Resistance: 4185, Support: 4015
1-Hour Resistance: 4160, Support: 4065
Gold prices have fluctuated significantly recently. A trading institution recently reviewed the historical trends of gold prices after nine consecutive weeks of gains and concluded that a 20%-40% correction is typical over the next year, with the exception of 1970. Investors should be prepared for a potential multi-month decline of 20%-40% and manage their funds accordingly. However, the long-term bull market logic for gold remains solid. Factors such as the restructuring of the global monetary and credit system, the trend of de-dollarization, continued gold purchases by central banks, and structural imbalances in supply and demand constitute the core support for gold's rise.
This view also aligns with the forecasts of many international investment banks for gold prices next year. This year's insane rally is undoubtedly unsustainable. The simple reason is that there is no such thing as a stock that only rises and never falls in the trading market.
As for the future market trend, I personally believe that after the rebound, gold will fall below 4000 points, perhaps even back to the 3750-3850 range. This would be a very good place to buy the dip. It also represents the 50% and 61.8% golden ratios of the upward trend from the August low of around 3311. Furthermore, 4000 points is a key psychological support level for retail traders; a break below this level would prompt many undecided traders to exit.
For today's trading, follow a sideways range, selling high and buying low. Focus on the upper resistance levels of 4160/4185 and the lower support levels of 4065/4015.
BUY: 4065 near
BUY: 4015 near
SELL: 4160 near
SELL: 4185 near
More Analysis →

short-term GOLD analysis🟡 Pattern Observed: Bullish Harmonic Formation (Potential Gartley/Deep Crab Variant)
The chart shows a completed harmonic reversal zone around point D, with a clear five-point structure (X-A-B-C-D).
This pattern indicates exhaustion of the prior down-leg and signals a potential bullish reversal in the short term.
📈 Bullish Projection
Immediate Reaction Zone: ₹ 4 020 – ₹ 4 030
Short-Term Upside Targets:
₹ 4 110 – ₹ 4 130 – initial profit-booking zone (previous minor swing).
₹ 4 170 – ₹ 4 190 – main harmonic target.
Extended Target (if momentum expands): ₹ 4 240 – ₹ 4 260.
Momentum oscillators are expected to turn upward from oversold regions once D is validated.
⚠️ Invalidation / Risk
Invalidation: A daily close below ₹ 4 000 (≈ below point X) negates the bullish setup.
Stop-loss Zone: ₹ 3 985 – ₹ 3 995 for traders.
Probability of Reversal: ≈ 70 % based on harmonic symmetry and candle positioning.
🧠 Summary
Parameter Observation
Pattern Type Bullish Harmonic (Gartley/Deep Crab)
Reversal Zone (PRZ) ₹ 4 000 – ₹ 4 030
Trend Expectation Short-term rebound
Targets ₹ 4 110 → ₹ 4 190 → ₹ 4 250
Stop-loss Below ₹ 4 000
Bias Bullish
Confidence ~70 %
📊 Conclusion
Gold appears to be completing a harmonic reversal zone near ₹ 4 000, signaling a short-term recovery phase.
A sustained bounce above ₹ 4 050 will confirm reversal strength, with potential for a ₹ 150–200 up-move.
Traders should stay long with tight risk management, watching for follow-through candles.
Disclaimer:
This analysis is for educational purposes only and does not constitute financial advice. Always use appropriate risk controls and confirm setups with your own system before trading.

XAUUSD – Bearish Pressure After Historical HighsGold prices continue to experience significant downward pressure as profit-taking surges after a strong rally. From the historical peak of nearly 4,400 USD/ounce, gold has lost nearly 12 million VND per tael , and is at risk of falling further if the 4,000 USD/ounce level cannot hold.
On the H4 chart, XAUUSD is forming a bearish trend with a clear price structure. Gold is facing a downward trendline , and each recovery from the lows encounters strong selling pressure . Currently, the price is hovering around 3,935 USD, near the support zone at 3,990 USD, and could drop further to 3,750 USD if this level fails to hold.
Key factors affecting the price:
USD recovery: The strengthening of the US dollar and rising US Treasury yields have reduced gold's appeal, as it does not yield interest.
Increased risk appetite: Progress in US-China trade talks is drawing funds towards equities and industrial commodities.
Trading Strategy: Sell gold around 4,000 USD, with a target of 3,750 USD, and stop loss above 4,050 USD.
Conclusion: XAUUSD remains in a mild bearish trend, with further downside potential if the 4,000 USD level is broken.

Gold 1H – Can Gold Hold Above 4247 as Powell Takes the Stage?XAUUSD – Intraday Trading Plan | by Ryan_TitanTrader
📈 Market Context
Gold holds firm near $4,230, with traders cautiously awaiting U.S. Retail Sales data and Fed Chair Powell’s remarks later today.
After a series of softer inflation reports, market sentiment has tilted mildly dovish — yet the U.S. dollar remains steady as investors hesitate to price in early rate cuts.
The Fed’s tone today will be critical: a hawkish Powell could trigger short-term profit-taking on gold, while any dovish signals may reignite safe-haven bids.
Expect choppy intraday movement with liquidity sweeps around key zones before a confirmed directional move emerges.
🔎 Technical Analysis (1H / SMC Style)
• The structure remains bullish, confirmed by previous Breaks of Structure (BOS) and a Change of Character (ChoCH) earlier in the week.
• Price is now approaching a premium supply zone at 4247–4249, where potential short-term sell reactions could appear before retracement.
• Below, the discount demand zone at 4184–4186 aligns with prior BOS support and acts as a high-probability reaccumulation area.
• If price revisits the buy zone and forms bullish confirmation on M15, continuation toward new highs around 4260+ is favored.
🔴 Sell Setup: 4247 – 4249
SL: 4255 – 4257
TP targets: 4210 → 4195
🟢 Buy Setup: 4184 – 4186
SL: 4174
TP targets: 4210 → 4245 → 4260+
⚠️ Risk Management Tips
• Wait for M15 BOS/ChoCH confirmation before executing either setup.
• Watch for volatility spikes around Powell’s speech and U.S. Retail Sales release — spreads may widen.
• Consider partial profits at intra-day liquidity points and trail stops once structure confirms.
✅ Summary
XAUUSD maintains its bullish structure but may face a liquidity sweep above 4247–4249 before a deeper retracement into 4184–4186.
Institutional activity could drive accumulation near the discount zone if macro data supports dovish sentiment.
The intraday bias remains “Buy the Dip”, with tactical sells possible at premium resistance for short-term scalps.

Gold Rebounds From Demand zone- Bulls Eye 4500$ Target Technical Analysis (1H Chart)
Structure:
Gold remains in a strong ascending channel, with price consistently respecting both the upper and lower trendlines.
The lower black trendline (marked by blue arrows) has acted as a dynamic support multiple times.
The upper black line is serving as a trendline resistance, with potential rejection zones near $4,550–$4,560.
Current Pattern:
Inside the main channel, a smaller parallel structure (rising wedge/inner channel) is forming — showing potential accumulation or continuation within the trend.
This usually precedes a breakout move toward the upper zone of the larger channel.
Key Levels:
Support: $4,200 – $4,220 (Major support zone)**
Current Support Zone: Around $4,250 (near trendline confluence and previous rejections)
Resistance: $4,455 – $4,560 (target zone / channel top)**
Technical Bias:
✅ Bullish above $4,200 support
❌ Bearish breakdown below $4,200 may open room to $4,100–$4,050
💹 Price Action View
Triple rejection from the midline shows short-term liquidity grabs before continuation.
Each rejection was followed by higher lows, showing buyers’ defense (sign of demand zone creation).
The blue arrows represent areas where price tapped liquidity and rebalanced inefficiencies — typical of smart money retracements before continuation.
Next expected move:
Price may:
Tap once more near $4,250 (liquidity sweep of recent lows)
Then rally toward $4,450–$4,550
🧭 SMC (Smart Money Concept)
Liquidity & Demand Zones:
Liquidity below $4,250 (equal lows)
Demand Zone: $4,200–$4,240 → ideal institutional entry
Imbalance/FVG: Between $4,300–$4,360, which price may fill before next push
Market Structure:
Higher Highs & Higher Lows intact (bullish structure)
Internal BOS (Break of Structure) on minor pullbacks confirms healthy trend
Expectation: Re accumulation phase → move to premium zone (above $4,500)
SMC Setup Idea:
Wait for liquidity sweep at $4,250
Entry: On bullish BOS on lower TF (M15–M30)
TP1: $4,400
TP2: $4,550
SL: Below $4,200

Continuation of downtrendI believe we will see a continuation of a downtrend to 3800-3500 before we consolidate for another higher run.
FOMC soon and signs show inflation is higher than expected - additional rate cuts may not happen. Market priced in 25bps so it will be a sell the news

GOLD FREE SIGNAL|LONG|
✅XAUUSD Price has reached the key demand zone where institutional buyers are likely accumulating. The market structure suggests a potential rebound toward 4,160$, with momentum favoring a bullish continuation after this reaction zone holds. Time Frame 2H.
—————————
Entry: 4,115$
Stop Loss: 4,079$
Take Profit: 4,160$
Time Frame: 2H
—————————
LONG🚀
✅Like and subscribe to never miss a new idea!✅

Xauusd good for usGold is showing a notable correction in the last 24 hours. The price dropped from the 4,370 peak, breaking below the EMA 50 (yellow line) and the middle Bollinger Band – signaling that the short-term uptrend is losing momentum.
RSI (7) is hovering around 35–40, approaching the oversold zone. Meanwhile, the volume bars show a clear increase during the red candles, indicating that this move is not just a pause, but a short-term profit-taking phase.
Support is located near 4,200, while 4,260–4,280 now acts as a strong resistance zone.
If RSI dips below 30, we could see an extension toward the 4,100–4,050 area.
However, if buyers step in and price closes above 4,260 again, a new attempt toward 4,350 is likely.
From a broader perspective, the structure remains positive.
The 4,100–4,050 range could become a new medium-term accumulation zone for patient investors.
📊 Summary:
• Short-term correction pressure continues.
• Below 4,200, eyes on 4,100.
• Above 4,260, the recovery could extend to 4,350.
Gold may look calm for now, but this calmness often precedes major moves.
In the next update, we will explore how this setup connects with DXY strength and US yields.

Gold Buy Limit on SupportGold is about to test its support... Let's take a 1:1 Buy-Limit trade here.

Gold Compresses Before the Fed Storm– Sideways or a Sudden Drop?Good day, fellow traders,
Looking at the current XAUUSD chart, this is truly a highly sensitive phase. After last week’s sharp decline, gold has been narrowing its range within a contracting triangle pattern on the 4-hour timeframe, with lower highs and higher lows — a clear sign that the market is “building pressure” before a potential breakout.
At the moment, price is hovering around 4,070 USD/oz, just below the EMA34 and EMA89 lines — indicating that sellers still hold a slight upper hand. The key support zone lies around 4,040, while the strong resistance level sits near 4,220, where a bearish reaction could occur if price retests that zone.
Combining this with the latest news — the USD continues to strengthen while the market awaits the upcoming FOMC meeting — I lean toward a sideways-to-slightly-bearish scenario over the next 24 hours. Price could fluctuate between 4,060–4,100, then drift lower to retest 4,040 or even 3,950, unless the Fed delivers an unexpectedly dovish tone.
In summary, XAUUSD is in a compression phase , awaiting a major catalyst. Without fresh bullish factors, the short-term trend remains sideways-bearish, with mild downside risk before any potential technical rebound.

XAU/USD🪙Gold dropped over 6% on October 21 due to profit-taking and a stronger dollar, but this pullback is healthy after a 60% rally in 2025. At $4,050, the market is likely executing a liquidity grab before resuming its bullish trend toward new highs.🪙
---
📈 Gold Trade Idea – Liquidity Grab Before New Highs📈
Gold experienced a sharp correction on October 21, falling over 6% from its all-time high of $4,382 to around $4,100, marking its largest single-day drop since 2013. This move was driven by profit-taking after an extraordinary rally, alongside a stronger US dollar, improved risk sentiment, and optimism over US-China trade talks.
Despite the volatility, this pullback is not a trend reversal—it’s a healthy correction following a 60% surge in gold prices this year, fueled by economic uncertainty, central bank accumulation, and expectations of interest rate cuts.
Currently, gold is trading around $4,050, a key zone where I anticipate a liquidity grab. This level likely holds clustered stop-losses from late buyers and short-term traders. Once this liquidity is absorbed, I expect gold to resume its bullish momentum, targeting new highs above $4,400.
### 🔍 Why Gold Is Still Bullish:
- Macro uncertainty remains elevated, keeping demand for safe-haven assets strong.
- Central banks continue to accumulate gold, supporting long-term demand.
- Rate cut expectations from the Fed and other central banks reduce opportunity cost for holding gold.
- Technical structure shows a classic retracement after a parabolic move—ideal for continuation setups.
This correction is a textbook example of market mechanics: after a euphoric rally, the market shakes out weak hands before continuing higher. I’m watching for confirmation of support around $4,050 and signs of absorption before entering long.

SMART MONEY CONCEPT (SMC)🚀 Technical Analysis – XAU/USD (15m, SMC)
The market swept sell-side liquidity 💧, triggering SL before showing a potential Change of Character (ChoCh) 🔄.
The key area is the 1H Order Block (4,052) 📍, where we expect a rejection ✅ after the fake out.
✨ Setup:
• 📌 Entry: 4,052
• 🛑 SL: 3,984
• 🎯 TP: 4,270
• 📈 R/R: 1:3
💡 This move follows the institutional narrative: Accumulation → Fake Out → Mitigation → Bullish Distribution.
🔥 Motivational message:
“Remember trader: institutions hunt liquidity before revealing the true move. Stay patient, trust your setup, and let the market work for you.
GOOD LUCK TRADERS… 🔥 🙌

Gold — Preparing for an upward move after 2H rejectionBased on the failure to break the 2-hour resistance, we expect the price to start a new bullish move from the highlighted zone, aiming to break the 4-hour high.
This setup offers an attractive 1:5 risk-to-reward ratio, making it a promising and relatively reliable opportunity according to the current chart structure.
As always — stay patient, follow your plan, and trust your analysis.

Gold is showing a clear Head & Shoulders structure forming on th
🔹 Price is currently testing the neckline zone around 4110 – 4120
🔹 A potential retest of this area could trigger the next big move
🔹 If rejection happens, we could see a drop toward the Weekly Support (4013)
🔹 A deeper bearish continuation may extend toward the Monthly Support (3877)
However — if bulls manage to break above the neckline, expect a sharp move back toward 4320–4350 resistance zone 🔥
🎯 Key Levels:
Neckline: 4110 – 4120
Weekly Support: 4013
Monthly Support: 3877
Resistance: 4320 – 4350
💬 Comment your bias below – Bullish or Bearish? 👇
#XAUUSD #GoldAnalysis #ForexTrading #TechnicalAnalysis #StressFreeTrading

yesterday i predict about Gold if bearish side 3960yesterday i predict about Gold if bearish side 3960

GOLD (XAUUSD) Technical Outlook - 15 Min Chart
Gold is currently showing sideways to bearish momentum after facing strong resistance near the R1–R2 zone (≈ 4095–4110). The price is consolidating just above S1 support (≈ 4070) after testing the PDL (Previous Day Low) multiple times.
📊 Key Observations:
EMA ribbons indicate bearish pressure, with candles trading below short-term EMAs.
Price failed to hold above the previous day’s high (PDH), suggesting sellers are active near 4090–4100.
Strong support lies around 4060–4050 (S1–S2 zone) — a breakdown below this level could open the door toward 4030.
RSI likely hovering near the neutral zone, showing indecision before the next move.

Simple short to buy into Just a simple short to 4000, from this bear flag, which is a good psychological level then a continued push up.
Still in a clear bull run on 4H,D,W etc
Abit new so any bigger thought/idea would be appreciated ☺️

GOLD (XAUUSD) — Market Sitting Below 3,980… What’s Next?Gold finally filled the Daily Fair Value Gaps below and we’re now sitting around 3,976 after a heavy pullback. Trend is still bullish overall, this looks like a normal correction after that vertical move up.
I’m watching the current Daily FVG support between 3,950 – 3,980.
If buyers defend this area → I’m looking for long entries.
Buy Plan (Only if we see bullish reaction):
• Entry zone: 3950 – 3980
• TP1: 4050 (small bounce liquidity)
• TP2: 4150 (upper FVG)
• TP3: 4250 if momentum is strong
• SL: below 3930 (clean invalidation)
Bearish invalidation:
If 3,930 breaks and closes below FVG → gold likely continues down to 3,880 next demand area .

gold is not gold nowevery thing is clearon chart
gold will fall down in next 6 month to 3800 and then 3400
we will see this
not a good situation for holders

[XAUUSD] Market OutlookThe previous Market Outlook is still valid.
In the current situation, we could see a liquidity grab before a reversal .
Otherwise, it would be nice to see the price reach that Daily inefficiency before starting a bullish move.
Wait for chart confirmations such as CHoCH and BoS.
No rush, just patience.

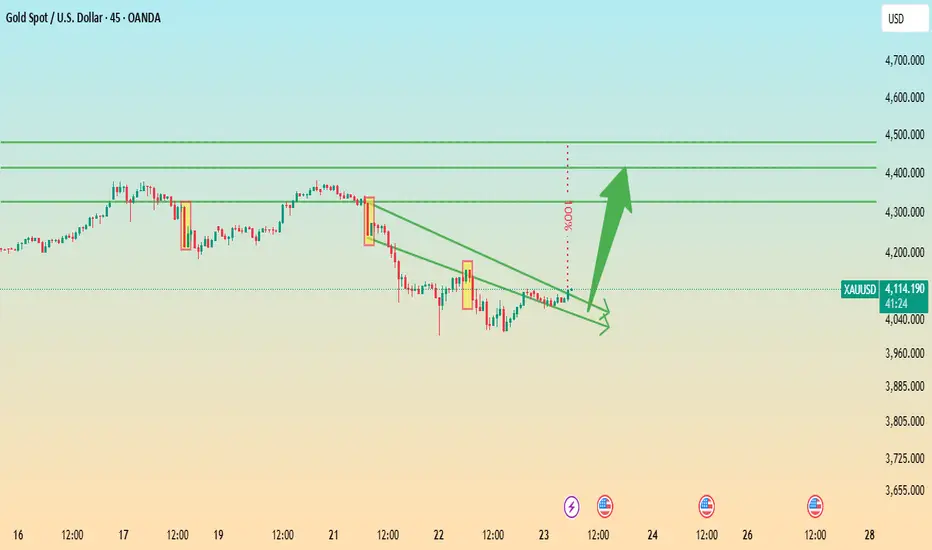
Gold Breakout Potential: Descending Wedge Signals Bullish ReversAnalysis:
The XAU/USD (Gold vs. USD) chart on the 45-minute timeframe shows price action forming a descending wedge pattern, a typically bullish reversal formation. The price has been compressing between lower highs and lower lows but is now testing the upper trendline resistance, indicating a possible breakout.
Key observations:
Trendline Breakout Zone: The narrowing wedge suggests weakening bearish momentum. A confirmed breakout above the trendline could trigger strong upward momentum.
Targets: The projected upside targets are around 4,300, 4,400, and 4,500, aligning with previous resistance zones.
Support Zone: Immediate support remains near 4,050–4,000, where the lower wedge boundary provides buying interest.
Momentum Indicator: Gradual bullish recovery and decreasing downside pressure indicate renewed buyer strength.