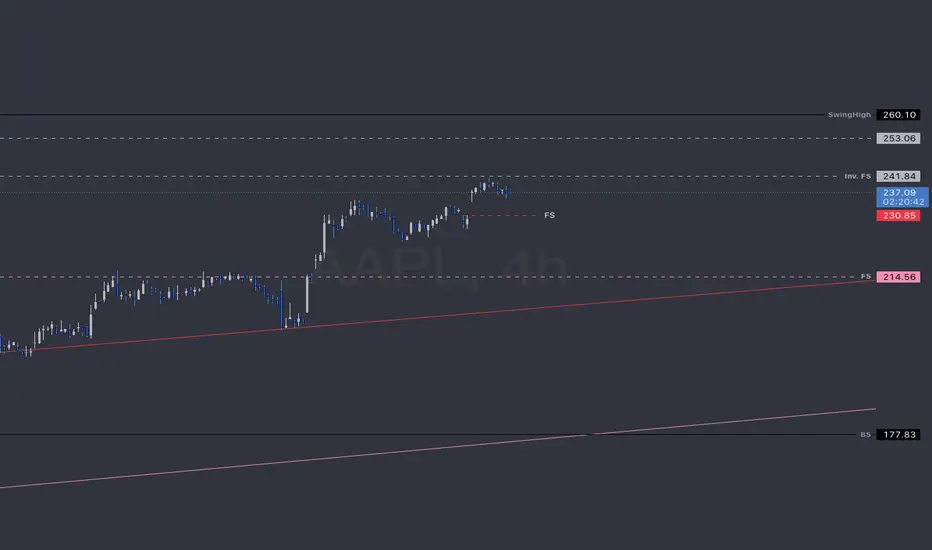
Apple - the last chance to hop on before new ATH?NASDAQ:AAPL Apple formed a mini consolidation pattern, which might be the last stop before the new ATH. The volume profile looks bullish, which is confirmed by the indicators.
With an entry point at 257.30$ and stop loss at 250.30$ a price increase of 8.5% (to 280$) will result in 3RR.
AAPL trade ideas

Drivers of Profits in Emerging Markets1. Introduction to Emerging Markets
Emerging markets are economies experiencing rapid growth and industrialization, typically with increasing integration into the global economy. They are often characterized by:
High growth potential: GDP growth rates exceeding those of developed economies.
Structural transformation: Shifts from agriculture to industry and services.
Market volatility: Exposure to political, economic, and currency fluctuations.
Untapped consumer bases: Large populations with rising income levels.
Profits in emerging markets are driven by unique combinations of internal and external factors, which can differ significantly from developed markets.
2. Macroeconomic Drivers of Profits
Macroeconomic stability and growth are primary drivers of corporate profitability. Key factors include:
2.1 Economic Growth
Strong GDP growth increases demand for goods and services.
Rapid urbanization fuels infrastructure, real estate, and consumer markets.
Industrialization and rising manufacturing output create investment opportunities.
2.2 Inflation and Interest Rates
Moderate inflation encourages consumption and investment.
High inflation can erode profit margins.
Interest rate policies influence borrowing costs for businesses and consumer credit availability.
2.3 Exchange Rates
Currency stability attracts foreign investment and reduces transactional risks.
Depreciation can boost export competitiveness but increase import costs.
Multinational companies must manage currency risk to protect profits.
2.4 Fiscal and Monetary Policies
Government spending on infrastructure, health, and education stimulates economic activity.
Central bank policies controlling money supply affect liquidity and capital availability.
Tax incentives or subsidies for strategic sectors can improve profitability.
3. Market Structure and Competitive Dynamics
The structure of the market significantly impacts profitability:
3.1 Market Concentration
Oligopolistic markets with few competitors often allow for higher profit margins.
Competitive markets encourage innovation but may pressure prices and reduce margins.
3.2 Entry Barriers
Regulatory hurdles, capital requirements, and access to distribution networks influence profitability.
Markets with moderate entry barriers attract strategic investments without saturating demand.
3.3 Informal Sector and Shadow Economy
In many emerging markets, the informal sector constitutes a significant portion of economic activity.
Businesses navigating both formal and informal markets can identify niche opportunities for profit.
4. Sectoral Drivers of Profit
Profitability varies by industry due to sector-specific trends and growth potential:
4.1 Consumer Goods and Retail
Rising middle-class incomes drive consumption of packaged goods, electronics, and luxury items.
Brand loyalty, product differentiation, and pricing strategies are crucial.
4.2 Financial Services
Expanding access to banking, microfinance, and digital payments increases revenue potential.
Fintech innovations reduce costs and widen customer reach.
4.3 Infrastructure and Real Estate
Rapid urbanization fuels demand for housing, roads, and utilities.
Public-private partnerships and government investment in infrastructure enhance returns.
4.4 Technology and Telecommunications
High mobile penetration and digital adoption create opportunities in software, e-commerce, and telecom.
Profit margins are driven by scalability and network effects.
4.5 Natural Resources and Commodities
Emerging markets often have abundant natural resources, making mining, oil, and agriculture lucrative sectors.
Global commodity prices and extraction costs determine profitability.
5. Consumer Behavior and Demographics
5.1 Rising Middle Class
Increasing disposable income drives demand for consumer goods, services, and entertainment.
Businesses can profit by targeting evolving lifestyles and preferences.
5.2 Youth Population
A large, young population accelerates adoption of technology, fashion, and social trends.
Marketing strategies tailored to digital-native audiences enhance revenue potential.
5.3 Urbanization
Migration to cities boosts consumption of housing, retail, transport, and healthcare services.
Urban demand patterns create profitable business clusters.
6. Innovation and Technology Adoption
6.1 Digital Transformation
Mobile banking, e-commerce, and online platforms expand market reach.
Technology reduces operational costs and increases efficiency.
6.2 Product and Service Innovation
Companies introducing affordable, locally tailored products often achieve higher profitability.
Innovations in supply chain, logistics, and payment solutions enable scalability.
6.3 Automation and Efficiency
Adopting modern manufacturing, AI, and logistics technologies reduces production costs.
Operational efficiency directly translates into improved profit margins.
7. Government Policies and Regulatory Environment
7.1 Regulatory Reforms
Simplified business registration, reduced tariffs, and foreign investment liberalization enhance profitability.
Clear legal frameworks protect intellectual property and contracts.
7.2 Tax Incentives and Subsidies
Sector-specific incentives (e.g., renewable energy, manufacturing) lower operational costs.
Export incentives improve competitiveness in global markets.
7.3 Trade Policies
Trade agreements and preferential tariffs facilitate exports.
Regulatory alignment with global standards attracts multinational partnerships.
8. Globalization and Foreign Investment
8.1 Foreign Direct Investment (FDI)
FDI brings capital, technology, and managerial expertise.
Joint ventures with foreign firms often lead to higher profitability.
8.2 Access to Global Markets
Emerging markets integrated into global supply chains benefit from export-driven profits.
Access to international brands and technology enhances competitiveness.
8.3 Remittances
Inflows from diaspora populations increase domestic consumption, driving profits in consumer sectors.
9. Risk Management and Profit Sustainability
Profitability in emerging markets requires managing inherent risks:
9.1 Political and Regulatory Risk
Political instability, policy reversals, and corruption can disrupt operations.
Companies employing local partnerships and risk mitigation strategies sustain profitability.
9.2 Currency and Inflation Risk
Hedging against currency depreciation protects international revenues.
Pricing strategies adjusted for inflation safeguard margins.
9.3 Operational and Supply Chain Risk
Robust supply chains and logistics networks reduce operational costs.
Local sourcing and diversified suppliers enhance resilience and profitability.
10. Sustainability and ESG Considerations
Environmental, social, and governance (ESG) practices increasingly influence profitability.
Companies adopting sustainable practices gain long-term market trust and access to global investors.
Renewable energy projects, sustainable agriculture, and ethical manufacturing often yield competitive returns.
11. Case Studies and Examples
India: Rapid growth of fintech and e-commerce driven by a young, tech-savvy population.
Vietnam: Manufacturing and exports of electronics and garments have created high-margin business opportunities.
Brazil: Agricultural exports and natural resources remain major profit drivers, influenced by global commodity prices.
Nigeria: Telecommunications and mobile payment services have seen exponential growth due to rising urbanization and digital adoption.
12. Conclusion
Profits in emerging markets are driven by a complex interplay of macroeconomic growth, market dynamics, sector-specific trends, consumer behavior, innovation, regulatory frameworks, and global integration. While opportunities are substantial, businesses must navigate volatility, political risks, and operational challenges to sustain profitability. Strategic investments, technological adaptation, and understanding local market nuances are crucial for capitalizing on the growth potential of emerging markets.
Apple - Long -290Apple has shown the potential to hit the levels of 290.
The price might see the levels of 230 or even 205 before moving the higher levels.

Apple📊 NASDAQ:AAPL Weekly Chart – Sept 27, 2025
Apple trading at $255.46, just below recent highs of $259.18
Momentum is strong, but approaching major resistance 👇
🔴 Key Resistance Zones:
$259–$265 → Top of ascending channel
$248–$242 → Previous multi-top rejections (watch for seller pressure)
🟢 Support Levels to Watch:
$232 / $223 / $219 → Recent demand zone with bullish bounces
$207 → Key level, last strong breakout base
$184 → High-conviction support + long-term trendline area
Deeper: $168 / $154 / $145 = macro support zones
⚠️ A breakout above $259 could trigger new ATH push
✅ Holding above $232 keeps trend healthy
📉 Losing $207 opens risk of deeper correction
#AAPL #Apple #Stocks #TechnicalAnalysis #Investing #NASDAQ #Charting

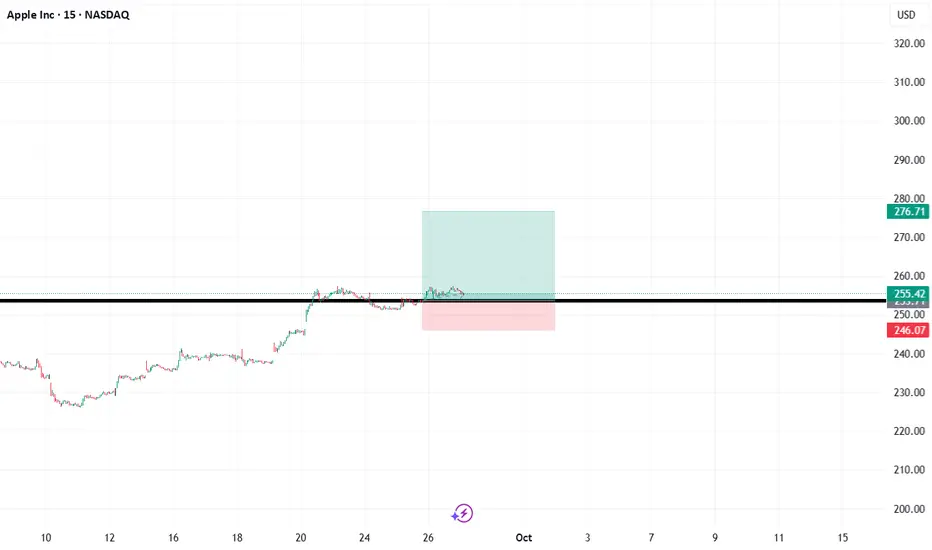
AAPL - Bullish Breakout and Retest SetupHello fellow traders,
This is a technical analysis of Apple Inc. (AAPL) on the 15-minute chart.
As we can see from the price action, AAPL has recently broken through a key horizontal resistance level at approximately $255.42. Following the breakout, the price is now consolidating above this level, which is a classic sign of a potential resistance-turned-support retest.
This "breakout and retest" is a common bullish pattern that could signal further upward movement. Based on the long position tool drawn on the chart, here is a potential trade setup:
Entry: Around the new support level of $255.42.
Stop Loss: A stop loss could be placed at $246.07, below the recent price structure, to manage potential downside risk if the support level fails to hold.
Take Profit: The potential target for this trade is set at $276.71.
This setup provides a risk-to-reward ratio of approximately 2.28 to 1.
Disclaimer: This is for educational purposes only and represents a technical viewpoint. It is not financial advice. Please do your own research and manage your risk appropriately before entering any trade.
Surpassing 100.00% expansion, Apple continue to rage on NASDAQ:AAPL upside remains strong and is likely to continue higher as the stock has surpassed the 100.00% expansion, implying that the upside may enter into an impulse wave. Near-term target could see 260.64 (123.6%) expansion level being met. Major target is at 285.00. Key support is at 241.00
This is an update on Apple on 7th Aug 2025

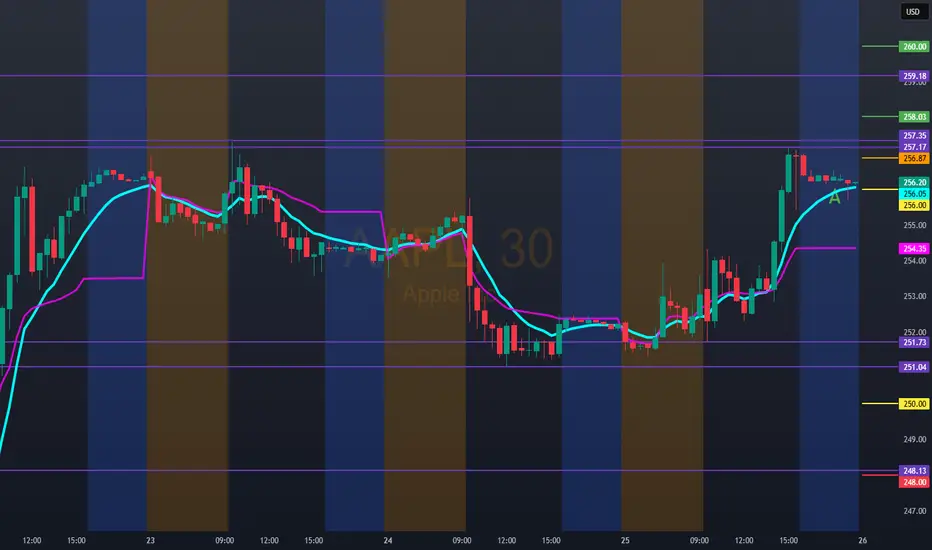
Hello trader, for tomorrow, AAPL 256.87Bullish entry 258.00/260.00, stop below vwap.
Technical bearish entry below 256.00, possible down to the 252.00/250.00 area. 256.00 could also act as a rebound zone, forming a bearish rejection candle.
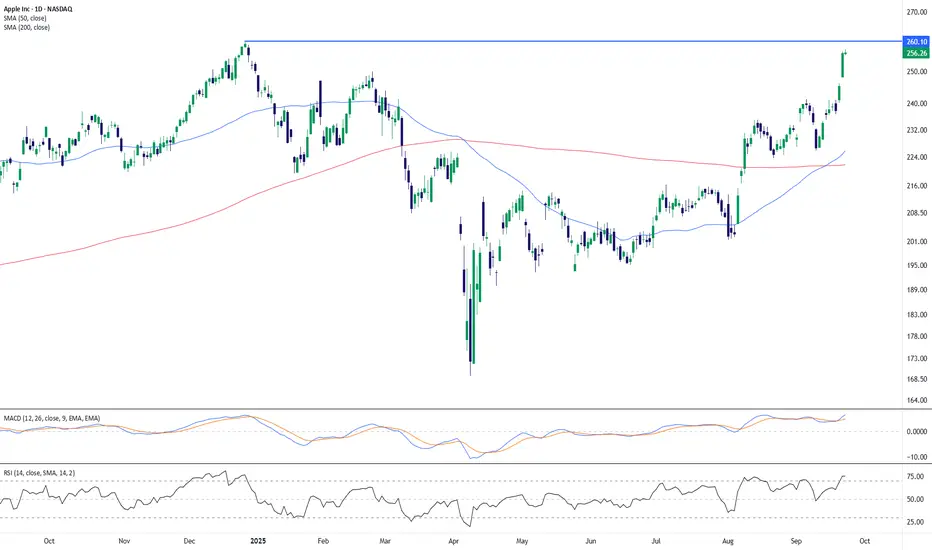
AAPL Approaches Key Resistance After Strong RallyApple’s share price has staged a sharp rebound in recent weeks, climbing above both the 50-day (225.78) and 200-day SMA (221.80). The sustained move higher has carried price into the 256–260 zone, where it is now testing a major horizontal resistance level established earlier this year.
Momentum indicators reflect the strength of the rally but also highlight stretched conditions. The RSI sits at 75, signaling overbought territory, while the MACD remains firmly above its signal line, showing ongoing bullish momentum. These readings suggest strong buying pressure, though the risk of a pause or pullback near resistance should not be overlooked.
A confirmed breakout above 260 would mark a significant technical shift, potentially resuming the broader uptrend, while failure to clear this level could see consolidation or a retracement back toward the short-term moving averages.
-MW
APPLE Buyers In Panic! SELL!
My dear subscribers,
APPLE looks like it will make a good move, and here are the details:
The market is trading on 245.18 pivot level.
Bias - Bearish
My Stop Loss - 247.18
Technical Indicators: Both Super Trend & Pivot HL indicate a highly probable Bearish continuation.
Target - 241.25
About Used Indicators:
The average true range (ATR) plays an important role in 'Supertrend' as the indicator uses ATR to calculate its value. The ATR indicator signals the degree of price volatility.
Disclosure: I am part of Trade Nation's Influencer program and receive a monthly fee for using their TradingView charts in my analysis.
———————————
WISH YOU ALL LUCK

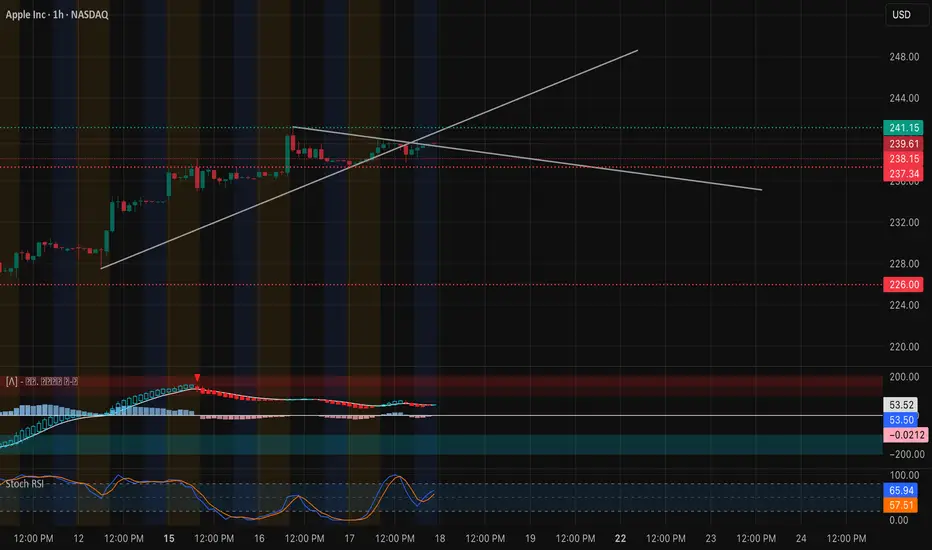
AAPL Holding Uptrend – Sept 18 Trade Setup🍏 Here’s my latest desk-style breakdown for Apple heading into Wednesday, built from the 1-hour chart and GEX option data.
1️⃣ Price Action & Market Structure
* Steady climb: AAPL continues to respect its rising trendline from last week. After a mild intraday pullback, price is back around $239.6 and hugging the 9 EMA.
* Key pivot zone: $238–239 is the near-term battleground. Holding this keeps the higher-low pattern alive.
* Next resistance: $241.1 (recent high) is the level to beat for a fresh push toward $242.5–245.
2️⃣ GEX (Options Flow) Check
* Call wall magnets: Strong gamma build-ups at $242.5 and $245 can act like upside magnets once $241.1 is taken out.
* Put support: First meaningful put walls lie much lower at $217.5 and $212.5, giving AAPL room to breathe if there’s a dip.
* Low IVR: IVR sits near 12.6 with IVx around 26.1—option premiums are relatively cheap.
3️⃣ Trading Thoughts
* Bullish play: Enter on a confirmed hourly close over $241.1. First target $242.5, stretch to $245. Protective stop under $238.
* Bearish hedge: Only consider a short if AAPL loses $238 on volume. Next downside pocket sits around $235–233.
4️⃣ Option Angles
* Upside: Cheap call spreads like 240/245 offer a defined-risk way to play the breakout.
* Neutral income: Selling puts below $220 makes sense if you expect Apple to keep grinding higher or stay range-bound.
5️⃣ My View
Apple’s chart remains constructive. As long as it keeps closing above $238 on the hourly, dips are buyable. A clean breakout over $241 could invite momentum buyers quickly.
Disclaimer: This analysis is for educational discussion only and is not financial advice. Always do your own research and manage risk before trading.
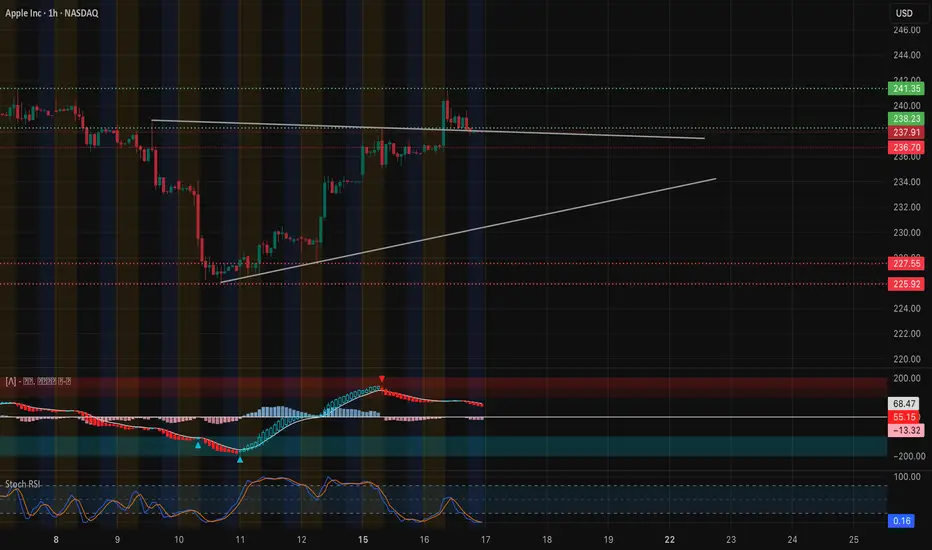
AAPL: Building a Base at 238 – Swing & Scalp Setups for Sept 17 1-Hour Chart Technical View
Apple’s 1-hour chart shows a constructive rebound from the early September selloff. After reclaiming the $236.7–$238.2 zone, price is consolidating beneath $241.3. MACD has eased back toward neutral and Stoch RSI is mid-range, indicating digestion after the recent pop.
* Immediate Support: $237.9–$238.2 (short-term breakout retest)
* Major Support: $236.7 (trend-defining pivot)
* Upside Zone: $241.3–$243.8 is the next key resistance band; a breakout above could open $245–$250
9 EMA remains above the 21 EMA, keeping the micro-trend bullish as long as $236.7 holds.
GEX & Options Flow
Options positioning supports the idea of a slow upward bias:
* Call Walls: $241.3 (highest positive NET GEX / call resistance), $242.5, and $245.
* Put Support: $217.5 is the main deep downside hedge.
* GEX Bias: Modest call concentration at ~6.7% with IVR ~14 (IVx ~26.5), showing lower option demand and relatively quiet volatility pricing.
This suggests market makers are not pricing in a major move but will likely support dips near $236–$238.
Trade Thoughts & Suggestions
* Swing Idea: Enter on dips into $238 with a stop below $236.5, aiming for $241.3–$243.8 and possibly $245–$250 if momentum improves.
* Scalp Idea: Buy quick pullbacks to $238 or play a clean breakout above $241.3 with volume confirmation.
* Bearish Scenario: A decisive break under $236.5 could test $232 and lower.
Quick Take
AAPL is building a steady base just under $241. For Sept 17, holding $238 keeps the bull case intact with $241–$245 as the upside zone to watch.
Disclaimer: This analysis is for educational purposes only and does not constitute financial advice. Always do your own research and manage risk before trading.
AAPL BuyApple (AAPL) often moves quietly but powerfully. Its push into AI will focus on integrating intelligence into consumer devices from the iPhone to Vision Pro making AI seamless in everyday life.

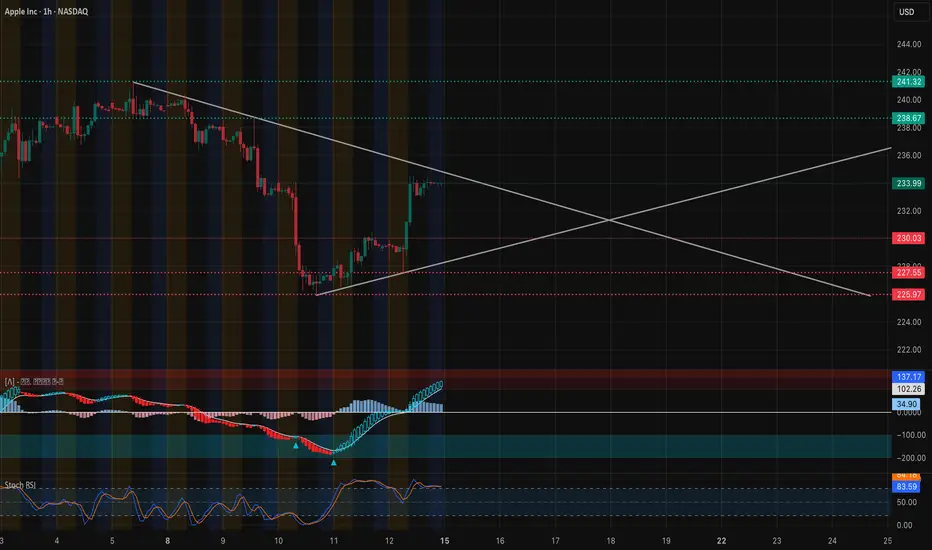
AAPL Watching Key Triangle Break — Trade Levels for September 15
* Macro backdrop: U.S. futures are mixed after last week’s rally, with no major overnight catalysts. Tech remains the driver, but profit-taking is possible after recent gains.
* Sector tone: Large-cap tech is still attracting flows, though traders are selective. Apple is rebounding from a recent sharp drop.
Technical Analysis – AAPL
Trend & Structure (1-Hour Chart)
* Price is forming a symmetrical triangle after bouncing from $226 lows.
* The triangle’s apex is near mid-week, suggesting an imminent breakout.
Key Levels
* Resistance: $235.8 (near-term breakout point), $238.7 (3rd Call Wall), $241.3 (Gamma Wall / major resistance).
* Support: $230.0 (short-term pivot), $227.5 (interim), $225.9 (major support).
Momentum & Indicators
* MACD on 1H is bullish and climbing.
* Stoch RSI is high but not yet diverging—watch for cooling before a move.
* Volume is improving on upward tests, signaling accumulation.
Options/GEX Insight
* Highest positive NETGEX and Call resistance sit near $241.3, aligning with chart resistance.
* IVR 13.1 and IVx avg 25.4 indicate modest volatility and room for expansion if a breakout occurs.
Trade Scenarios for Sept 15
* Bullish Plan:
* Entry: Break and hold above $235.8.
* Targets: $238.7 → $241.3.
* Stop: Below $230.0.
* Bearish/defensive (if triangle breaks down):
* Entry: Break below $230.0.
* Targets: $227.5 → $225.9.
* Stop: Above $235.8.
Summary
Apple enters Monday inside a tightening triangle. A breakout above $235.8 may target $238.7–241.3, while a breakdown below $230 could pull price back to the mid-$220s.
Disclaimer: This analysis is for educational purposes only and does not constitute financial advice. Always do your own research and manage risk before trading.
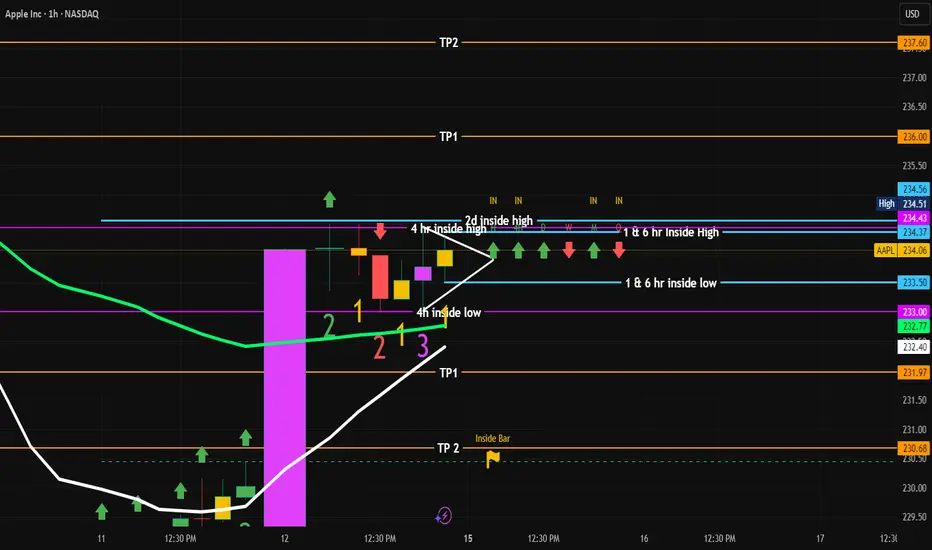
AAPL trade plan on 9/15/25Trade Plan: AAPL (1H + 4H Inside Bars)
🔹 Context
Current price stuck between 1hr/6hr inside bar high (≈234.4) and inside bar low (≈233.5).
Multiple inside bars → compression → expect breakout soon.
Targets (TP1/TP2) are pre-marked above and below.
✅ Entry Triggers
Long Entry:
Buy above 234.5 (clear break of 1H & 4H inside high).
Confirmation: candle closes above 234.5 on 1H timeframe.
Short Entry:
Sell below 233.5 (break of 1H & 4H inside low).
Confirmation: candle closes below 233.5 on 1H timeframe.
🛑 Stop Loss (S/L)
For Longs: just below inside bar low → 233.2.
For Shorts: just above inside bar high → 234.7.
👉 Keeps S/L tight, clear invalidation.
🎯 Take-Profit (TP)
Upside Targets:
TP1 = 236.0
TP2 = 237.6
Downside Targets:
TP1 = 231.9
TP2 = 230.6
🚫 No-Trade Zone
Between 233.5 – 234.5 (the inside bar range).
This is chop city → no edge.
Wait for break + close outside this zone before entering.
⚖️ Risk-Reward
Entry at 234.5 → Stop at 233.2 → Risk ≈ $1.3.
TP1 = 236 → Reward ≈ $1.5 → R:R ≈ 1.15.
TP2 = 237.6 → Reward ≈ $3.1 → R:R ≈ 2.4.
👉 Don’t settle for TP1 only. Hold partial to TP2 for 2:1+ R:R.
🔑 Final Checklist
No trades inside 233.5 – 234.5 box.
Enter only on breakout + close beyond that range.
Hard stop just outside opposite end of range.
Scale out at TP1, hold runner to TP2.
APPLE Set To Fall! SELL!
My dear friends,
APPLE looks like it will make a good move, and here are the details:
The market is trading on 234.05 pivot level.
Bias - Bearish
Technical Indicators: Supper Trend generates a clear short signal while Pivot Point HL is currently determining the overall Bearish trend of the market.
Goal - 230.63
Recommended Stop Loss - 236.05
About Used Indicators:
Pivot points are a great way to identify areas of support and resistance, but they work best when combined with other kinds of technical analysis
Disclosure: I am part of Trade Nation's Influencer program and receive a monthly fee for using their TradingView charts in my analysis.
———————————
WISH YOU ALL LUCK
Apple: Pulling Back, but Uptrend Still IntactApple has recently faced substantial downward pressure, retracing enough to erase the gains made in the first week of September. Our primary outlook is that the stock will soon rebound and, during green wave , rise toward resistance at $260.10. Following a moderate pullback in wave , shares should ultimately break through this level in wave , further advancing the broader upward trend. However, we continue to monitor our 37% likely alternative scenario. In this case, AAPL would have completed beige wave alt.b with its recent peak and could next target a new major low for blue wave alt.(IV) via wave alt.c . Here, the price would fall below support at $201.50 but ideally rebound above the lower mark at $168.

AAPL – Pullback Setup After Keynote-Induced DipMy original post was hidden due to a house rule violation, but I’m sharing the setup again here:
Apple’s stock dropped heavily after the recent iPhone 17 / iPhone Air keynote, landing on a key support level that previously aligned with an upside break of structure.
This sharp decline appears to have started an Elliott 5-wave move. Wave 3 has already completed, and I’m now speculating for Wave 4 to develop — which could complete a tight 0.5R setup.
Confluences:
• RSI and MACD both showing divergences at support
• Stochastic oversold, also printing divergence
• Structure remains intact, likely aiming for a retest of the above resistance area
For this setup, a 1 ATR target protected by a 2 ATR stop loss on the 1H timeframe should be enough.
Disclaimer: This idea is for educational purposes only. Please do not place trades solely based on this setup.
Apple Wave Analysis – 10 September 2025- Apple broke daily Rising Wedge
- Likely to fall to support level 225.00
Apple recently reversed from the resistance area between the resistance level 240.00 (which also reversed the price in March) and the upper daily Bollinger Band.
The downward reversal from this resistance area started the active downward correction which then broke the daily Rising Wedge from August.
Apple can be expected to fall further toward the next support level 225.00 (low of the previous correction 2 from August).
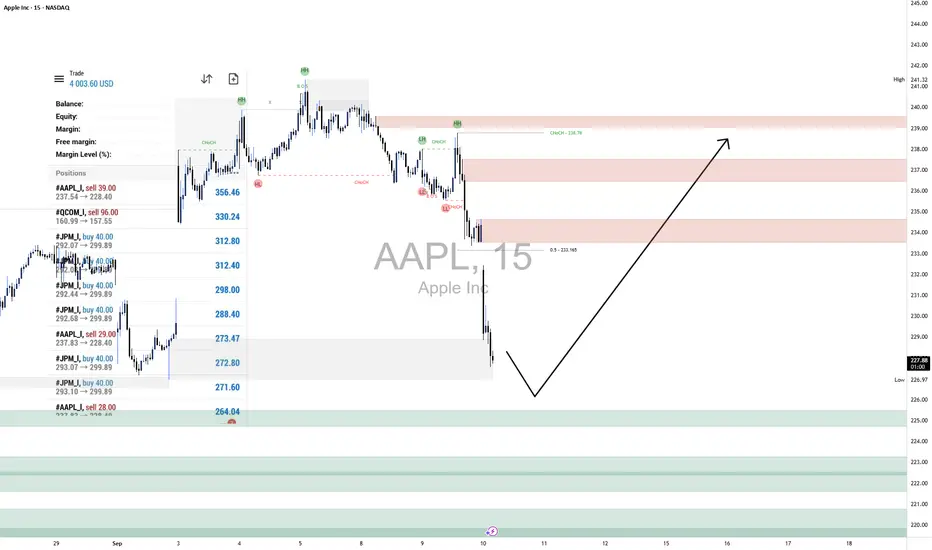
AAPL LongOn AAPL (15m), the broader market structure has shifted bearish after multiple CHoCH signals near 239–238 and a decisive Break of Structure (BOS) around 236, which confirms sellers have taken control following the rejection from the recent swing high at 241.02. The rapid downside move into the current session suggests continuation pressure, but a short-term corrective rally remains possible if demand levels hold.
The supply zones between 233–239 look strong, as price repeatedly failed to hold above them and sold off sharply each time, showing clear seller dominance. The stacked demand levels below 227 down to 220 are important to watch: buyers previously stepped in with strength here, creating impulsive rallies, but their ability to defend these zones again will determine whether a deeper recovery can take place.
Price is now trading at 227.91, extending a sharp leg lower into nearby demand. The marked projection suggests price may attempt a bounce from this area, targeting a corrective move back toward 233–238 supply. If buyers manage to defend current lows and create a bullish reaction, a retracement into those red zones is likely. However, failure to hold above 226.90 would expose lower demand layers toward 224–222.
The current trade bias is bearish, but near-term expectation is for a corrective bullish retracement into supply before sellers look to re-engage. The outlook would be invalidated if price breaks and closes decisively above 239, as that would flip structure back in favor of buyers. Momentum currently favors sellers given the sharp downside drive, but any slowing of bearish candles at demand or the appearance of strong bullish engulfing patterns would support a corrective move higher.
AAPL 1D Time frameCurrent Price & Market Metrics
Current Price: $234.35 USD
Market Cap: $3.01 Trillion
P/E Ratio: 30.28
EPS: $6.59
Beta: 1.15
Volatility: 2.32%
52-Week Range: $139.34 – $200.00 USD
🔎 Technical Indicators
Relative Strength Index (RSI): 67.00 — Neutral
Moving Averages:
5-day: $237.11 — Buy
10-day: $233.72 — Buy
20-day: $231.59 — Buy
50-day: $219.01 — Buy
100-day: $210.66 — Buy
200-day: $220.99 — Buy
Moving Average Convergence Divergence (MACD): 5.61 — Sell
Stochastic Oscillator: 89.58 — Sell
Commodity Channel Index (CCI): 136.25 — Sell
Average True Range (ATR): 4.41
📈 Support & Resistance Levels
Support: $220.11
Resistance: $239.78
📅 Outlook
Bullish Scenario: A breakout above $239.78 could signal a move toward $255.59.
Bearish Scenario: A drop below $220.11 may lead to further downside.
Overall Bias: Neutral to Bullish, with mixed signals from momentum indicators and moving averages.

Apple Shares (AAPL) Fall After iPhone 17 LaunchApple Shares (AAPL) Fall After iPhone 17 Launch
Yesterday, Apple unveiled its new products, including the iPhone 17. The new model features a sleeker form factor, an improved display and battery, and a new processor. However, analysts believe the model lacks the breakthrough impact needed to drive the stock higher.
The charts confirm this: while the main stock indices rose yesterday, AAPL shares fell by around 1.5%.
Technical Analysis of Apple Shares (AAPL)
When analysing the chart six days ago, we:
→ confirmed the upward channel (shown in blue);
→ highlighted the $235 support level;
→ suggested that while AAPL stock could maintain upward momentum, disappointment over the new product launch might trigger a correction.
In addition to the AAPL price action we noted earlier, several bearish signals on the hourly chart support the correction scenario:
→ a long upper shadow (marked with an arrow);
→ aggressive price action when breaking the $235 support;
→ bearish divergences on the RSI indicator.
Bulls might find support at line S, which is part of a fan drawn from the starting point of the bullish impulse on 6 August.
However, if bearish sentiment persists, price action could unfold within the structure shown in red (potentially a bull flag pattern inside the prevailing bullish trend). Bearish pressure could aim to push AAPL shares down towards the median of the red channel.
In that case, bulls may find support in the area where several lines converge:
→ the lower rays of the fan (shown in orange);
→ the psychological $230 level (which has repeatedly switched roles between resistance and support since August);
→ the median of the blue channel;
→ the lower boundary of the bullish gap from 2 September.
This article represents the opinion of the Companies operating under the FXOpen brand only. It is not to be construed as an offer, solicitation, or recommendation with respect to products and services provided by the Companies operating under the FXOpen brand, nor is it to be considered financial advice.
AAPL 4Hour Time frame📊 Apple (AAPL) Snapshot
Current Price: ~$234.35
Day Range: $233.01 – $238.66
Open Price: ~$236.73
Market Cap: ~$3.0 Trillion
P/E Ratio: ~30.3
EPS: ~6.59
🔎 Pivot Levels (Daily Basis → useful for 4H)
Pivot Point: ~$234.6
Resistance:
R1: ~$235.9
R2: ~$238.0
R3: ~$239.2
Support:
S1: ~$232.5
S2: ~$231.3
S3: ~$229.1
📉 Technical Indicators (4-Hour Insight)
RSI: ~40 → weak, leaning bearish.
MACD: Negative → bearish momentum.
Moving Averages: Short-term averages show Sell, long-term still supportive (Buy).
📌 4-Hour Frame Outlook
Momentum: Neutral-to-bearish; price is consolidating around the pivot zone ($234–235).
Bullish Scenario: If AAPL breaks above $238, short-term upside could open toward $239+.
Bearish Scenario: If price slips below $232, risk increases for a move toward $230.
✅ Conclusion: On the 4-hour chart, Apple is in a neutral to bearish phase, with weak momentum. Bulls need a breakout above $238 to take control, while bears may dominate if it breaks under $232.
AAPLChart practice
Levels marked and the timeframe color code:
yearly = black
monthly = pink
weekly = grey
daily = red.
posted on a 4hr chart.