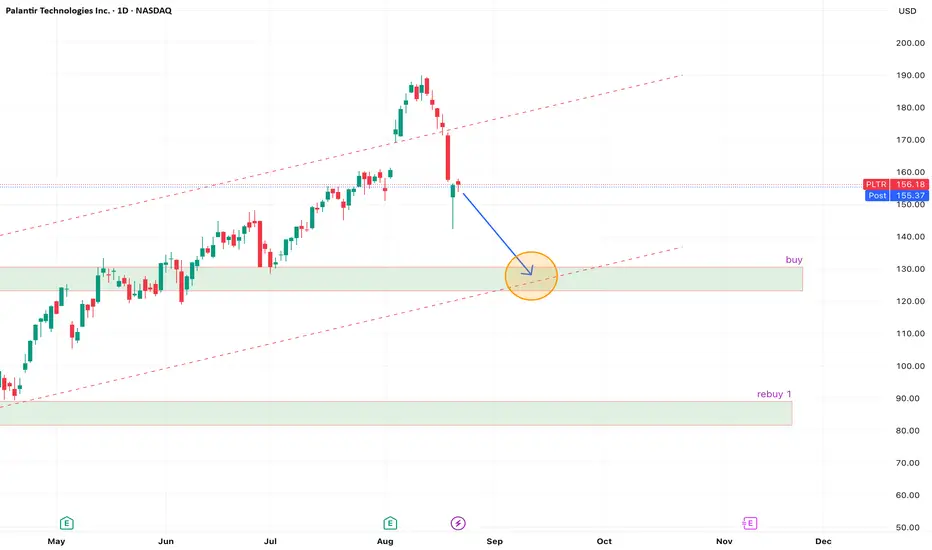
PLTR Pullback in Progress – Eyes on the Reload ZonePLTR looks like it’s in the middle of a healthy pullback after a strong run. I’m watching for it to drift down into the lower trendline and demand zone — that area lines up nicely with previous structure and could offer a clean bounce. If it gets there with decent volume and price action starts to slow, I’ll look to step in. Until then, just letting it come to me — no need to chase. Rebuy zone marked lower in case it really unwinds.
PLTR trade ideas
Risk Builds as Palantir Breaks Multiple Support Levels The shares of Palantir fell by more than 9% on 19 August, on heavy volume. The sharp decline caused significant technical damage to the chart. The uptrend that the stock had been following since July 1 was broken with ease. Meanwhile, the share price fell below the 10-day exponential moving average and the 20-day simple moving average, indicating that a change in trend may be developing.
The lower Bollinger Band is currently at $144.25, while the relative strength index stands at 43.8, indicating the stock is nowhere near oversold and could fall a further 8% before approaching such levels. Moreover, the share price has dropped below a key technical support at $160.50, an area that had previously acted as resistance in the run-up to the company’s results at the end of July.
Based on the chart, there should be firm support for the stock at the lower Bollinger Band around $145, which also coincides with a technical support level formed in late June. If the shares fail to hold that support, the risk is a move back towards $120.
If a change in trend is indeed underway, it will need to be confirmed on the next rally attempt. As long as the stock remains below the falling 10-day exponential moving average and the 20-day simple moving average—both of which should now act as resistance—the path is likely towards much lower levels. However, if the stock manages to break out and rise above those resistance levels, a return to the all-time highs cannot be ruled out.
Written by Michael J. Kramer, founder of Mott Capital Management.
Disclaimer: CMC Markets is an execution-only service provider. The material (whether or not it states any opinions) is for general information purposes only and does not take into account your personal circumstances or objectives. Nothing in this material is (or should be considered to be) financial, investment or other advice on which reliance should be placed.
No opinion given in the material constitutes a recommendation by CMC Markets or the author that any particular investment, security, transaction, or investment strategy is suitable for any specific person. The material has not been prepared in accordance with legal requirements designed to promote the independence of investment research. Although we are not specifically prevented from dealing before providing this material, we do not seek to take advantage of the material prior to its dissemination.
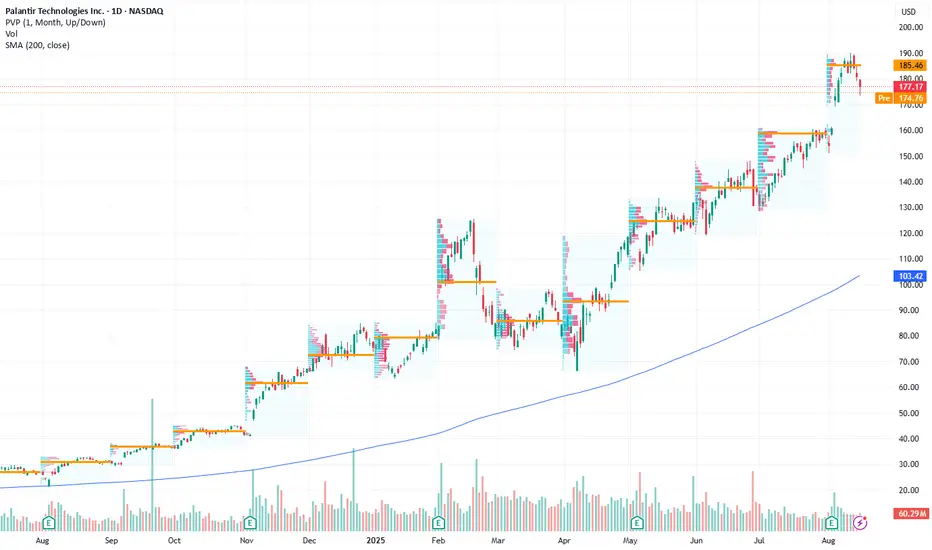
$PLTR TANASDAQ:PLTR Chart Analysis (Aug 2025)
Since November 2024, NASDAQ:PLTR has staged a 370% bull run into mid-August 2025. The advance unfolded as a 13-wave Elliott fractal sequence, but the latest leg shows signs of a corrective phase, confirmed by a break of the verified uptrend line.
Throughout the rally, hidden bullish divergence on the CCI appeared several times, reinforcing continuation, but broader participation weakened as early as December 2024, suggesting underlying exhaustion. Notably, volume patterns showed buying on impulses but also profit-taking on retracements, typical of a maturing rally.
From April 7th, a rising trendline was established, evolving into a rising wedge structure. Multiple retests in June–August held, with hidden bullish divergence on the CCI and repeated interactions with the ±2σ Bollinger Bands, which acted as dynamic support/resistance.
The 5th wave climaxed with an exhaustion gap, coinciding with CCI overextension above +200 and a decisive upper Bollinger Band breakout. This marked unsustainable momentum. The subsequent trendline break on heavy volume, followed by a pin bar on even stronger volume, signals exhaustion and distribution.
The highest-probability scenario now is a retest of the broken trendline from below, where confluence comes from:
1.Expanding volume confirming sellers’ control,
2.Mean reversion tendency back into the Bollinger midline,
3. Elliott structure shifting into corrective mode

PLTR Profit target or shortlast short didnt work out. it held the level and continued after trading sideways for a few weeks. i would like to see it react off this yearly level.

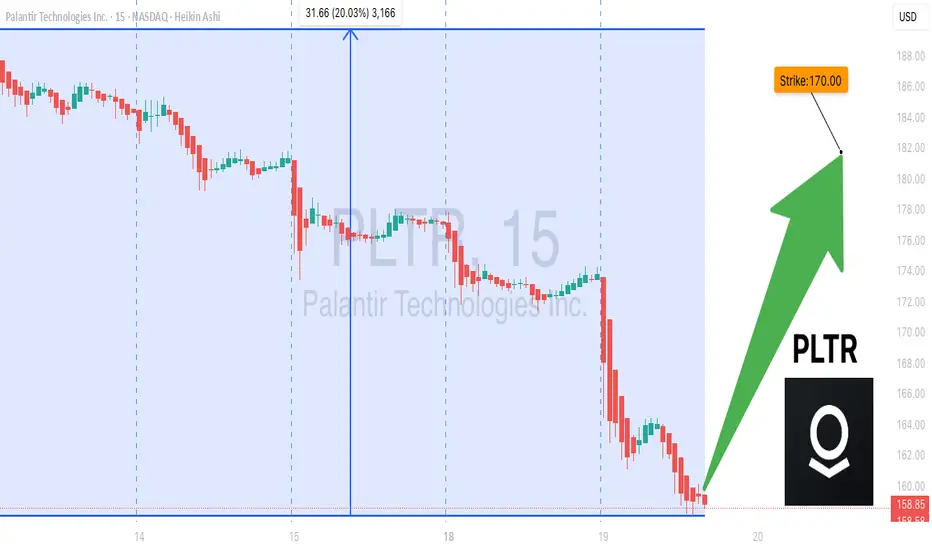
Palantir Technologies (PLTR) Shares Plunge Below $150Palantir Technologies (PLTR) Shares Plunge Below $150
Shares of Palantir Technologies (PLTR), a company specialising in big data analytics software, delivered an unpleasant surprise to investors:
→ just last week, the stock was trading at its all-time high of around $190;
→ yesterday, the price collapsed below $150. At yesterday’s intraday low, PLTR stock had dropped almost 25% from its record peak.
Why Did Palantir Technologies (PLTR) Stock Fall?
Bearish sentiment may have been driven by:
→ capital rotation from risk assets into so-called defensive stocks ahead of the Federal Reserve Chair’s speech at the Jackson Hole Symposium (as we reported yesterday);
→ growing speculation that a “bubble” is forming in the technology sector, which could burst.
According to Investor’s Business Daily, Andrew Left, founder of Citron Research, bet on downside in PLTR, arguing that the stock is severely overvalued following its phenomenal 340% rally in 2024.
Technical Analysis of Palantir Technologies (PLTR) Stock
In our previous analysis of PLTR’s price action, we:
→ identified an ascending channel (shown in blue);
→ suggested that the upcoming earnings release would push the stock towards the upper boundary of this blue channel.
Indeed, the strong earnings report on 5 August acted as a catalyst for the surge (breaking through resistance at $160, as indicated by the arrow) towards the channel’s upper boundary. However, the optimism stemming from these fundamentals was swiftly and completely erased – a highly significant bearish signal.
That said, the bulls still have valid reasons to remain hopeful, as the price:
→ staged a false bearish breakout below the key $145 level, which had previously acted as resistance (and has now flipped into support);
→ closed yesterday’s volatile session above its opening price (forming a dragonfly doji on the daily chart);
→ thus, the blue channel remains valid, with demand showing signs of aggression.
We can assume that the market has undergone a stress test and, after the volatility spike, the price has returned to the prevailing ascending channel, maintaining the uptrend. If so, the bulls will need to prove their resolve by overcoming key resistance levels at $160 and $170 (these mark not only the gap boundaries but also psychological barriers). If successful, PLTR’s price could advance towards the channel’s median line.
This article represents the opinion of the Companies operating under the FXOpen brand only. It is not to be construed as an offer, solicitation, or recommendation with respect to products and services provided by the Companies operating under the FXOpen brand, nor is it to be considered financial advice.
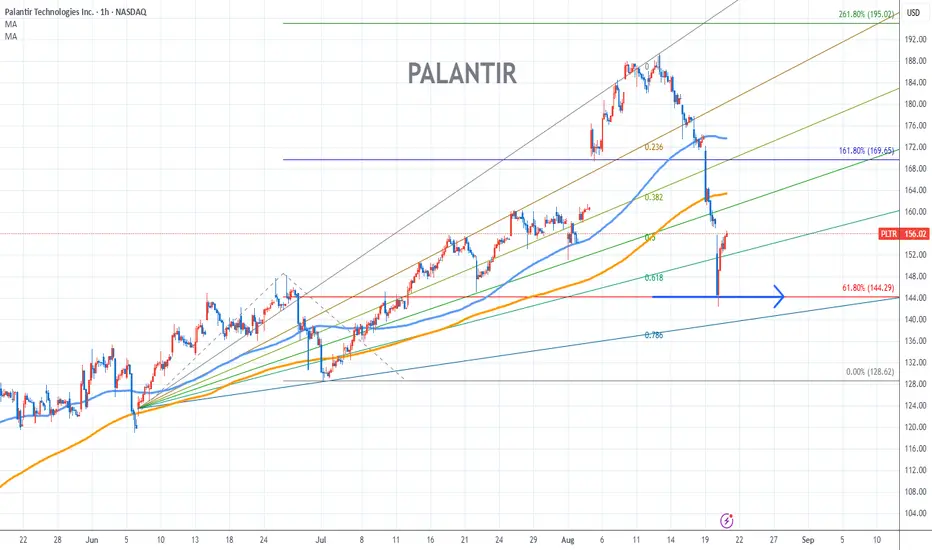
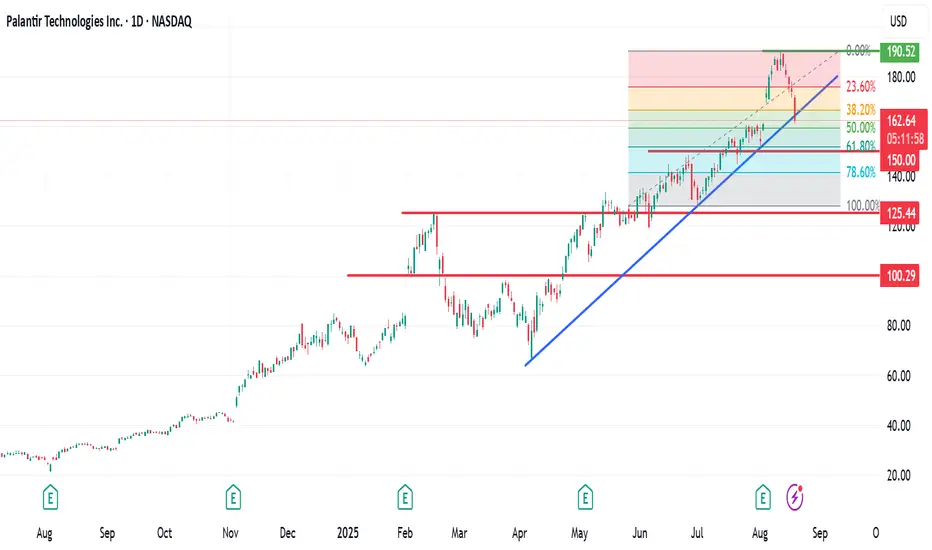
PALANTIR Stock Chart Fibonacci Analysis 082025Trading Idea
1) Find a FIBO slingshot
2) Check FIBO 61.80% level
3) Entry Point > 144/61.80%
Chart time frame:B
A) 15 min(1W-3M)
B) 1 hr(3M-6M)
C) 4 hr(6M-1year)
D) 1 day(1-3years)
Stock progress:C
A) Keep rising over 61.80% resistance
B) 61.80% resistance
C) 61.80% support
D) Hit the bottom
E) Hit the top
Stocks rise as they rise from support and fall from resistance. Our goal is to find a low support point and enter. It can be referred to as buying at the pullback point. The pullback point can be found with a Fibonacci extension of 61.80%. This is a step to find entry level. 1) Find a triangle (Fibonacci Speed Fan Line) that connects the high (resistance) and low (support) points of the stock in progress, where it is continuously expressed as a Slingshot, 2) and create a Fibonacci extension level for the first rising wave from the start point of slingshot pattern.
When the current price goes over 61.80% level , that can be a good entry point, especially if the SMA 100 and 200 curves are gathered together at 61.80%, it is a very good entry point.
As a great help, tradingview provides these Fibonacci speed fan lines and extension levels with ease. So if you use the Fibonacci fan line, the extension level, and the SMA 100/200 curve well, you can find an entry point for the stock market. At least you have to enter at this low point to avoid trading failure, and if you are skilled at entering this low point, with fibonacci6180 technique, your reading skill to chart will be greatly improved.
If you want to do day trading, please set the time frame to 5 minutes or 15 minutes, and you will see many of the low point of rising stocks.
If you want to prefer long term range trading, you can set the time frame to 1 hr or 1 day
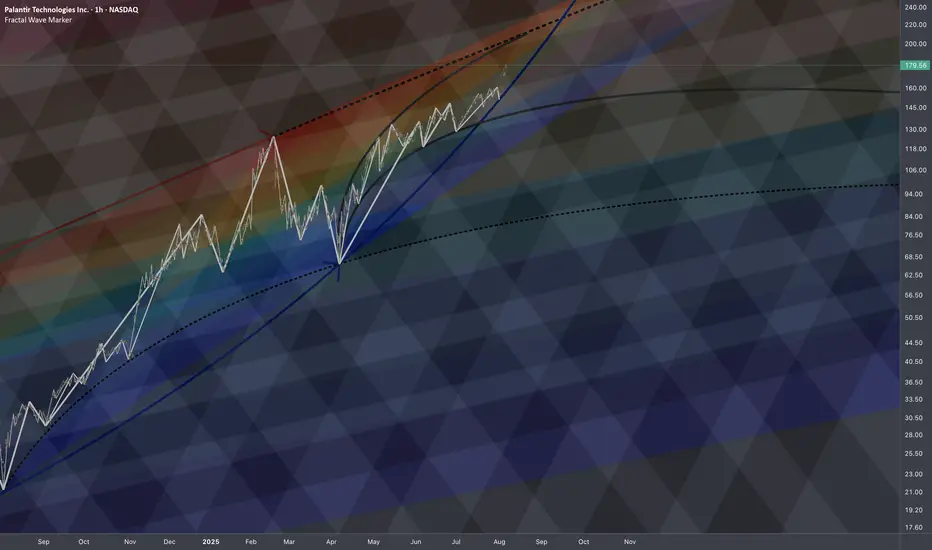
PLTR: Temporal Patterns🏛️ Research Notes
The fact that price touched and reflected up from the curve that mimics exponential growth, forced me to focus on the precursors that could explain the geometry of such decisive move.
Let's strip the chart and document how exactly chronological chain of human emotions were progressing across vast cycles.
Essentially, the composite sub-cycles patterns are the same but stretched towards denser probability point. It's not just percentages that matter, but how it was structured on the way down. Evidently that was enough to trigger exponential growth. (BTW, since that super-bottom price is up 2950%)
So, that force made the time tick differently in the following bigger cycle. Manifests in frequency of reversals of sub-waves and changing scaling laws.
Particular parts of large curves with gradient of last reaction move can be connected to further express how two forces push the price toward some mutual angle.
Publishing interactive chart as low as 1h TF to observe in details.
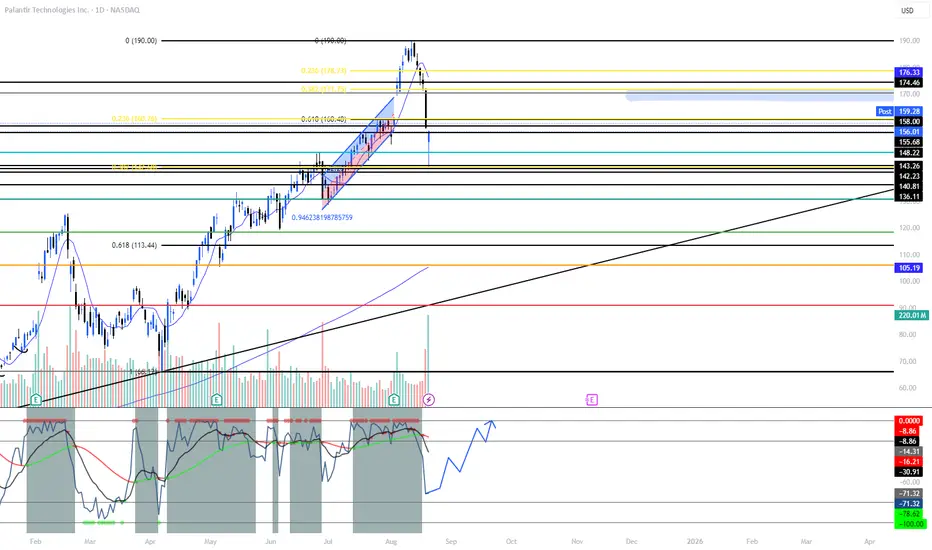
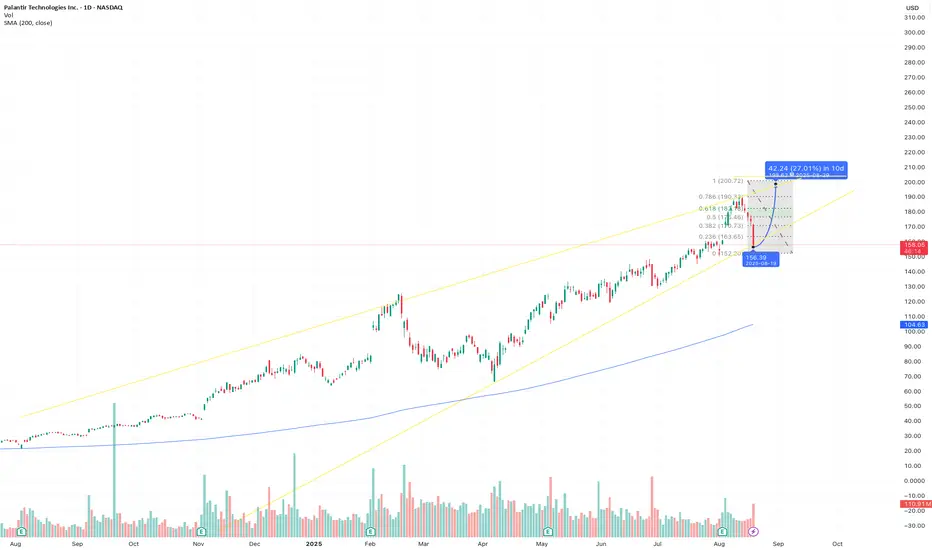
PLTR: This Drop ≠ February — Setup for 200+PLTR’s August dip looks nothing like February’s correction. In Feb, price unwound ~30% after insider-sale headlines + gov-spend fears and flushed to the 0.618 retrace, breaking key MAs. This time, the selloff paused at shallow fibs (0.236–0.382), held stacked support ($156 → $148 zone), and buyers stepped in before any trendline/50-DMA break. The catalyst is mostly valuation chatter, not fundamentals. With structure intact, a quick V-shape reclaim is on the table if we clear resistance levels in sequence.
What I’m watching
- Hold above $156 and build higher lows over $158 → momentum base.
- Trigger: reclaim $171.75 (0.382), then $178.7 (0.236) to re-ignite trend.
- Acceptance back over $186–$190 (prior ATH area) opens the 200s.
Why this isn’t Feb
- Depth: Feb = deep 0.618 wash; Aug = shallow 0.236/0.382 tag.
- Structure: Feb broke MAs/trend; Aug holds channel + MAs.
- Narrative: Feb = fundamental risk headlines; Aug = valuation noise while demand pipeline stays active.
Price Targets
- 171.50
- 178.70
- 186 - 190
- 205
- 217 - 235
Not financial advice.
PLTR SELL ++++$129 first "major" support, way overvalued anywhere over $20 but have at it! Several sell signals on ichimoku cloud MA cross at cloud support first support to maintain the uptrend is at $129

PLTR Bear Play! $145 Put Poised for Big Weekly Move!
# ⚡ PLTR Weekly Put Play – \$145 Strike for 50-100% Gains 💹🔥
### 🔎 Quick Market Snapshot
* **📉 Daily RSI:** 33.8 → Oversold & accelerating downward momentum
* **📊 Weekly RSI:** 56.8 → Falling, weakening bullish momentum
* **💵 Price Action:** -15.65% drop, bearish engulfing pattern
* **📈 Volume:** 1.5x previous week → Institutional selling confirmed
* **📊 Options Flow:** Call/Put ratio 1.00, but heavy put volume @ key strikes
* **🌡️ VIX:** 15.8 → Low volatility environment, ideal for directional trading
---
### 🎯 Trade Setup (High Conviction Put Play)
* **Ticker:** PLTR
* **Direction:** 📉 PUT
* **Strike:** \$145.00
* **Entry Price:** \$1.70
* **Profit Target:** \$2.52 (50% gain), secondary \$3.36 (100% gain)
* **Stop Loss:** \$0.84 (50% of premium)
* **Expiry:** 2025-08-22
* **Confidence:** 🟢 75% Bearish
* **Timing:** Enter **market open Thursday**
---
### 📝 Trade Thesis
Strong institutional selling + oversold technicals + bearish price action = **high-probability short-term put trade**.
⚡ **Play: \$145 Put targeting 50-100% gains before Friday expiration.**

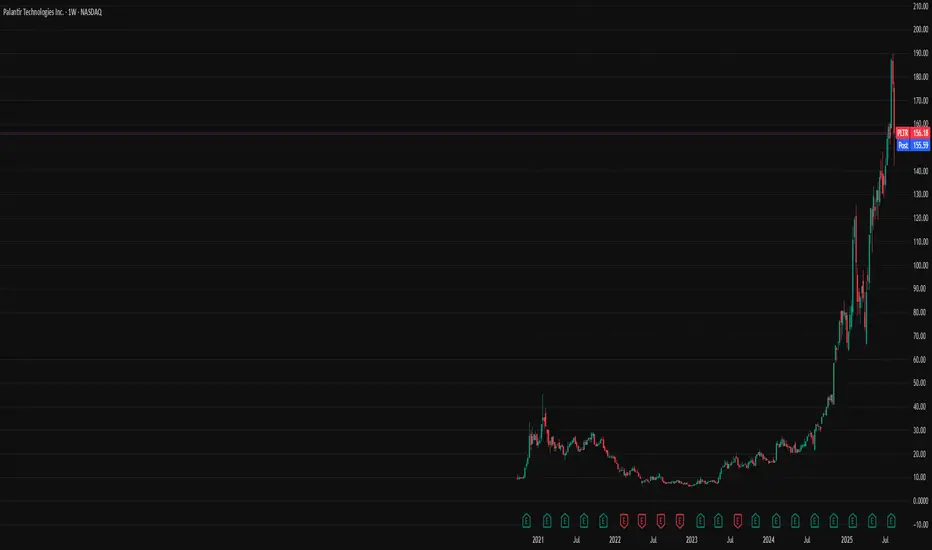
Palantir - The unstoppable company!💣Palantir ( NASDAQ:PLTR ) is just too strong:
🔎Analysis summary:
Since mid 2022, Palantir managed to rally more than 2.500%, creating new all time highs every single month. Eventually this rally will slow down, but before this happens, Palantir could rally another +100%. This is a classic example of stock market behaviour and you should take advantage.
📝Levels to watch:
$200
SwingTraderPhil
SwingTrading.Simplified. | Investing.Simplified. | #LONGTERMVISION

PLTR Markets Overreacting? Hidden bullish RSI divergence on the weekly PLTR chart forming as investors react strongly to recent company criticisms and the upcoming Jackson Hole conference.
This feels more like knee-jerk panic selling than a genuine change in sentiment, but we'll have to see if this is true.
If the previous PA is anything to go by, we may see prices quickly reverse. There, we can see price gapped up significantly before retracing again, leaving a hidden bullish RSI divergence on the weekly that led to a sharp reversal (minus the April Trump tariff shakedown)
I'll be interested to see how this one plays out. A dovish Fed this week would also certainly help the situation, and this next move may hinge almost entirely on that outcome.

PALANTIR is dropping but below the 1D MA50 lies the best BUYLast time we looked at Palantir (PLTR) was almost 4 months ago (May 06, see chart below), giving a buy signal that gradually but surely hit our $185 Target:
This time, the stock has found itself on a short-term pull-back that is about to hits its 1D MA50 (blue trend-line) for the first time since April 21 (4 months). This is far from alarming as the strongest buy signal within its long-term (since February 2023) Channel Up, has been below the 1D MA50.
At the same time, the 3-year RSI Buy Zone (40.00 - 30.00) is also close to being tested, so once it does, we will technically get the most optimal buy confirmation.
Even though another 183% rise from the potential bottom is possible, we will pursue a more modest Target this time, especially as we get close to the end of the year (and potentially the Cycle).
The minimum rise the market has delivered upon a 1D MA50 break has been +58.11%. As a result, our Target will be $220.00.
-------------------------------------------------------------------------------
** Please LIKE 👍, FOLLOW ✅, SHARE 🙌 and COMMENT ✍ if you enjoy this idea! Also share your ideas and charts in the comments section below! This is best way to keep it relevant, support us, keep the content here free and allow the idea to reach as many people as possible. **
-------------------------------------------------------------------------------
💸💸💸💸💸💸
👇 👇 👇 👇 👇 👇

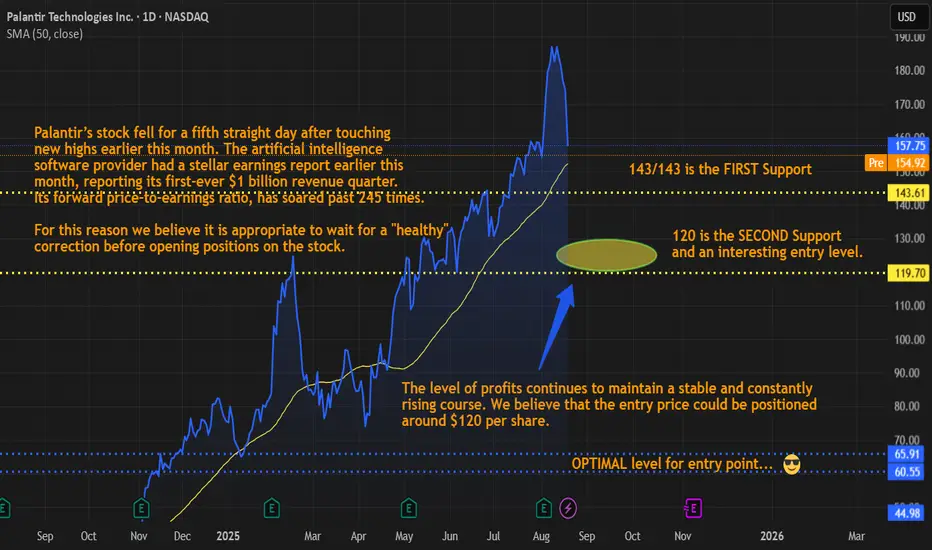
Palantir Technologies Inc (PLTR)Its forward P/E Ratio is at 245, wait for a healty correction before opening positions.
PLTR to get back to 200 by October 2025From the trend lines and support it appears like the next move up is very likely to go beyond 190 to 200 range. The support for 157.4 is strong. The close today may give clear signal for going up.
PLTR CALL 170C —Don't Miss it
🚀 **PLTR Weekly CALL Alert!** 🚀
Momentum building 📈 | RSI rising | Favorable volatility ⚡
🎯 **Strike:** \$170 CALL
💵 **Entry:** 0.70 | 🎯 **Target:** 1.40 | 🛑 **Stop:** 0.35
📅 **Expiry:** Aug 19 | ⏰ **Entry:** Open
⚡ **Confidence:** 70%
Bulls in control + rising RSI = upside potential 💥📊
\#PLTR #OptionsTrading #WeeklyCalls #BullishMomentum #SwingTrade #TradeSetup #VIX #TechStocks
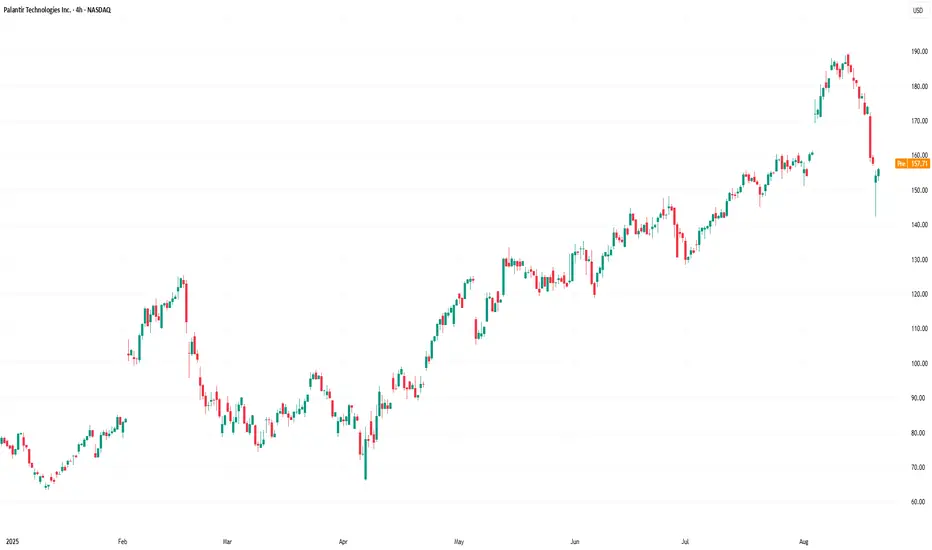
Palantir: Cooling Off After a Strong Bull Run & ATHPalantir: Cooling Off After a Strong Bull Run & ATH.
Palantir has recently taken a breather following an impressive upward rally. The stock surged from the $66 level on April 7th this year to reach a new all-time high of $190.
As expected, no asset moves parabolically upward forever without a retracement.
Over the past week, Palantir has been experiencing a pullback, with today’s session showing a decline of over 6%. The stock is currently trading around $161.
From a technical perspective, I am eyeing two potential entry zones — $160 and $150. Both levels align closely with the Fibonacci 50% and 61.8% retracement areas, making them significant points of interest for a possible rebound.
As always, I take a medium- to long-term approach to my trades, as patience is often the key to capturing real value in strong stocks.
If you found this analysis helpful, please like, comment, share, and connect with me. Let’s continue building a strong TradingView community together.
PLTR still bullish - Cup n Handle patternPLTR in Cup and handle pattern, broke out.
The price closed on Friday is $131.78 (05.30.2025).
Desired entry price $127.88.
Target $147.58/ 164.99/ 183.41.
Stop loss $119.41.
IMO.

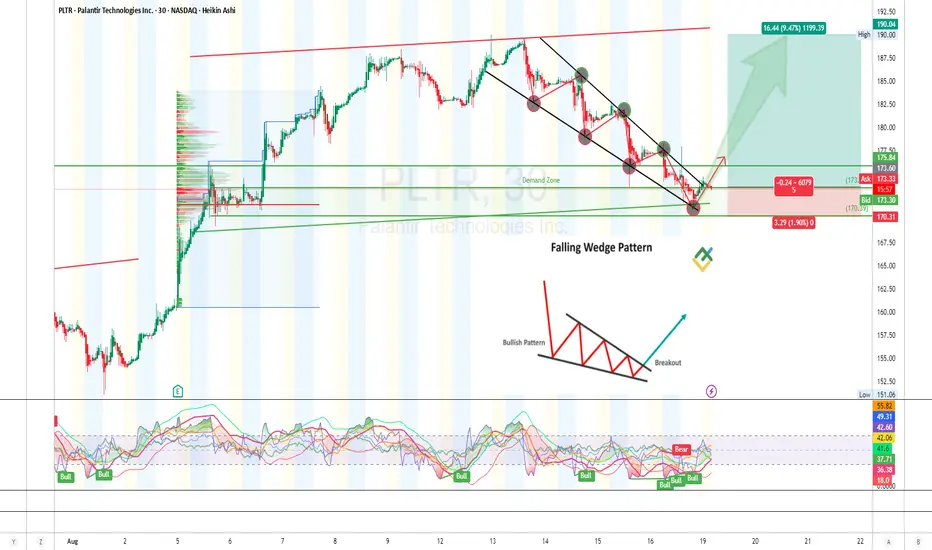
Palantir (PLTR) 30-min chart "Potential falling wedge" - Long.PLTR ripped up hard in early August, forming a solid base and a steep uptrend, which has now corrected into a **clean descending channel**.
Price is now reacting off a key **Demand Zone**
The move down formed a corrective structure with potential **ending diagonal / falling wedge**, signaling a possible end to the corrective wave.
**Key Zones**
**Demand Zone:**
**\$170.31 – \$173.50**
* Price has bounced here multiple times.
* Confluence with ascending trendline.
* High volume node on VPVR = solid support.
**Supply Zone (Target Area):**
**\$190.00 – \$192.50**
* Previous high & price memory.
* Strong overhead resistance for profit-taking.
**RSI Divergence**
**bullish** divergences observed on the RSI
* While price was making lower lows, RSI indicators were making **higher lows**.
* This confirms **bullish momentum shift**. Great sign of hidden strength!
Long Setup
🎯 **Entry:**
* Market entry around **\$173.60**
🛑 **Stop Loss:**
* Just below demand zone & trendline
**\$170.31**
🎯 **Target:**
**\$190.00**
**Risk/Reward:**
* RR: **\~5.0**
* Risk: **\$3.29** per share
* Reward: **\$16.44** per share
**Risk Management**
* **Max risk: 1–3%** of total trading capital.
* Consider **reducing position size** if trading multiple assets.
* Ideal position size should match account size and stop loss to stay within defined % risk.
**Trade Management Tips**
* **Move SL to Break Even** once RR hits 1:1.
* Monitor for strong rejection at \$182–185 area (midway supply).
* Consider **scaling out 50%** of position at \$182, letting the rest run to \$190.
“Be fearful when others are greedy, and greedy when others are fearful.” – Warren Buffett
⚠️ **Disclaimer**
This analysis is for **educational purposes only** and does **not constitute financial advice**. Always do your own research and manage your risk responsibly.
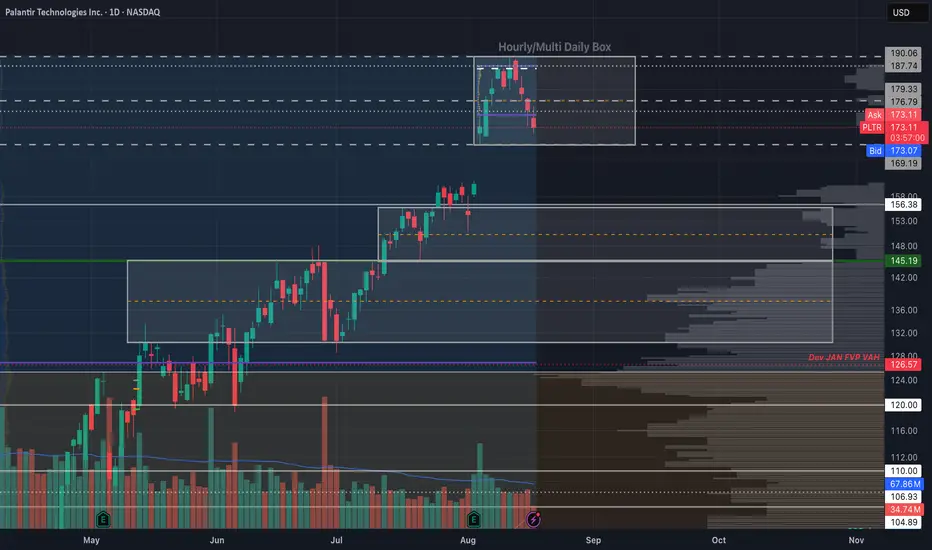
Palantir - The Box Calls The ShotsI recently posted a palatir chart with clean levels of where I'd look to DCA. While those dip-buy levels can easily be used to trade the name, I think it would also help to be mindful of the box ranges as we trade into them. As you'll see, Palantir loves to play with box as much as I do.
If you are familiar with how to trade box set-ups, you can take advantage immediately; otherwise, you may want to do some research on how to trade these.
~The Villain
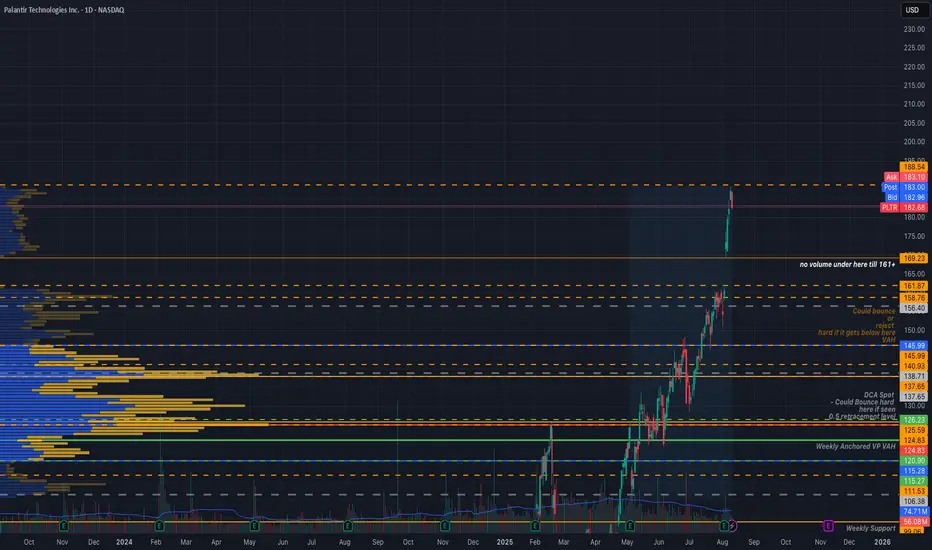
Huntin Wabbits - PalantirWill be using this chart to guide re-entries into palantir.
Immediately watching the $161 - $169 area.
Then $145-$126 if seen.
If S&P gets a good fuckening down the road, then I would like to begin DCAing into $126.
None of this is financial advice.
I'm just a guy with an interest and a celcius addiction.
~The Villain
looking for a push up on pltr but needs to break temp resistancelooking for a push up on pltr but needs to break temp resistance

Palantir: Bullish Signals Point to Upside Beyond $180 Current Price: $177.17
Direction: LONG
Targets:
- T1 = $182.50
- T2 = $186.00
Stop Levels:
- S1 = $174.50
- S2 = $172.00
**Wisdom of Professional Traders:**
This analysis synthesizes insights from thousands of seasoned traders and institutional investors. By leveraging the wisdom of crowds, we aim to uncover consensus-driven opportunities that minimize biases and optimize predictive accuracy. In the case of Palantir Technologies, the collective sentiment indicates strong bullish momentum underpinned by both market trends and fundamental catalysts.
**Key Insights:**
Palantir Technologies continues to dominate the government and enterprise analytics space with its scalable AI-powered solutions, driving demand across sectors dealing with complex data. Recent developments in artificial intelligence and defense-related contracts have highlighted the company's indispensable role in modernizing data infrastructure, positioning it as a high-growth stock. Additionally, the increasing need for transparent data platforms in the corporate sector aligns closely with Palantir's core offerings, reinforcing long-term growth potential.
Market volumes also suggest an accumulation phase, indicating that institutional players are increasing their exposure to Palantir. This aligns with technical analysis pointing to the stock potentially breaking resistance levels to establish a new upward trend. With improving fundamentals, a rise in trading volume, and consistent contract wins, Palantir holds strong upside potential in the near term.
**Recent Performance:**
Palantir’s recent price action has seen steady gains, climbing from the mid-$160s to $177.17 in a relatively short period. The stock has shown resilience even during broader market hesitations, validating its strong investor confidence and fundamental backing. The upward trajectory has also been marked by higher intraday highs and closing prices, signaling firm momentum.
**Expert Analysis:**
Technical experts have identified a bullish breakout pattern emerging in Palantir’s price action. Key moving averages such as the 50-day and 200-day lines are moving upward, further confirming the bullish sentiment. RSI levels currently sit in the mid-range, indicating room for further growth without overbought conditions. Analysts foresee continued momentum driven by robust earnings potential and increased demand for Palantir’s AI-enabled solutions across critical sectors like government, healthcare, and logistics.
**News Impact:**
Recent headlines surrounding Palantir’s advancements in AI software and strategic partnership deals within defense and Fortune 500 companies have significantly boosted investor sentiment. Moreover, as geopolitical tensions remain high globally, the company’s intelligence-driven solutions position it as a critical resource for governments, likely paving the way for additional contracts. This news flow continues to validate the stock’s bullish momentum and its broader macroeconomic relevance.
**Trading Recommendation:**
Take a bullish position on Palantir Technologies as both technical indicators and fundamental drivers align to support a continued upward trajectory. With price targets of $182.50 and $186.00, and stop levels carefully placed to mitigate downside risk, Palantir offers an attractive trade setup for growth-focused investors. Strong institutional interest, combined with expanding AI and enterprise markets, makes this stock one to watch in the current market environment.
Do you want to save hours every week?