TSLA Roadmap: $563 ABCD Compl → Bat Harmonic → $631 Three-DriveTesla (TSLA) appears to be completing its final impulsive wave toward the $563 region, which also aligns with the D point completion of the ABCD harmonic pattern.
Once this move is finished, the expectation is for a corrective phase that forms a Bat harmonic. This retracement would also work to fill in the untested gaps left behind during the recent rally, with a potential bottom around the 78.6% Fibonacci level.
From there, the next bullish leg could initiate, targeting the 127.2% extension at $631. This move would not only confirm the harmonic reversal but also complete a larger Three-Drive pattern that originates from the initial ABCD structure.
Key Levels to Watch:
ABCD Harmonic D point: ~$563
Bat Harmonic completion zone: ~78.6% retracement
Next rally target: $631 (127.2% extension, Three-Drive pattern confirmation)
Invalidation Scenarios:
A clean breakout above $563 without corrective rejection would invalidate the Bat harmonic setup and suggest an extended bullish run.
A failure to hold above ~$367 (channel/structure support) would weaken the harmonic roadmap and risk a deeper bearish continuation instead of a Three-Drive completion.
This roadmap suggests a critical short-term top before a deeper correction sets the stage for a much larger rally.
TSLA trade ideas

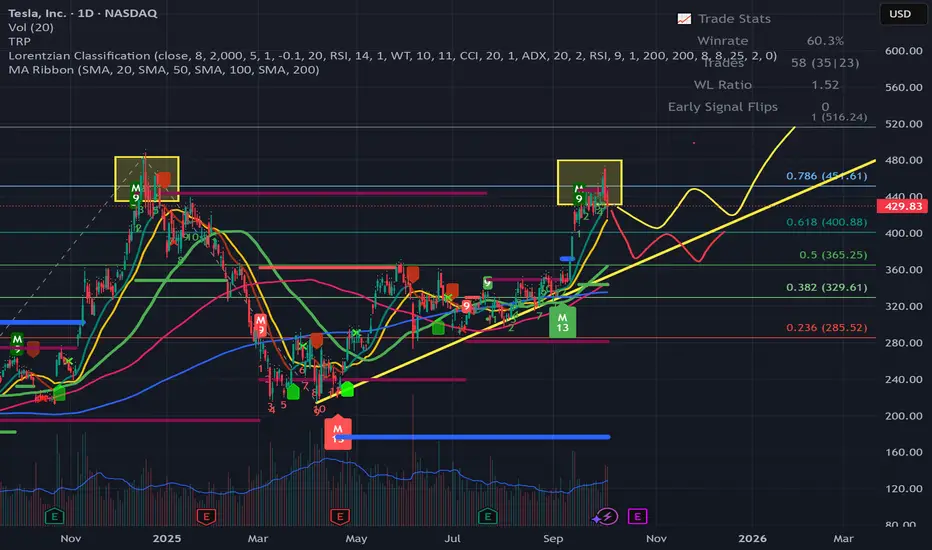
TSLA - Tesla - Possible Pull-Back to 400 or 365Hello Everyone , Followers
Tesla is the second one that i would like to mention today.
It hit the Resistance level of 451 and then it did not achive to break this level.
Now i am expecting 2 possible scenario
Yellow pattern : pull back till 400 and get power from this level and try to break 451 again.
Or Red Pattern : pull back till 365 then get support from trend line and go up again and try to break 451.
If it breaks the 451 then next station is 515 - 516 .
All in all , i am expecting the Pull-back next week and you could follow the price levels that you can see in Chart. I am neutral in Tesla for the time being.
This is just my thinking and it is not invesment suggestion , please do not make any decision with my anaylsis.
Have a lovely Sunday to all.
The 7 Killers That Make You Lose Money in TradingTrading isn’t easy; in fact, it’s one of the most complicated ways to make money in the financial world.
I know that’s not what the mainstream narrative tells you. The same narrative that warns “more than 90% of traders lose money” also sells the illusion that you’ll be part of the 10% who don’t, because deep down, we all think we’re different, smarter, faster, more capable than the crowd.
But if you strip away emotion and bias and read that statistic correctly, it’s a harsh truth: you have less than a 10% probability of long-term success. That’s not pessimism; that’s probability. And probability doesn’t lie. Every day, it quietly proves that most “special” traders end up broke, not because markets are unfair, but because they misread the numbers that could have saved them.
After more than 20 years in this game, I’ve noticed one thing every losing trader has in common: they ignore what’s painfully obvious. Trading is numbers in an uncertain world.
Numbers mean math. Put math in an uncertain environment, and the only way to handle it is through probability. Yet most traders fight this reality, chasing signals, news, or “gut feelings” instead of learning how probability actually runs the game.
After working with hundreds of losing traders, I found that this blindness leads to seven recurring mistakes: the same ones that keep the losing rate stuck above 90%.
1. Mistake: Trying to Predict Instead of Projecting
The moment you believe you need to know where the market’s going, you’ve already lost your edge. By definition, the future is uncertain; anything can happen. No system or algorithm can change that.
The game changes when you stop trying to predict what the market will do and start projecting how your account will behave under uncertainty. It’s not about guessing direction; it’s about managing outcomes.
Probability reminds us that uncertainty isn’t our enemy, it’s our playing field. Without it, there would be no opportunity. Don’t focus on prediction; learn to handle what the market does and control its impact on your account value.
📖 Referenced posts: “In a World of Chances, Probability is the King” and “The True Laser Vision in Trading.”
2. Mistake: Judging Success Trade by Trade
If you judge your system by a single trade, you’re missing the point. Trading isn’t a sprint; it’s a marathon. Your edge doesn’t live in one trade, it appears in the average of many.
Focusing on each result drags you into an emotional roller coaster, the highs of winning and the lows of losing. In reality, you’re not reacting to truth; you’re reacting to variance, and variance loves to mislead.
The real measure of your system (your expectancy) doesn’t care about your last trade. It only reveals itself after enough repetitions, as the law of large numbers smooths out noise and exposes your true average performance.
If you want peace of mind, stop zooming in on the moment. Zoom out and focus on the mean, the expected value of your account. That’s the mindset that turns emotions into data and chaos into clarity.
📖 Referenced posts: “Sharpening Your Trading Focus” and “Spying on Your Trading Future.”
3. Mistake: Not Accepting Losses as Part of the Process
I’ve seen it countless times: new traders obsessed with their win rate. Almost every candidate I’ve mentored asks the same question before hiring me: “What’s your winning rate?”
And I get it. In a world obsessed with prediction, it feels natural to think accuracy equals success. But that’s where I correct them: we’re not here to predict; we’re here to make money.
Instead of asking how often a trader is right, ask, “How much money does he keep after losses?” That’s the question that shifts focus from ego to expectancy, from being right to being profitable.
📖 Referenced posts: “Decoding Trading Odds: Demystifying Probability”.
4. Mistake: Misjudging Probability as Too Complicated
Many traders avoid thinking in probabilities because they believe it’s too mathematical. They prefer indicators because they seem easier and more visible. I get it, not everyone loves math. But in trading, probability isn’t complex theory; it’s practical logic.
Think about predicting the weather. When you see a small gray cloud, you don’t say, “It will rain.” You say, “It might rain.” That’s probabilistic thinking: assigning likelihood instead of claiming certainty.
Trading works the same way. Every trade is its own weather forecast. You can’t predict what will happen, but you can estimate what’s likely and prepare for both outcomes. Once you see probability as a decision framework, you stop reacting emotionally and start thinking strategically.
📖 Referenced posts: “In a World of Chances, Probability is the King” and “Decoding Trading Odds: Demystifying Probability.”
5. Mistake: Overleveraging Your Edge
Even with a profitable system, betting too big turns strategy into suicide. Leverage doesn’t just multiply gains; it magnifies mistakes. I’ve seen many good traders destroy solid systems because they couldn’t stay anchored to steady, safe growth. They wanted to accelerate the curve.
But here’s the truth: every time you increase position size, you also increase your risk of ruin exponentially. Great traders know success isn’t about how fast you can grow, but how long you can keep growing.
It’s even worse for traders who don’t know if they have an edge at all. Leverage in the wrong hands is like a driver who thinks that because he can handle a Tesla, he can drive an F1 car. He’s not compounding; he’s just going to hit the wall faster.
And the market knows that. That’s why those aggressive leverage offers exist, they want your money fast.
Knowing how to play the long game is the real alpha.
📖 Referenced posts: “Spying on Your Trading Future” and “Risk Management: The Engine of Expectancy” (upcoming).
6. Mistake: Misunderstanding Variance and Calling It Bad Luck
When things go wrong, most traders think they’re bad traders, or they blame their system and rush to replace it. Or worse, they believe the markets are rigged. In reality, they just don’t understand variance.
Variance is when you take three losses in a row despite perfect setups. It’s not betrayal or bad luck; it’s randomness doing its job. Every system has a natural distribution of wins and losses, and they’ll always appear randomly. Sometimes you’ll win, sometimes you’ll lose. No rule or model can predict exactly when. That’s not broken; that’s just markets being markets.
Neither streak defines your edge, they’re both part of the math. That’s why only expectancy can tell you if you have an edge or just luck.
When traders don’t understand variance, they take it personally. A losing streak feels like punishment; a winning streak feels like mastery. Both are illusions. Expectancy, the expected value of your account, doesn’t care about your feelings. It only reveals your edge over a large enough sample, when randomness smooths out and the real average emerges.
Accept variance as part of the process and trading becomes calmer, simpler, and much more rational.
📖 Referenced posts: “Spying on Your Trading Future” and “Sharpening Your Trading Focus.”
7. Mistake: Replacing Numbers and Logic with Dopamine and Emotion
One of the hardest habits to break in new traders is their need for dopamine. Many don’t come to the market to trade; they come to feel something. They treat trading like entertainment — constant stimulation, adrenaline, and fast feedback.
A typical beginner believes trading means dozens of short-term trades per day, with stops and targets hit constantly, like scrolling through TikTok. Each trade becomes another “like,” another hit of excitement.
I often tell my students, “If you’re here for entertainment, go to the cinema, or better yet, go to Las Vegas. It’ll cost you less, and you’ll leave happier.”
Trading isn’t a game of dopamine; it’s a game of data and probabilities. The more you chase emotional highs, the further you drift from logic and expectancy. When you trade emotions instead of numbers, you stop trading your system and start trading your mood.
📖 Referenced posts: “Sharpening Your Trading Focus” and “The True Laser Vision in Trading.”
Bonus: Trusting the Wrong Sources
Here’s an uncomfortable question: if 90% of traders lose money, what are the odds that most trading education actually works?
If we apply probability to information itself, we’d infer that 90% of the “trading wisdom” online is more likely to produce losses than profits. In other words, there’s a 90% chance your guru is wrong. And that’s before considering how many truly successful traders never share what really works.
So ask yourself: if most people fail, does it make sense to follow what most people do? There’s no formal proof for this, but after two decades in the game, I’ve seen the pattern repeat endlessly. The crowd follows the same noisy ideas... and the crowd loses.
It may not be a comfortable truth, but sometimes the truth that shocks you is the one that sets you free.
Final Thought
Most traders don’t lose because they lack talent; they lose because they fight probability instead of using it. Trading is uncertainty made measurable — a game of math, mindset, and patience.
Learn to think like a risk manager, not a fortune teller.
And remember, if you’re here for entertainment, go to Las Vegas. It’ll cost you less, and you’ll probably leave happier.
Throughout this post, I’ve referenced other entries that explore each of these mistakes in more depth. They’re all part of the How To Lambo series, where I keep breaking down the probabilistic view of trading in plain language: practical, rigorous, and free of jargon.
If you haven’t read them yet, I highly recommend starting with “Probability is the King” and “The True Laser Vision in Trading.”
TSLA Testing Critical Support — Will Bulls Reclaim? Oct. 6⚡️
Market Context & Overview (15-Min Chart)
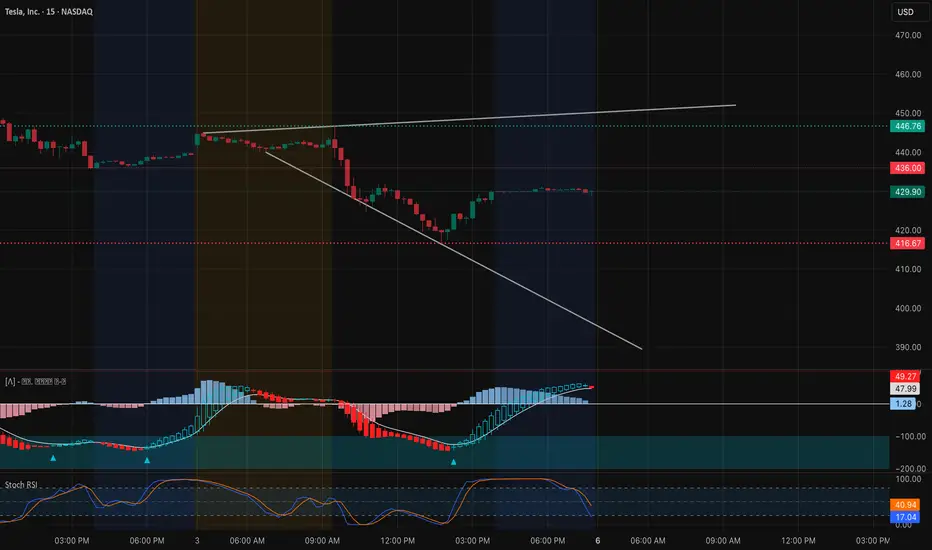
TSLA has been under steady selling pressure, sliding from the $446–450 resistance zone toward the $416–420 support. The 15-minute chart reveals a clear short-term downtrend, marked by a descending trendline and a series of lower highs. However, buyers finally showed signs of life late Friday, creating a rebound attempt above $425 — a minor but notable shift in momentum.
The MACD histogram has turned positive, and the blue line has crossed over the red, suggesting early bullish momentum building up after a short-term exhaustion. The Stoch RSI has curled upward from oversold territory, hinting that the stock may be setting up for a relief bounce if the intraday trendline breaks cleanly above $432–$435.
GEX Confirmation (1H Chart Insight)
The 1-hour GEX (Gamma Exposure) chart adds an important institutional perspective. The highest positive NET GEX sits between $446–$452, aligning with the 2nd and 3rd CALL walls — a significant resistance area where dealer hedging can dampen upside movement unless a strong breakout occurs.
On the downside, heavy PUT walls and support zones rest around $416–$405, reinforcing this as the critical defense zone for bulls. If price holds above $416 early this week, a short-term reversal toward $440+ becomes highly probable as option dealers shift their delta hedging upward.
IVR remains moderate (26.7), with CALL positioning at 62.9%, suggesting sentiment still leans bullish, though not extreme.
Trade Scenarios (for This Week)
Bullish Case:
If TSLA breaks and sustains above $435, expect momentum to accelerate toward $446, and possibly $452, where the next CALL wall sits.
* Entry: Above 435 confirmation
* Target 1: 446
* Target 2: 452
* Stop-Loss: Below 425
Bearish Case:
If price fails to reclaim 435 and breaks back below $420, sellers could retest $416 and possibly sweep toward $405, which is the major PUT support level on GEX.
* Entry: Below 420
* Target 1: 416
* Target 2: 405
* Stop-Loss: Above 430
Options Insight
Given the GEX structure, short-term calls near 430–440 could benefit from a quick bounce play if momentum continues early in the week. Conversely, puts near 420 become favorable only if TSLA fails to break the descending trendline. A balanced gamma landscape this week may create a “whipsaw” environment, so avoid chasing extremes — trade confirmation, not prediction.
My Thoughts: This setup feels like a “pressure build” zone — bears losing momentum but bulls not yet commanding control. A breakout from the descending trendline will likely dictate the week’s tone. The key is whether TSLA can convert $430–$435 into support. A sustained hold above that could quickly trigger gamma-driven buying back toward the mid-$440s.
If it rejects again and volume fades, the PUT side could reload, making $416 the final line before a larger flush. Watch that MACD and Stoch RSI cross — they’re early tells of rotation strength.
Disclaimer:
This analysis is for educational purposes only and does not constitute financial advice. Always perform your own due diligence and manage risk responsibly before trading.
TESLA My Opinion! BUY!
My dear friends,
Please, find my technical outlook for TESLA below:
The instrument tests an important psychological level 413.27
Bias - Bullish
Technical Indicators: Supper Trend gives a precise Bullish signal, while Pivot Point HL predicts price changes and potential reversals in the market.
Target - 428.09
Recommended Stop Loss - 405.57
About Used Indicators:
Super-trend indicator is more useful in trending markets where there are clear uptrends and downtrends in price.
Disclosure: I am part of Trade Nation's Influencer program and receive a monthly fee for using their TradingView charts in my analysis.
———————————
WISH YOU ALL LUCK

Tesla (TSLA) – Final Wave 5 to Complete Cypher HarmonicTesla is progressing through its final impulsive Wave 5, with upside targets aligning at $563–$564, confluencing with the 1.272–1.618 Fib extensions and the completion of the Cypher harmonic (point D). Once this target is reached, a corrective decline is anticipated, forming the Cypher retracement and potentially filling untested gaps below.
Key levels to watch:
Upside target: $488.5, then $563–$564 zone (Cypher completion).
Downside retracement: possible move back toward the $350–$360 region (0.618–0.786 support).
Invalidation:
A breakout above $565 would invalidate the Cypher completion zone and suggest extended bullish continuation.
A breakdown below $400 before reaching $488 invalidates the Wave 5 structure.
This scenario blends Elliott Wave 5 projections with harmonic Cypher confluence for a potential high-probability setup.

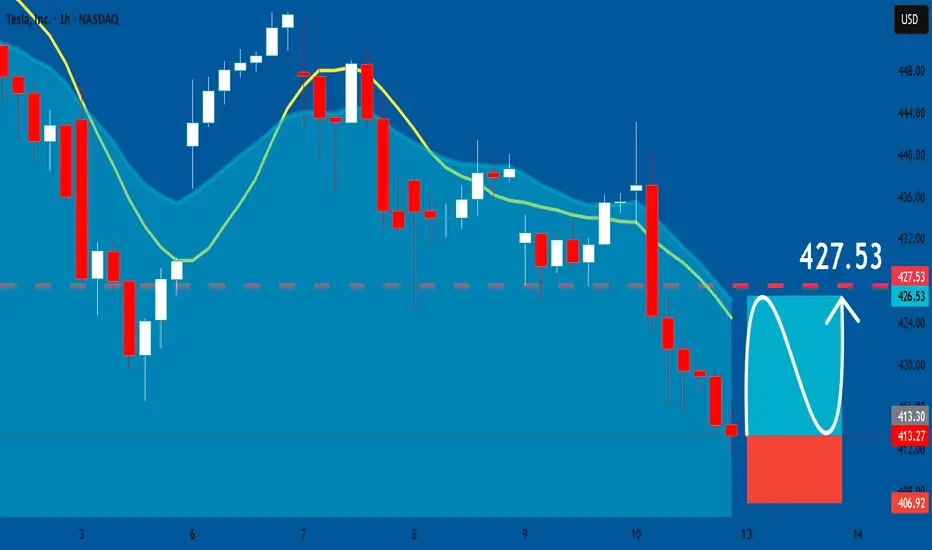
TESLA: Long Signal Explained
TESLA
- Classic bullish formation
- Our team expects pullback
SUGGESTED TRADE:
Swing Trade
Long TESLA
Entry - 413.27
Sl - 406.92
Tp - 427.53
Our Risk - 1%
Start protection of your profits from lower levels
Disclosure: I am part of Trade Nation's Influencer program and receive a monthly fee for using their TradingView charts in my analysis.
❤️ Please, support our work with like & comment! ❤️
$TSLA Bearish batReached target (0.886 fib level) after breaking out from B point of the pattern. will wait for price to go down further and consolidate.

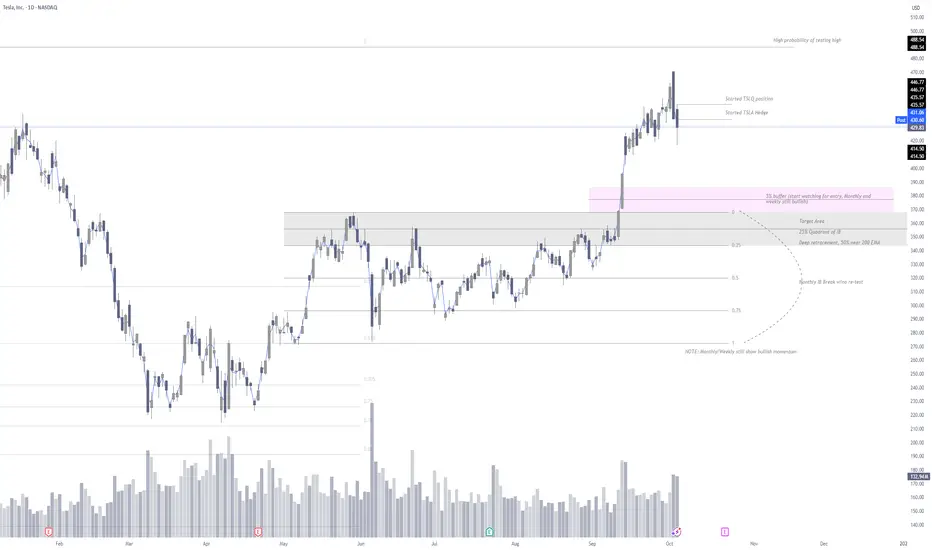
TSLA Short1. May/June Inside Bar: Broke to the upside on September with no re-test of break.
a. Higher timeframes take longer for this to re-test.
b. I have found that 18 days is an average re-test, but this is not 100%.
2. Daily chart shows pullback, but its extremely important to understand that the weekly and monthly show bullish momentum.
3. I have started a TSLQ short position adding slowly, with TSLA shares targeting ATH's.
4. The target is for TSLA to move back into the 5% buffer, where I will start looking for a long position. The inside bar is usually re-tested. If bullish momentum is still there, which the weekly and monthly still show, then the 5% buffer and 25% quadrant are entry zones. However, if something changes, then 50% quadrant should be the target.
Happy trading!
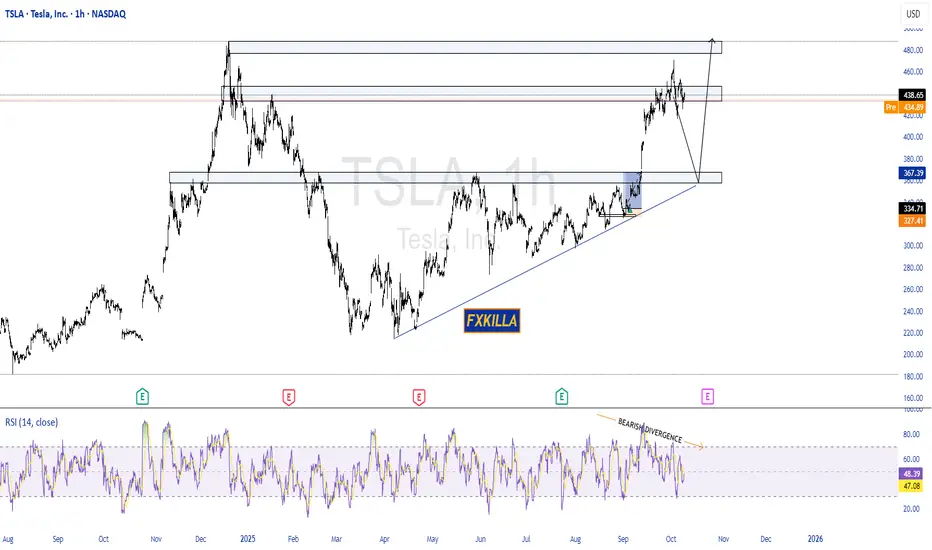
TESLA HIGH PROBABILITY SETUPS SOON!!!🚨 TESLA HIGH PROBABILITY SELL/BUY SETUPS 🚨
* Here We Can See Clearly The Next Potential Move For TSLA Coming Hours/Days.
* Keep Your Eyes Close On Your Trading Positions.
* Happy PIP Hunting Traders.
FXKILLA.
TSLA Slips Despite Record Q3 Deliveries AI Growth Play?TSLA – Financial Performance & SWOT Analysis
TSLA Slips Despite Record Q3 Deliveries AI Growth Play?
(1/9)
Good Morning, folks! TSLA is pulling back 📉, at $ 436.33 up 7.85% YTD per October 10, 2025. AI integration shakes up this EV play , let’s dive in! 📊🔥 Tag a friend who needs this investing hack!
(2/9) – PRICE PERFORMANCE
• Last day: $ 436.33, down slightly pre-market 📉
• YTD 2025: up 7.85%, lagging S&P 500 🔄
• Q3 2025: record deliveries, but stock dips 🚀
This EV stock’s volatility, AI hype pops! 💥
(3/9) – MARKET POSITION
• Market Cap: $ 1.45T, industry giant 🏆
• Avg Volume: 88.96M shares, high liquidity 💧
• Trend: high P/E amid growth expectations 👑
This asset’s dominance, holding tight! 🔒
(4/9) – KEY DEVELOPMENTS
• Q3 deliveries: record highs, beat estimates 💰
• Stock dip: despite beats, tax credits end 🏭
• AI focus: Robotaxi event Oct 22, autonomy push 📈
This EV move, AI-driven surge! ⚡
(5/9) – RISKS IN FOCUS
• High volatility: beta 2.09 swings ⚠️
• Subsidies end: EV tax credit phaseout 🆚
• Market liquidations: $700M crypto-wide impact 📉
This ticker’s exposure, watch these twists! ⚠️🔄
(6/9) – SWOT: STRENGTHS
• EV leadership (deliveries.): market share 🌟
• AI integration (FSD/Robotaxi.): growth edge 🤖
• Institutional demand (ETFs.): sentiment boost 👥
This asset’s edge, built tough! 💪
(7/9) – SWOT: WEAKNESSES & OPPORTUNITIES
• Weaknesses: high valuation, subsidy reliance ⚖️
• Opportunities: AI boom, EV rebound 🌍
Can this ticker beat the odds? 🎲 Reply with your take!
(8/9) – POLL TIME!
TSLA’s $ 436.33 value, your vibe?
• Bullish: $500+ soon, AI beats 📈🚀
• Neutral: Steady, risks balanced ⚖️🛡️
• Bearish: $400 looms, subsidy hits 📉⚠️
Chime in below! 💬 Tag a friend for this poll!
(9/9) – FINAL TAKEAWAY
TSLA’s $ 436.33 position shows resilience 💪, AI fuels it ⚡. Risks bite 🦈, yet dips are DCA gold 💎. We grab ‘em low, climb like pros! Gem or bust? not advice, just our spin!
#TSLA #Investing #Markets #Trading #Finance #ETF #Commodities #DCA #Trends
TSLA is mixed as of October 10, 2025, at $ 436.33, up 7.85% YTD per TradingView. Q3 deliveries shape its path in the EV space. Here’s a factual financial and strategic breakdown.
**Financial Performance**
Price Movement: YTD at $ 436.33, up 7.85%. Broader period shows pullback from highs. Q3 adds upside, with record deliveries.
Volume & Market Cap: Avg volume 88.96M shares. Market cap at $ 1.45T.
Key Metric: Trailing P/E 256.20, forward P/E 172.41.
**SWOT Analysis**
Strengths:
- Record Q3 deliveries.
- AI and autonomy integration.
- Institutional interest.
Weaknesses:
- High valuation multiples.
- Subsidy phaseout impact.
- Recent stock pullback.
Opportunities:
- AI and Robotaxi growth.
- EV market rebound.
- New model launches.
Threats:
- Intense competition.
- Market corrections.
- Regulatory changes.
**TSLA vs. SPY: Key Comparisons**
| Aspect | TSLA | SPY |
|--------|------|-----|
| Purpose & Scope | EV and AI focus | Broad market index tracking |
| Dynamics | Beta 2.09 volatility vs. lower 1.00 | Steady benchmark |
| Market Position | Up 7.85% YTD, high P/E vs. S&P gains | Stable exposure |
**Investor Considerations: DCA**
Dollar Cost Averaging: TSLA’s volatility suits dip-buying. At $ 436.33, $10,000 buys ~23 shares; a 10% dip to $ 393 nets ~25 shares. Time in the market, not timing it, wins.
**Outlook & Risks**
TSLA’s $ 436.33 position shows AI edge, with delivery beats. Subsidy ends loom, yet dip grabs turn volatility into gains. AI or EV growth could sway it, but time’s our edge. Gem or fade? Depends on autonomy adoption.

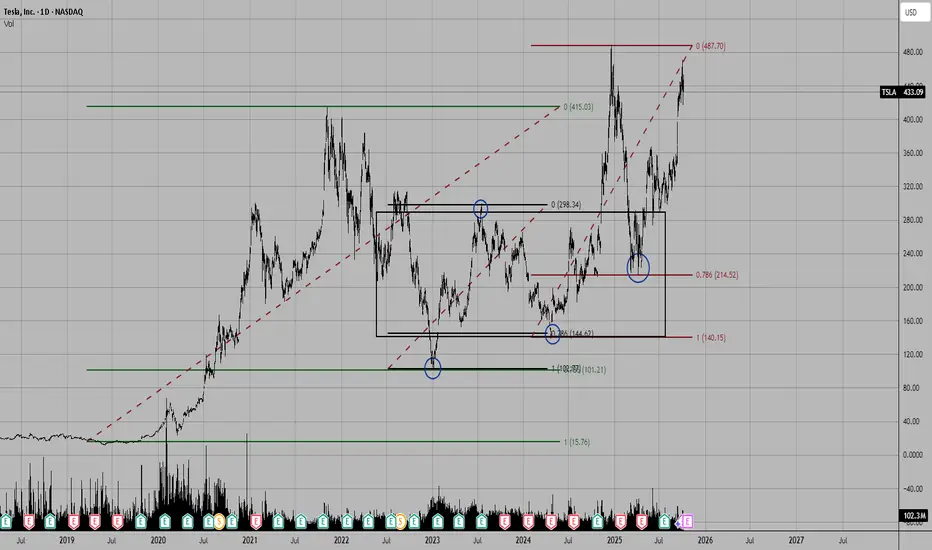
$TSLA — Structural Forecast + Macro & Catalysts ContextNASDAQ:TSLA – Macro, Technicals & Institutional Confluence ⚙️
📍 Current Price: $429.83
📊 Timeframe: 1D
🧠 Model Context: VolanX Institutional Forecast v2.3
Technical Setup
Tesla has been moving inside a well-defined ascending channel, currently testing the upper boundary near $460–$470, consistent with a premium liquidity sweep.
Price is slightly below its 10-day SMA ($437.99) but remains well above the 50-day ($363.66) and 200-day ($335.19) — confirming a strong medium-term trend.
RSI (~59–60) cooled off from overbought levels, suggesting a healthy pause rather than reversal.
The near-term risk is a retracement to the equilibrium zone ($414–$376), matching structural and moving-average support.
Macro & Catalysts
EV Demand Pulse: Q3 deliveries boosted by expiring U.S. EV tax credit — short-term tailwind but may front-load demand.
Robotaxi & FSD Expansion: Pilot rollout in Austin marks long-term disruption potential, but regulatory friction remains.
Next-Gen Platform: New low-cost “Cybercab / Model 2” architecture expected to reshape Tesla’s cost curve into 2026.
Competition & Margins: BYD, NIO, and European EV makers pressing pricing power; tariff impacts remain a headwind.
Macro Headwinds: Higher rates and policy uncertainty could compress valuations in growth sectors.
Institutional View (VolanX DSS)
Short-term bias: Controlled pullback to equilibrium (414–376).
Medium term: Reaccumulation phase as institutions rebalance.
Long term: Expansion target near $514+ once liquidity resets and RSI re-enters strength above 60.
“My models can project structure — not human emotion.
If fear overshoots $414, it may mark the next institutional entry before expansion.”
🧠 Structure always rebalances. Emotion never does.
#TSLA #VolanX #SmartMoney #AITrading #LiquidityZones #Macro #FSD #MarketStructure #TechnicalAnalysis

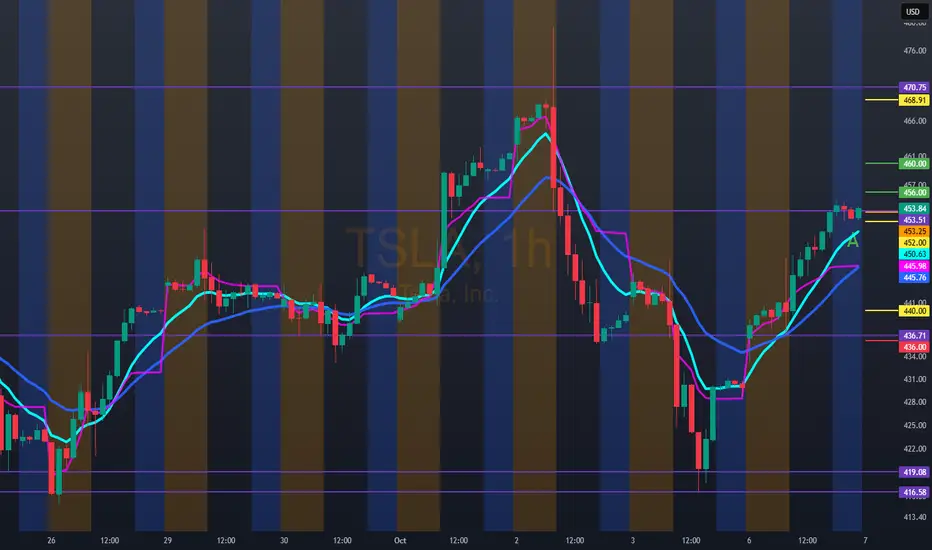
TSLA Oct 7 – At the Edge of a Breakout! Bulls Eyeing $460+ Zone15-Min Chart Analysis (Intraday Trading Setup):
TSLA is riding a sharp ascending wedge structure after a strong rally from the $420s. Price is consolidating near $453.84, right beneath the upper channel line around $455–$456, hinting at a potential breakout or short-term exhaustion.
The MACD remains elevated but is losing histogram momentum — suggesting that while buyers are still in control, short-term strength is cooling. Stoch RSI near 25 shows a possible reset before the next leg higher, a classic pattern after a big push.
If TSLA maintains support above $446.60–$448.00, bulls should watch for continuation toward $454.91 → $460. However, a break below $436.70 would invalidate the bullish micro-structure, potentially sending price toward $430–$428 to retest liquidity.
The 15-min chart shows buyers defending dips aggressively — indicating that institutions are still supporting price action within this rising wedge.
1-Hour GEX Confirmation (Options Sentiment Insight):
The 1-hour GEX data strongly supports the bullish thesis:
* Highest positive NETGEX / CALL resistance sits near $450, which TSLA has already reclaimed — a bullish confirmation that gamma is now supportive, not suppressive.
* CALL walls cluster between $455–$465, forming the next target zone if momentum persists.
* PUT walls remain heavy around $410–$420, providing a sturdy gamma floor.
This configuration reflects a bullish gamma landscape, where dealer positioning favors upward drift as long as TSLA holds above $445. The $450 reclaim may act as a launchpad toward the $460 gamma pocket.
My Thoughts:
TSLA’s recovery from sub-$430 levels shows aggressive reaccumulation and gamma reinforcement from institutions. The near-term wedge consolidation is a healthy pause — not weakness. If buyers can break above $455 with conviction, the next run toward $460–$465 could unfold quickly.
However, caution remains if TSLA slips below $446, as that would reintroduce downside gamma pressure, likely driving a retest of $436–$430 before finding demand again.
Options Outlook (Oct 7–11):
* Bullish setup: Consider 455C or 460C (Oct 11 expiry) if price breaks and holds above $455 with rising volume.
* Bearish scalp: Buy 440P only if price fails at $454.91 and loses $446.60 structure support.
* IV note: IVR 30.5 with IVx 70.1 — volatility remains high, so option premiums are rich; ideal for momentum plays, not range trades.
Conclusion:
TSLA is coiled for a decisive move. The 15-min wedge suggests momentum compression, while the 1-hour GEX map shows strong support below $440 and bullish gamma flow above $450. A confirmed breakout above $455 opens room toward $460–$465, with potential to squeeze higher this week.
Disclaimer: This analysis is for educational purposes only and does not constitute financial advice. Always do your own research and manage your risk before trading.

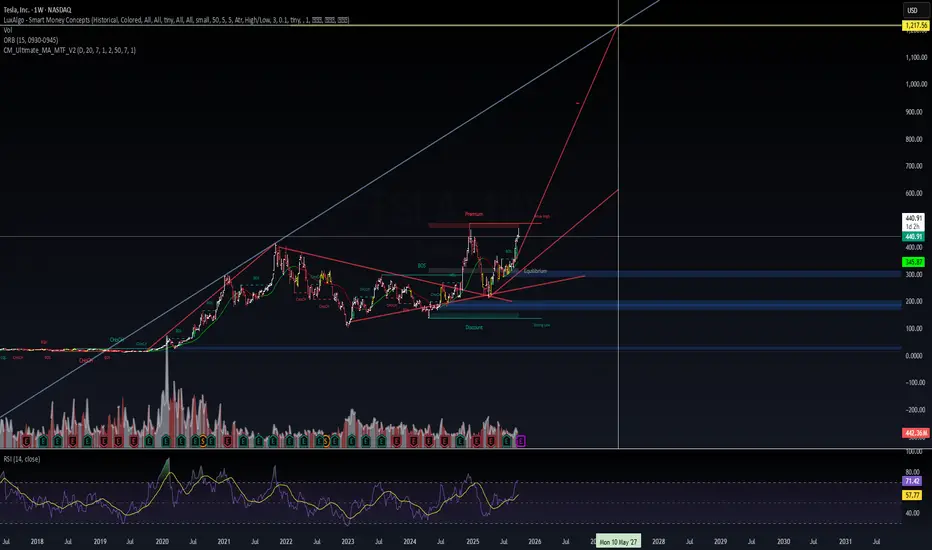
$TSLA – Weekly Outlook📊 NASDAQ:TSLA – Weekly Outlook
Price is holding above equilibrium (~400) after reclaiming structure.
Strong base formed in discount zone (~345–300) now acting as support.
RSI on weekly = 71.4 → momentum strong, trending into overbought.
Long-term projection points toward $1,217.56 (extension target).
🎯 Scenarios
Bull case (70%)
Hold >400 → momentum unlocks premium zone.
Next upside pivots: 470 → 600 → 1,217 (extension).
Bear case (30%)
Break <400 → return to equilibrium/discount at 345–300.
Fibonacci: Theory and Practice (Part 1) RetracementsThe Fibonacci proportions are a widely used technical tool in financial markets. They are based on the Fibonacci sequence, a numerical series introduced to the West by the Italian mathematician Leonardo de Pisa (13th century) after his travels in the Mediterranean (especially in Béjaïa, Algeria): 0, 1, 1, 2, 3, 5, 8, 13, 21, 34, 55, 89, 144..., where each number is the sum of the two preceding ones.
Although Ralph Nelson Elliott incorporated concepts related to Fibonacci ratios in his wave theory (published in 1938), it was Charles Collins who first explicitly used price retracements and extensions in the 1940s.
I will divide the content into three parts to enhance understanding of this approach: Fibonacci Retracements, Fibonacci Extensions, and Harmonic Alignments.
Fibonacci Ratios
In trading, the sequence itself is not used directly but rather its ratios, which approximate natural proportions observed in nature, art, and price patterns.
The ratio of any number to the next higher number approaches 0.618 after the first four numbers. For example, 1/1 is 1.00, 1/2 is 0.50, 2/3 is 0.67, 3/5 is 0.60, 5/8 is 0.625, 8/13 is 0.615, 13/21 is 0.619, etc. (pay attention to the value 0.50).
The ratio of any number to the preceding lower number is approximately 1.618, or the inverse of 0.618. For example, 13/8 is 1.625, 21/13 is 1.615, 34/21 is 1.619. The higher the numbers, the closer they get to 0.618 and 1.618.
The ratios of alternate numbers approximate 2.618 or its inverse, 0.382. For example, 13/34 is 0.382, 34/13 is 2.615.
0.786 is the square root of 0.618.
Personal Perspective on Fibonacci Proportions
None of the ratios we will explore below possess magical properties. The truly decisive factor is price action, which acts as a mirror of the collective psychology of investors. Fibonacci proportions are excellent for highlighting proportionality and harmony, aspects that directly influence participants' decisions. This is where the importance of this approach lies.
Fibonacci Retracement Adjustments
In Figure 1, you can see how to correctly draw Fibonacci retracements in an uptrend: from bottom to top, from the low of the impulse (1) (including the lower wicks or shadows) to the upper high (2) (considering its wicks or shadows). The clearer and more defined these impulses are, the greater their influence on market participants' psychology. Clarity ensures better results when studying tools, indicators, or price action.
I discard the 0.236 level in my trading, but you can include it and experiment.
Timeframe is also important to consider: applying Fibonacci on 5-minute charts, for example, would be like trying to control the ocean with a measuring tape. As I demonstrated in the article “Timeframe is Everything” , lower timeframes degrade the success rate due to the greater influence of news and rumors, high-frequency trading, lower capitalization, and interests, etc.
If the drawing is incorrect, the values will not match those in the image, and the diagonal line will point downward.
Figure 1
In Figure 2, I show the correct drawing of Fibonacci retracements in a downtrend, from top to bottom, from the high of the impulse (1) (including the lower wicks or shadows) to the low (2) (considering its wicks or shadows). If the drawing is incorrect, the values will not match, and the diagonal line will point upward.
Figure 2:
Psychology of the Ratios
Ratio 0.382
This ratio is extremely useful for avoiding premature entries in favor of the trend. In my experience, in most cases, we should wait for the price to touch the 0.382 level unless a consistent price formation justifies a trend continuation.
This level indicates a typical retracement zone, making it ideal for detecting "pauses" in strong trends. It is also necessary that entries at this and other ratios we will study are validated by price action and context.
In Figure 3, you can observe how the price offers an excellent reversal opportunity at the 0.382 Fibonacci level. A previously respected 50 EMA and a strong point like the 50% of the body of a weekly engulfing candle increase the robustness of the zone. The confirmation of price action manifests in increased volumes that may signal a likely reversal and a bullish engulfing candle.
Figure 3
I won’t provide examples in downtrends for this level, as the buying pressure inherent in market nature makes short entries based on the 0.382 level very unstable. Thus, this ratio is primarily evident in uptrends.
Ratio 0.50
It is generally believed that this ratio does not belong to the Fibonacci sequence, but 0.50 is a harmonic starting point in the progression.
It marks a balance between supply and demand, thus serving as a psychological magnet that tends to attract the price while delineating a battle zone between buyers and sellers.
In Figure 4, you can see the correct use of the level: The 0.50 ratio is perfectly aligned with the presence of a 50 SMA and price action elements like a ceiling test , offering extremely robust resistance. An island gap pattern is an excellent reversal signal to confirm a short entry.
Figure 4
In Figure 5, we observe the alignment of the 0.50 level with the presence of a large gap acting as robust support. Additionally, the level coincides with the 50% of the body of a bullish engulfing candle on a weekly chart, adding significant confidence. The price action would confirm an entry with a large bullish engulfing candle.
Figure 5
Ratio 0.618 (Golden Ratio)
The 0.618 ratio is a universal "equilibrium point" in crowd psychology; the place where many investors expect a bounce, as it represents a deep but not exhaustive correction.
Studies and tests (such as those by Robert Prechter in Elliott Wave Principle ) show that the 61.8% level appears in up to 70% of significant corrections in indices like the S&P 500 or Dow Jones, while behavioral economists argue that its "success" is more due to confirmation bias than strict causality.
In Figure 6, we observe how the golden ratio (0.618) aligns with a high order volume zone (volume profile). The noticeable weakness in price action, graphically represented in oscillators like the MACD (bearish divergence), combined with a volume spike, could provide clues about a likely rejection in the zone.
Figure 6
In Figure 7, we observe a bullish example where the 0.618 level aligns with a strong support generated by accumulation. Note how this zone shows a high order volume (volume profile). This support was also backed by a 20 EMA on a weekly chart. The price action would confirm the entry after several rejection candles.
Figure 7
Ratio 0.786
This is my favorite Fibonacci retracement ratio, and I use it exclusively to seek reversals in uptrends. It indicates trend weakness, but I like to consider it a high-probability reaction zone, as selling pressure in such a deep correction tends to be weak, while large participants or institutions may see a good opportunity to buy low.
I apply this ratio exclusively to double bottoms, as seen in Figures 8 and 9.
Figure 8
Figure 9
In Figure 8, the 0.786 level aligns with the 50% of a monthly engulfing candle and a large gap visible on the daily chart. Additionally, volume and a large engulfing candle pattern would have confirmed the entry well.
Figure 9 shows an alignment between the 0.786 level and a strong support on the daily chart. In the same zone, a 20 EMA on a weekly chart coincides. The price action confirmation manifests in compression and an explosion of bullish volatility.
Fun Facts
1-Leonardo de Pisa (or Leonardo Pisano) was born around 1170 in Pisa, Italy, and was the son of Guglielmo Bonacci, a commercial official working in North Africa.
The nickname Fibonacci comes from "filius Bonacci," which in Latin literally means "son of Bonacci." He signed his works as "Leonardo, son of Bonacci, Pisan," but the term "Fibonacci" was shortened and popularized centuries later.
2-The Fibonacci numerical series actually dates back to ancient Indian texts (such as those by Pingala in the 2nd century BC, used for poetic meter).
3-Leonardo de Pisa popularized the numerical series in Western Europe through his book, Liber Abaci (1202), where he used it to solve practical problems, such as rabbit population growth (the famous example: a pair of rabbits produces a sequence of births generating the numbers 1, 1, 2, 3, 5, 8...).
Conclusions
Fibonacci proportions are a valuable complement, but not the holy grail. In my strategies, I find them extremely useful and feel comfortable incorporating them in specific contexts, though not all systems require them. For example, I like having a Fibonacci at hand in patterns like double bottoms to identify key supports or when a price overextends or retraces strongly, delineating potential reversal zones.
I recommend that investors avoid chasing mystical numerical alignments and maintain a logical approach to each tool, method, or pattern studied.
Final Note
If you want to take a look at my analysis record, you can find my profile in Spanish, where I transparently share well-defined market entries. Send your good vibes if you enjoyed this article, and may God bless you all.
Tesla (TSLA) - Weekly Battle Before The BreakoutTicker : NASDAQ:TSLA
Timeframe : Weekly
Bias : Neutral (Awaiting breakout confirmation)
Range : $410 - $470
🧠 MARKET CONTEXT
Tesla is stuck in a wide weekly range as macro uncertainty and earnings expectations collide.
Buyers defend the $410 zone while Sellers keep rejecting $470 - a classic coiling phase before expansion.
🔎 TECHNICAL OVERVIEW
* Structure: Choppy / Distribution phase ( failed breakouts, heavy wicks, indecision )
* Resistance Zone: $465-$475 ( needs clean close above for breakout confirmation )
* Support Zone: $410-$425 ( critical area maintaining bullish structure )
* Major Support Below: $320-$360 ( long term value area where buyers historically stepped in )
📈 SCENARIOS
🟢 Bullish Case:
* Weekly close above $470 with strong volume = breakout signal.
* Targets : $500+ zone, potential retest of 2024 highs.
🔴 Bearish Case:
* Weekly close below $410 = structure break.
* Targets : $360 - $320 zone.
⚪ Neutral / Range Play:
* Between $410 - $470, range strategies work best (fade extremes, tight risk).
🌍 MACRO CONTEXT
* The FED's higher-for-longer stance keeps pressure on growth stocks.
* Q3 deliveries were strong, supporting long term sentiment.
* Competition & margin compression (China & Europe) remain risk factors.
* Tech sector volatility + geopolitical headlines amplify TSLA's swings.
📊 WEEKLY OUTLOOK SUMMARY
* Short Term (2-4 weeks) : range bound between $410-$470 - watch for volume spikes / breakout confirmation.
* Medium Term (1-3 months) : direction depends on Fed & earnings - macro + delivery data key catalysts.
* Long Term (Q1 2026+) : bullish bias intact if fundamentals hold - expect volatility during macro tightening.
💬 FINAL TAKE
Tesla is coiling between $410 and $470. Whichever side breaks first will likely define Q4's direction. Watch weekly closes and volume confirmation - "The Big Move Is Loading"
Hello trader, for tomorrow, TSLA: 453.25 10/07/2025 amBullish entry above 456.00/460.00 if the open is in this area. If the open is below 452.00, we can expect this to be the 440.00 area with a possible rebound, providing an upside opportunity. If the 440.00 level is lost, we can only enter bearishly below 436.00/432.00 (a possible downside target of 419.00) (a possible upside target of 488.54)
$TSLA - possible move pre product launchTSLA - Stock moving higher pre product launch tomorrow. Seeing multiple call buyer coming in as well. Stock is in a triangle pattern on the 4 hour time frame bouncing off bottom of the channel. Stock has top of the channel is at $470. bigger move about that level. Stock is decent at the indicator level.
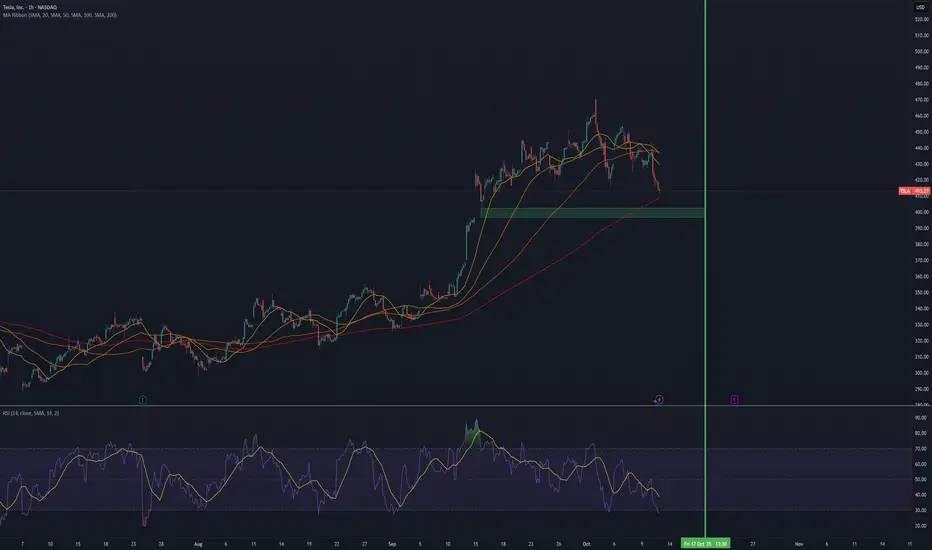
TSLA Week Ahead - ShortTSLA looks like a classic post-rally consolidation after that sharp pop from late September lows around $340. The candlesticks show solid volume on the upside thrusts (those red-to-green hammers mid-September), but we're seeing some profit-taking wicks lately, with the price hugging that rising EMA channel (orange line) around $410 support. That unfilled gap down at $396-$402 (from early October open?) is screaming "magnet" if we get any broader market weakness—gaps like that on high-beta names like TSLA often fill on light-volume Fridays, especially with no major catalysts this week.
The gap is likely to close 70% of the times in 30 day span.
What to Expect by EOD Friday (Oct 17)
No earnings till Oct 22, so this week's all about macro vibes (Fed chatter, CPI print Wed) and TSLA-specific noise like Robotaxi buzz or delivery whispers. Q3 deliveries hit 462k on Oct 2 (beat estimates), so that's baked in—focus shifts to affordable model teases.
Base Case (60% odds): Sideways grind to $415-425. We're in that expected move band of ±6% (~$388-438 from here). Light volume mid-week could keep us coiling in the channel; that gap stays open unless we dump on risk-off. Analysts are meh short-term (avg target $361, but that's 1Y noise), but one shop just hiked to $483. I'd fade any spike above $420 for a quick scalp—RSI's overbought on 1H.
Bull Case (25% odds): Push to $430+. X crowd's frothing—folks calling ATH break by 10/17 on "unstoppable momentum" and 5Y consolidation snap to $500. If CPI undershoots and Elon tweets FSD gold, we tag resistance. One forecast pegs exactly $425 EOW.
Bear Case (15% odds): Gap fill to $400. Volatility spikes if yields rip higher or China EV FUD hits (ZEV credit chatter ending soon). That purple MACD histogram's flattening—watch for divergence.
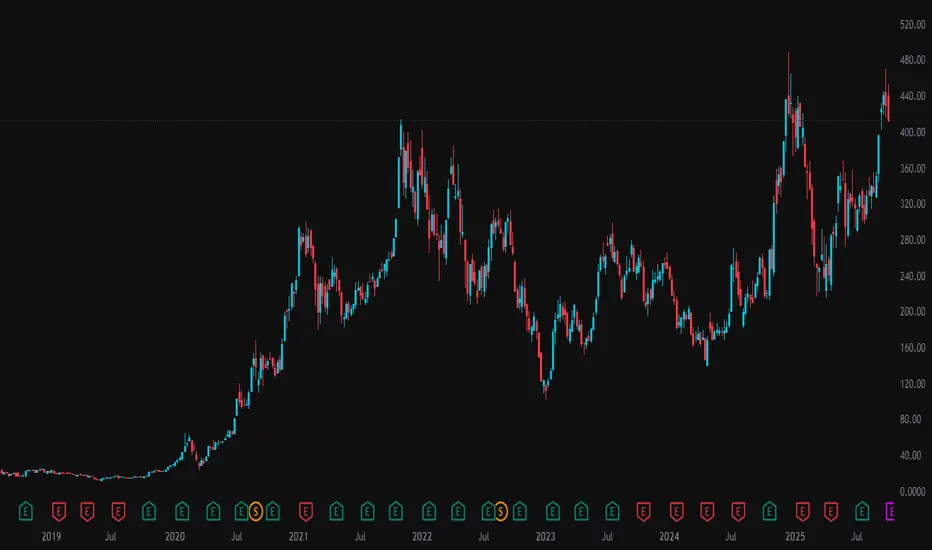
A Blow Off Top/Double Top on TESLA?Tesla's move since 9/11/25 has characteristics of a Blow Off Top
Parabolic price rise
Extremely high trading volume
Widespread optimism or “fear of missing out”
Sudden reversal and heavy selling
The high appears to match prior highs from last year, making this a double top.
Near the top, there was a period of distribution, as shareholders exited positions, creating new bagholders.

TSLA - Up ChannelAn Up Channel on TSLA
This is on the Weekly timeframe.
I expect another move up towards the top of the channel.
Moves up in the grey rectangles.
Bullish long.

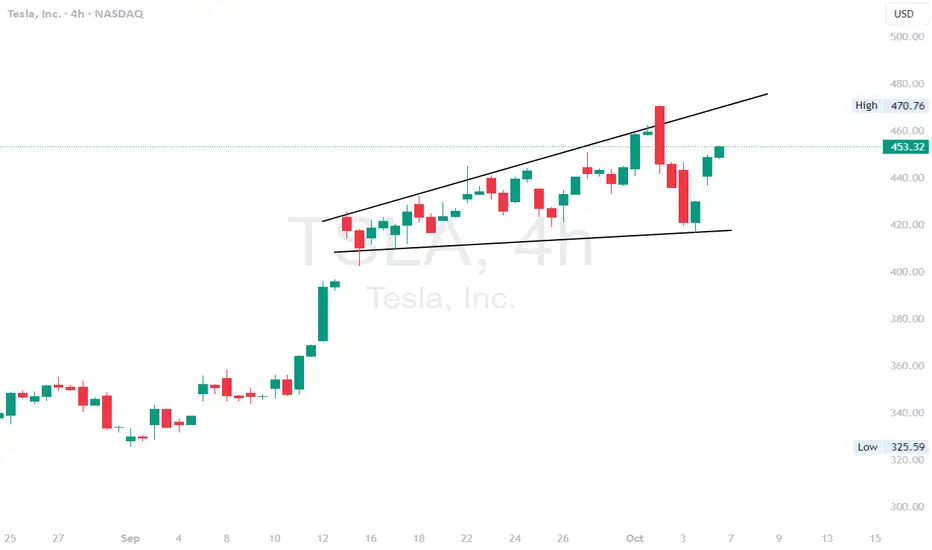
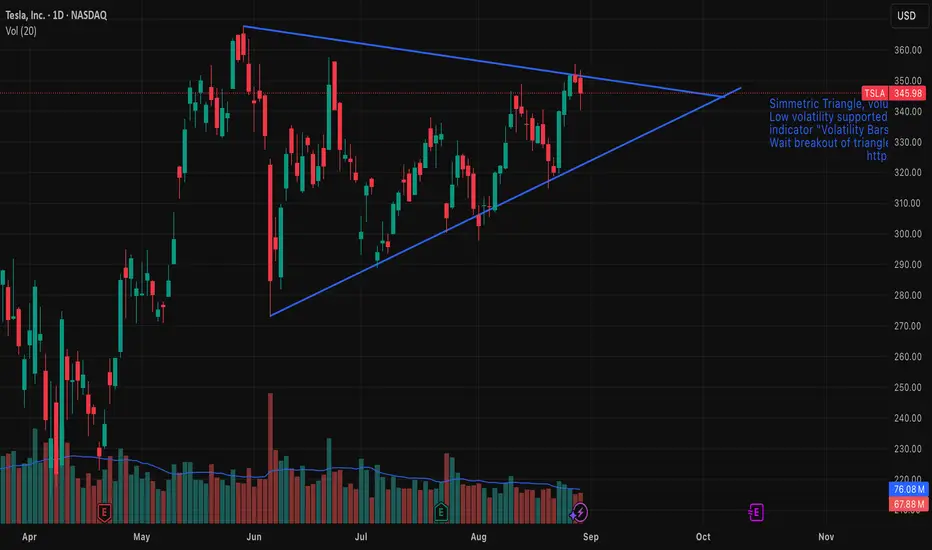
Tesla (TSLA) — Symmetrical Triangle Breakout IdeaSummary
Pattern: Symmetrical triangle on daily chart.
Expected timeframe for breakout: Within 1–2 weeks.
Targets: $367 on an upside breakout; $273 on a downside breakout.
Risk management: Use a stop-loss just outside the triangle after breakout confirmation; position size per your risk rules.
Setup & Rationale
A well-defined symmetrical triangle has formed on TSLA’s price action, characterized by converging trendlines connecting lower highs and higher lows. Volume has contracted inside the pattern, consistent with consolidation. Symmetrical triangles are neutral continuation/reversal patterns; the breakout direction provides the trading signal.
Key technical points:
Price is approaching the apex, increasing the likelihood of a decisive breakout in the next 1–2 weeks.
Volume decline during the consolidation and a volume spike on breakout would confirm conviction.
The breakout should be taken after a daily close beyond the upper or lower trendline (or after a retest), not merely intraday probes.
Entry Criteria
Upside trade: Enter long on a daily close above the upper trendline (or on a confirmed retest).
Downside trade: Enter short on a daily close below the lower trendline (or on a confirmed retest).
Targets & Measurement
Measure the pattern height (vertical distance between the initial high and low of the triangle) and project it from the breakout point.
Upside target (projected): $367.
Downside target (projected): $273.
Adjust targets proportionally if you use a measured move from the actual breakout point rather than the pattern’s maximum height.
Stops & Risk Management
Place stop-loss slightly outside the opposite trendline or beyond a recent swing point to avoid false breakouts.
Preferred approach: fixed-risk percent per trade (e.g., 1–2% of portfolio) and scale position size accordingly.
Consider tightening stops to breakeven after price clears ~50% of the distance to the target.
Confirmation: daily close beyond trendline plus above-average volume (up or down depending on direction).
Symmetrical triangles are neutral; false breakouts occur. Wait for confirmation.
News, earnings, or market-wide events can invalidate technical setups quickly—monitor catalysts.
Adjust targets/stops if volatility expands or if the breakout lacks volume confirmation.
IS TESLA ABOUT TO HAVE A SHORT SQUEEZE SOON? HERE'S WHEN!!!In this video we discussed the possibility of Tesla taking another leg higher beyond $500 and what technical signals to look out for in the charts
