TESLA - Robotaxi will drive the price above 1000This is not a short-term trade as you know from me on FX, Crypto and Indices. This is buy and hold investment. I got already good bag of share and Im still adding without trying to time if perfectly, but now I think its time to buy bigger positions.
Tesla is my 3rd biggest position after the Bitcoin and Strategy (MicroStrategy). Many people see it only as an EV cars company, but it's not all what they do, just read bellow to see why I see a huge potential in this company.
📍Why Tesla is Considered a Top Investment
Tesla stands out as a leading player in the EV market, with a strong brand and a history of delivering innovative products. In 2024, it produced about 459,000 vehicles and delivered over 495,000 in the fourth quarter alone, showcasing its ability to meet growing demand Tesla Fourth Quarter 2024 Production, Deliveries & Deployments.
💾Financially, Tesla reported $97,690 million in total revenue for 2024, with the automotive segment contributing $87,604 million and energy solutions adding $10,086 million Tesla, Inc. Annual Report on Form 10-K for 2024. This diversification into energy, alongside investments in autonomous driving, positions Tesla for long-term growth, making it attractive for investors seeking exposure to future trends in sustainability and technology.
📍What Tesla Does Beyond EV Cars
Beyond EVs, Tesla is deeply involved in energy solutions:
📍Solar Products: Offers solar panels and solar roofs for clean energy generation.
📍Energy Storage: Provides Powerwall for homes and Megapack for large-scale projects, helping stabilize grids and manage energy costs.
📍Charging Infrastructure: Operates a network of Supercharger stations, increasingly open to other EVs.
Services: Includes vehicle maintenance through service centers and body shops.
📍Robotaxi: Plans to launch a fully autonomous ride-hailing service in June 2025 in Austin, Texas, potentially opening new revenue streams Tesla's robotaxis by June? Musk turns to Texas for hands-off regulation.
📍Tesla Optimus: Developing a general-purpose robotic humanoid for tasks like household chores or industrial work, which could lead to new markets.
This expansion into energy and services, along with unexpected ventures like Robotaxi and Tesla Optimus, enhances Tesla's role in the transition to sustainable energy and technology, offering benefits like grid stability and potential robotics applications.
The growth in the energy segment, with a 67% increase from 2023 to 2024, highlights Tesla's expanding role in sustainability, potentially attracting investors focused on long-term trends. Additionally, Tesla's commitment to innovation, particularly in autonomous driving technology, is noteworthy. The company is developing features like Full Self-Driving (FSD), which could open new revenue streams, such as robotaxi services, enhancing its investment appeal.
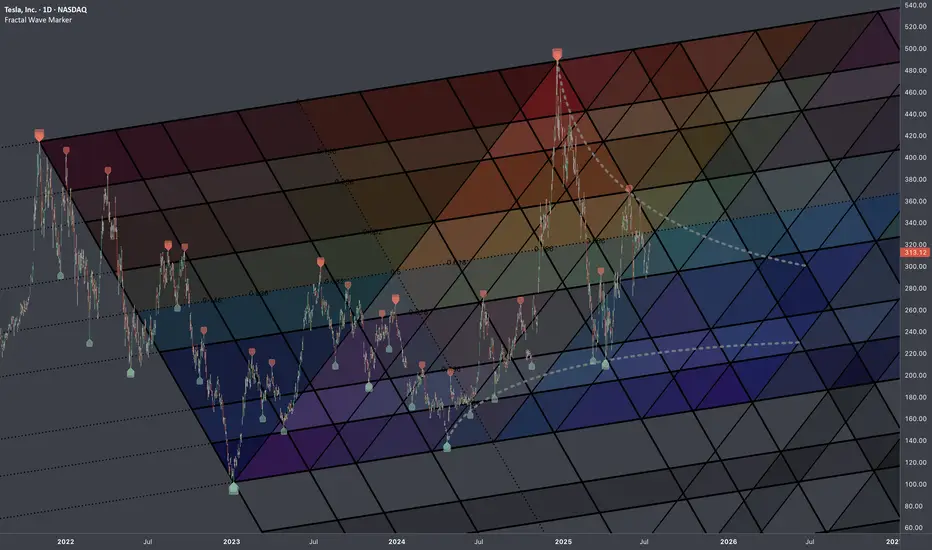
🤔I think Optimus and Robotaxi will exceed rapidly exceed their EV cars revenue. Elon musk is predicing over 1000% growth in 5 years. Which would be way above $2900 without stocks splits.
I m a bit conservative and I think we can go somewhere between 3 - 4 standard deviations.
Wishing you continued success on your trading journey. May this educational post inspire you to become an even better trader!
“Adapt what is useful, reject what is useless, and add what is specifically your own.”
Perfectly nailed bottom around 200 and our positions are now 50% in profit good luck
David Perk ⚔
TSLA trade ideas

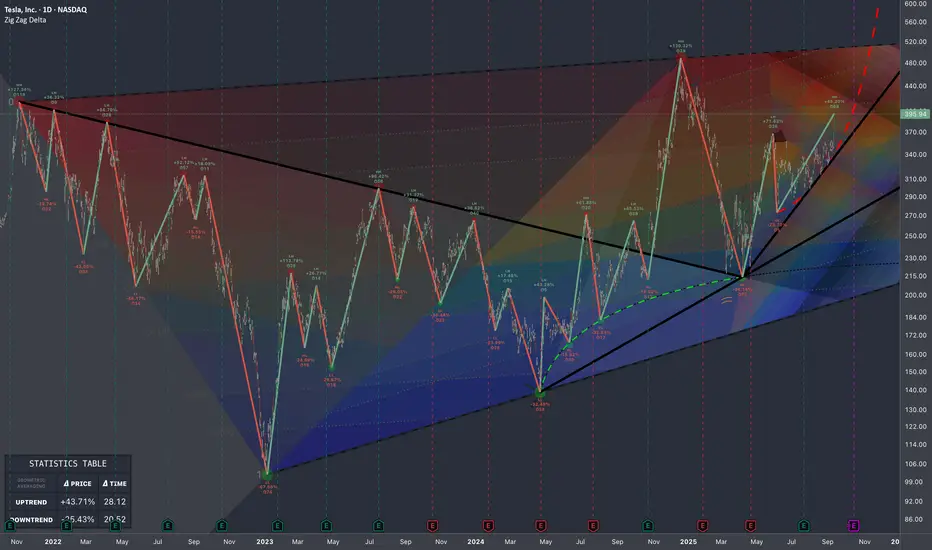
$TSLA: Fib InterconnectionsResearch Notes
Examining interconnection type with regressive angle:
Critical points:
Mapping with 3 fibonacci channels:
TSLA Technical Outlook – Symmetrical Triangle Breakout Watch🚗 TSLA Technical Outlook – Symmetrical Triangle Breakout Watch
Ticker: TSLA (Tesla, Inc.)
Timeframe: 30-minute candles
🔍 Current Setup
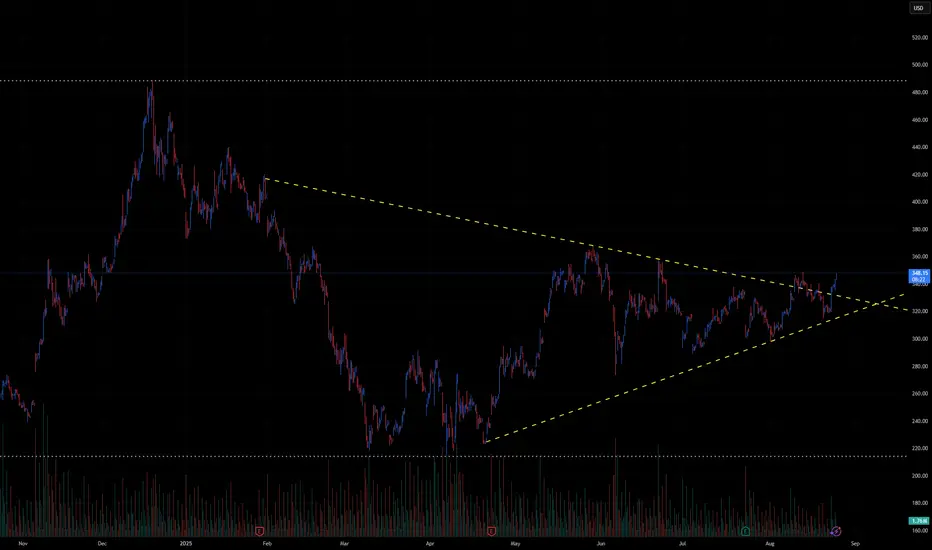
TSLA has been consolidating for months inside a large symmetrical triangle, marked by:
Descending resistance: from ~380 down to ~347.
Ascending support: from April lows near ~240, now rising toward ~320.
Current price: ~348, testing the upper boundary of the triangle.
This structure signals compression after a major downtrend, and the breakout direction will likely define TSLA’s next big move.
📊 Breakout Levels
🚀 Upside (Bullish Scenario)
Trigger: Break and close above 350–355.
Intermediate Targets:
370–380 → First resistance zone.
400–420 → Extension levels.
Measured Move Target: ~450+ (based on the triangle height projection).
🔻 Downside (Bearish Scenario)
Trigger: Failure at resistance and break below 320, confirmation under 310.
Intermediate Supports:
300 → Psychological level.
280–260 → Stronger support zone.
Measured Move Target: ~250 (triangle projection downward).
📈 Volume Analysis
Volume has been contracting steadily during the triangle’s formation.
A major volume spike will be key to confirming whichever direction TSLA chooses.
⚖️ Probability Bias
TSLA is at the make-or-break resistance zone (~350).
A breakout above 355 would strongly favor bulls, targeting 380 → 400+.
But a rejection here and break below 320 would shift momentum bearish, sending TSLA back toward 280–260.
✅ Takeaway
TSLA is at a critical inflection point inside a long-term triangle:
Bullish Break > 355: Targets 370 → 400 → 450+
Bearish Break < 320: Targets 300 → 280 → 250
Watch for volume-backed confirmation, as this move could define Tesla’s next multi-week trend.

Long TESLATrading Fam,
Today my indicator has signaled a BUY on $TSLA. The technicals align. M pattern looks to have completed at strong support (RED TL) and is bouncing upwards inside of a solid liquidity block. Buyers are stepping in. I'm in at $315 and will shoot for $430 (probably taking some profit along the way). My SL is currently $241 but will trail as we enter profit.
Best,
Stew

TSLA support $324.48 has to hold for longTSLA bounced off $35 range support this morning on 4 hour was oversold. Needs to hold $324.48 bottom of uptrend support to see wave 5 target of $426 otherwise the trade is no longer valid and will need to wait for another support and oversold condition to go long

Long way to go - BEARISHNASDAQ:TSLA still has a long runway before robotaxis deliver meaningful revenue or global car sales improve (if at all). Lower rates are a prerequisite and execution from Musk remains critical. Despite the chatter, this is not a bullish breakout. It’s a large symmetrical triangle forming as we enter seasonally weak months, with global EV sales slowing, robotaxi rollout lagging, and ongoing political overhang.

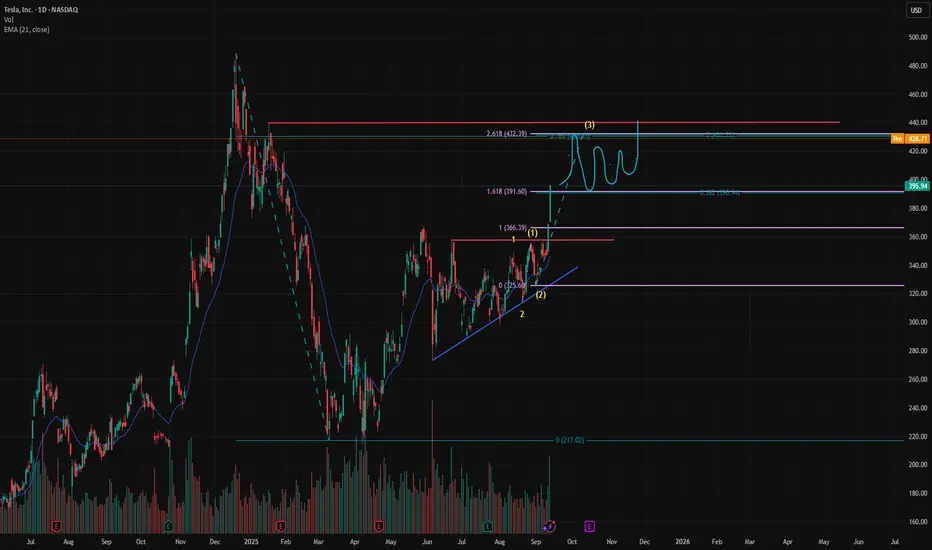
TSLA: WAVE CTSLA has been consolidating within a range since early June and is expected to breakout over the next few weeks. As the markets are due to end a minor wave 4, the final wave 5 should allow TSLA to breakout out to the upside to a potential target of $422.

$TSLA first target $430-$440 rangeNASDAQ:TSLA 2.618 extension is at $432. Expecting a consolidation from this range, when I'll be adding to my position.
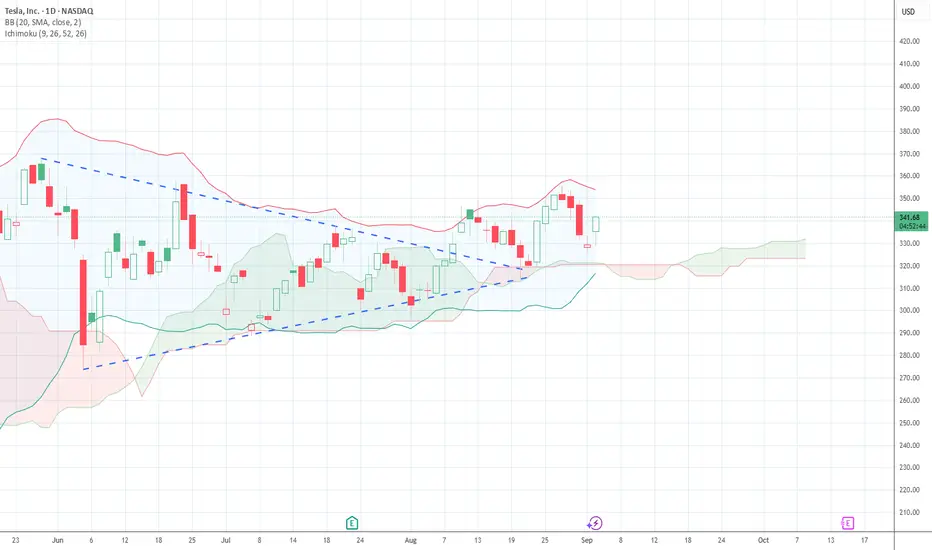
$TSLA Approaching Noisy Area?Tesla has been on a tear the past 2 days. It's difficult to catch the top and I may be wrong, but we're approaching a noisy area when following the trend line in the daily & weekly chart. I think it will re-trace back downwards.

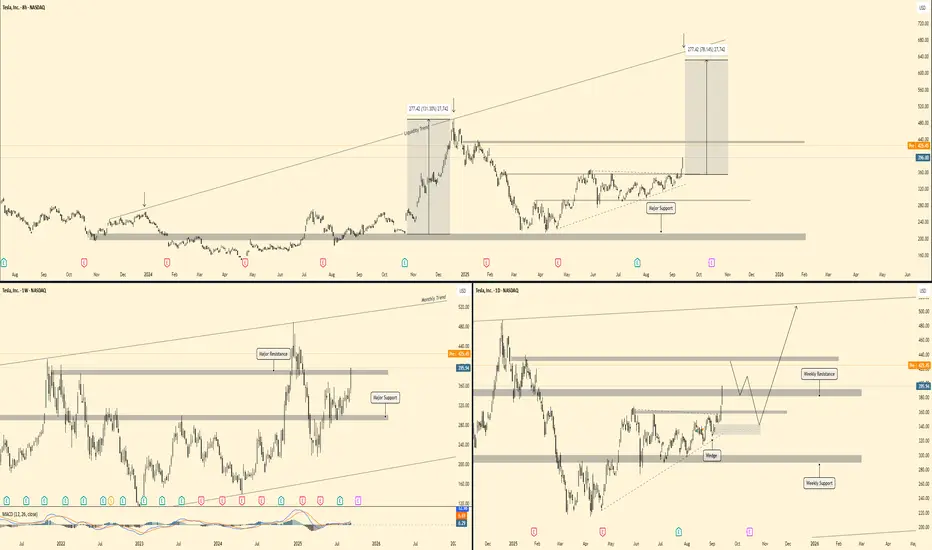
Tesla - Forecast (Before and After)🕰 Weekly View
Price is holding above major support at 325–340 and pushing into weekly resistance around 420–440. The broader monthly trend points higher, with upside liquidity aligned toward the 500–520 zone.
📉 Daily Structure
Resistance: 420–440 supply zone.
Support: 325–340 demand zone, with a secondary base near 280.
Price has broken from a wedge formation and is now testing overhead supply, with potential to retest support before continuation.
⏱ 8H Breakdown
Tesla has been trending steadily upward off major support. Clean structure shows momentum building. A breakout and retest scenario could drive price toward 500+ targets, while failure at 420–440 could cause a pullback into 360–380 support.
🔎 Outlook
Scenario 1 → Retest support (360–380) before continuation higher.
Scenario 2 → Clean breakout above 440 accelerates into 500–520 zone.
Bias : Bullish continuation → mid-term target 500+.
Tesla's $395.94 Price: Bullish Cup-and-Handle Setup Suggests Bre
Current Price: $395.94
Direction: LONG
Targets:
- T1 = $410.00
- T2 = $430.00
Stop Levels:
- S1 = $385.00
- S2 = $375.00
**Wisdom of Professional Traders:**
This analysis synthesizes insights from thousands of professional traders and market experts, leveraging collective intelligence to identify high-probability trade setups. The cup-and-handle formation in Tesla's price chart has generated considerable attention among seasoned investors, who generally consider it a strong bullish continuation pattern. This consensus suggests that Tesla's stock has robust momentum approaching critical breakout points. Observing key support levels while aligning with price trends is the cornerstone of this thesis.
**Key Insights:**
Tesla has been trading within a consolidative range over recent weeks, forming a bullish cup-and-handle chart pattern. The "handle" phase, indicative of a slight correction or pause after the cup-like curve, suggests that investor sentiment remains cautiously optimistic, waiting for key resistance levels to break. The $400 psychological barrier acts as interim resistance, but once breached, technical indicators point to the possibility of upward momentum extending toward $410 and beyond.
The RSI (Relative Strength Index) remains below overheated levels, indicating room for further bullish movement. Volume-weighted price action reinforces Tesla's resilience, as buyers appear to regain control after each minor dip. Furthermore, institutional traders have indicated increasing interest around this asset, implying confidence in Tesla’s long-term trajectory.
**Recent Performance:**
Tesla’s price has climbed steadily over the past month, rebounding from a low of $365 and rallying toward the current price of $395.94. The stock has exhibited an impressive ability to recuperate losses following volatility spurred by macroeconomic developments. Despite temporary periods of nervous selling, Tesla has surpassed its 50-day moving average with signs of continued strength. This movement has been aided by lower-than-expected inflation data, which fuels broader equity market optimism.
**Expert Analysis:**
Technical analysts have underscored Tesla’s structural integrity, specifically pointing at the cup-and-handle pattern as a textbook bullish configuration. Experts note that a sustained close above $400 could trigger aggressive buying interest from trend-following traders. Meanwhile, fundamental investors remain focused on Tesla’s growth prospects in EV battery technology and autonomous driving innovations, which support the company’s narrative as a potential market disruptor. On the technical front, Tesla’s MACD (Moving Average Convergence Divergence) indicator has started to turn positive, supporting upward price action.
**News Impact:**
Tesla recently announced advancements in its full self-driving (FSD) software and increased its footprint in international markets. These developments have sparked optimism among investors, particularly as governments worldwide tighten regulations on emissions and favor green technology initiatives. Moreover, reports of Tesla’s cost-cutting measures in battery production have strengthened its competitive advantage within the EV market. These factors provide a compelling narrative for bulls seeking to capitalize on its technological edge and market dominance.
**Trading Recommendation:**
Given Tesla’s bullish technical setup and fundamental resilience, initiating a LONG position at the current price of $395.94 is recommended. Targeting $410 and $430 ensures alignment with major resistance points, while employing stop levels at $385 and $375 protects against market retracements. Combining price action analysis with Tesla’s growing market visibility supports this trading recommendation. Traders should monitor volume levels closely for confirmation of a breakout beyond key psychological resistance zones.
Do you want to save hours every week?

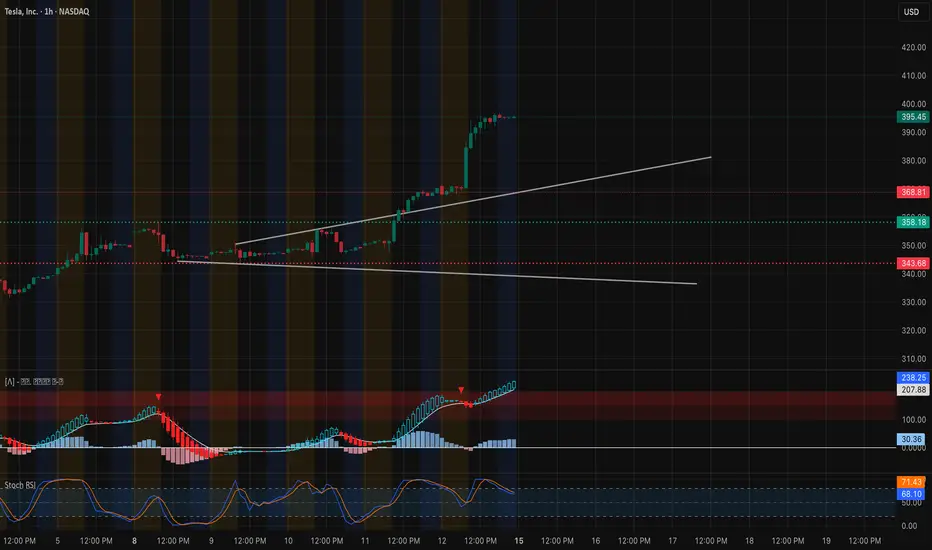
TSLA Eyes $400 Breakout — Key Levels & Trade Plans for Sep.15Market Preview
* Macro backdrop: U.S. index futures are steady after a strong tech rally last week. Rates and the dollar remain stable, leaving room for growth stocks to extend gains.
* Sector tone: EV and AI-related momentum is strong, with Tesla leading on heavy volume and institutional call buying.
Technical Analysis – TSLA
Trend & Structure (1-Hour Chart)
* Price surged to $395–396 and is consolidating near the highs.
* Structure remains firmly bullish with higher highs/lows and a well-defined rising channel.
Key Levels
* Resistance: $396.6 (highest positive NETGEX / CALL Resistance), $405, and $420 as next upside targets.
* Support: $389.9 (near-term pivot), $368.8 (major breakout base), $347.5 (HVL zone).
Momentum & Indicators
* MACD on 1H is bullish and expanding, supporting continuation.
* Stoch RSI is near overbought, signaling possible brief consolidation or a minor pullback before another leg higher.
* Volume remains strong, showing solid institutional demand.
Options/GEX Insight
* Massive call positioning (≈98% call bias) with positive GEX layers up to $420 suggests market makers may support higher prices.
* IVR 17.4 and IVx avg 61.5 indicate elevated but manageable volatility.
Trade Scenarios for Sept 15
* Bullish Plan:
* Entry: Break/hold above $396.6 with volume.
* Targets: $405 → $420.
* Stop: Below $389.9.
* Defensive Plan (if rejection occurs):
* Entry: Loss of $389.9 with momentum shift.
* Targets: $368.8 → $347.5.
* Stop: Above $396.6.
Summary
Tesla heads into Monday with a strong bullish setup. Holding above $389.9 keeps momentum intact, while a breakout over $396.6 could trigger a run toward $405–420.
Disclaimer: This analysis is for educational purposes only and does not constitute financial advice. Always do your own research and manage risk before trading.
$TSLA Daily Bands Finally TightNASDAQ:TSLA daily bands are finally tight. Can see a bigger move here. OTM calls came in at the lows this morning. 350C 11/21/25 @ 25.43 for 2.5 million
TSLA bull run to $500 before the end of 2025Based on the recent breakout from the triangle pattern, it seems like Tesla is ready to start a bullish run to reach the previous all time high of $488 before the end of 2025.
Once it reaches that resistance level, $500+ will be possible for 2026.
If you decided to trade in Tesla for the upcoming months, check out the current support levels to pick a stop loss according to your Risk - Reward parameters.

TeslaLevels Ive had for Tesla to hit for the last few months. Seems like we are getting there. Most likely will get there by Feb-March 2026 at the latest before a HUGE DROP.

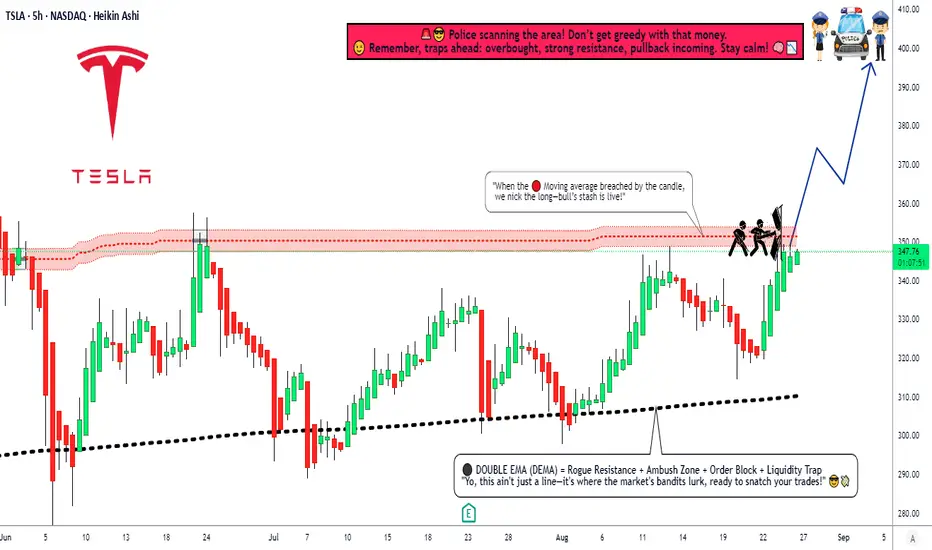
TSLA Breakout Play: Time to Steal Some Profits?🚨 TESLA INC (TSLA) HEIST PLAN - BULLISH SWING/Day LAYUP! 🚨
Yo, Thief OG's! 🐱👤🤑 Time to swarm the TSLA vault. The blueprint is set for a major bullish score. Our intel says the cops (bears) are losing their grip. Let's get this money! 💰💸✨
🎯 THE MASTER PLAN: BULLISH BREAKOUT (PENDING ORDERS)
Based on the Thief Trading Style™ technical analysis, we're plotting a bullish heist on TSLA. We wait for the breakout confirmation, then we strike with precision using our layered entry strategy.
Asset: TESLA INC (TSLA)
Trade Type: Swing / Day Trade
Bias: BULLISH ⬆️⚡
📍 ENTRY: THE HEIST INITIATES (SET YOUR ALARMS! ⏰)
Primary Entry: Breakout and close above $355.00 ⚡
THIEF'S LAYERED ENTRY STRATEGY: 🎯
Don't go all in at one price! We use multiple limit orders to layer into the position after the breakout confirms the move. This is how the pros (and thieves) do it!
Layer 1: Breakout Entry @ $355.00
Layer 2: Pullback Entry @ $350.00
Layer 3: Pullback Entry @ $345.00
Layer 4: Pullback Entry @ $340.00
Layer 5: Pullback Entry @ $335.00
(You can add more layers based on your own capital and risk appetite, you savage!)
📌 IMPORTANT: SET A TRADINGVIEW ALARM at $355.00! This is your signal that the heist is a GO! Don't get caught sleeping. 🛌💤
🛑 STOP LOSS: THE ESCAPE ROUTE
Thief SL for Breakout Entry: $320.00
⚠️ HEAR ME, HEAR ME! Dear Ladies & Gentleman (Thief OG's), adjust your SL based on your own strategy & risk! I am not your financial advisor; I'm just the guy with the blueprint. 🗺️ Place your SL ONLY AFTER the breakout happens. Protect your capital at all costs!
🎯 TARGET: CASH OUT & VANISH
Primary Target: $400.00 🚀
The police barricade is thick up there! 🚓🚧 Once the money is in the bag, don't get greedy! Escape with the stolen profits before they catch you!
Note: Dear Thief OG's, I am not recommending you use only my TP. Take profits at your own risk and based on your own analysis. Secure the bag when YOU feel comfortable! 💼🔥
💎 THIEF'S FINAL WORDS:
This is not a gamble; it's a calculated heist. Follow the plan, manage your risk, and let's eat! 🍽️
Hit the LIKE button if you're riding with us! ✅
BOOST this idea to empower the thief community! 💪❤️
Follow for more daily heist plans! 🎯
Stay sharp, stay profitable, and remember... in the market, be a thief, not a victim! 🐱💻🚀
NASDAQ:TSLA #TradingView #StockMarket #TradingPlan #SwingTrading #DayTrading #Investing #Bullish #TESLA #ThiefTradingStyle
Check if it can rise above 347.21
Hello, traders!
Follow us to get the latest updates quickly.
Have a great day!
-------------------------------------
(TSLA 1D chart)
The key is to determine which direction the price breaks out of the two support and resistance areas of 268.07-311.48 and 347.21-382.40.
For a step-up trend to occur, the price must remain above 334.09-347.21.
However, a step-up trend is highly likely only if the price rises above the support and resistance levels of 382.40 and 421.06 on the 1W and 1M charts.
Even so, a larger increase is likely if the price rises above the 334.09-347.21 range on the 1D chart.
-
The 268.07-311.48 range also falls within the HA-High indicator.
Therefore, it's important to remember that the current position is not a buy position, but rather a sell position.
However, for new buys, it's best to initiate them when support is found near the M-Signal indicator on the 1M chart, if possible.
Therefore, when the 268.07-311.48 range acts as a support zone, it can be considered a buying opportunity.
However, since it's within the HA-High indicator zone, trades should be executed with short and quick responses.
The key volatility period is around October 7th, but before that, we should check the movements around September 5th and September 12th.
At this time, the trend is likely to be determined by which direction the price moves: the 268.07-311.48 range or the 347.21-382.40 range.
-
Thank you for reading to the end.
I wish you successful trading.
--------------------------------------------------

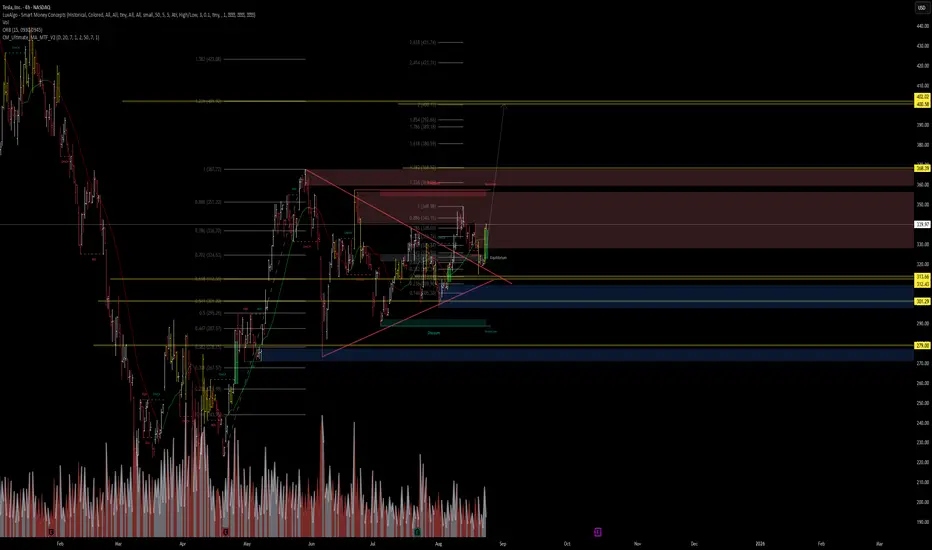
TSLA: AI + Technicals Meets Macro TailwindsAI Forecast (VolanX Protocol)
Current Price: $340.01
30-Day Target: $387.70 → +14.0% upside
Institutional Trade Plan:
Entry: $340.01
Stop Loss: $314.45
Targets: $346.81 / $387.70
Risk/Reward: 1.87:1
Model Agreement: 8/9 bullish
Technical Structure (4H Chart):
Broke above a triangular consolidation, now testing equilibrium from below.
Key support levels: $313.60 / $301.30 (discount zone).
Resistance / extension zones lined up at:
First: $368–$369
Extended: $400–$402 (1.618–2.618 fib levels).
Macro Catalysts & Market Context:
Fed Rate Sentiment Improving: Powell hinted at possible September rate cuts; markets rallied with Tesla leading, rising 6%.
Value Sense Blog
+6
Barron's
+6
Investors
+6
Investopedia
+1
EV Tax Credit Flexibility: New IRS guidance allows buyers to secure the $7,500 credit via contracts before Sept 30, potentially boosting demand.
Investors
+1
Mixed Q2 Fundamentals: Q2 saw declining deliveries & regulatory credits; Musk warned of “rough quarters” ahead, but emphasized AI & robotaxi growth.
Investors
+6
Investors
+6
New York Post
+6
Geopolitical Risks & Tariffs: Tariff pressure, fading EV credits, and sales underperformance in key regions keep long-term risks present. Analyst targets range widely.
Investopedia
MarketWatch
Value Sense Blog
Investors
Probabilistic Outcome Mix:
Base Case (50%) → $346–$368 (near-term resistance test aligned with AI target)
Bull Extension (25%) → $387–$402 if macro tailwinds persist and structure sustains breakout
Bear Risk (25%) → Breakdown below $340 could retest $313–$301
Trade Setup Breakdown:
Long Entry: $340
Stop: $315
Take Profit #1: $368
Take Profit #2: $388
Option: scale into $400s if breakout momentum holds
Why It Matters:
This setup represents AI-driven momentum meeting technical trend alignment and favorable macro catalysts. If Fed signals, EV policy flexibility, and optimism around Tesla’s AI/autonomy can power continued upside, $387–$400 becomes very plausible. However, macro risks and execution hurdles need monitoring.
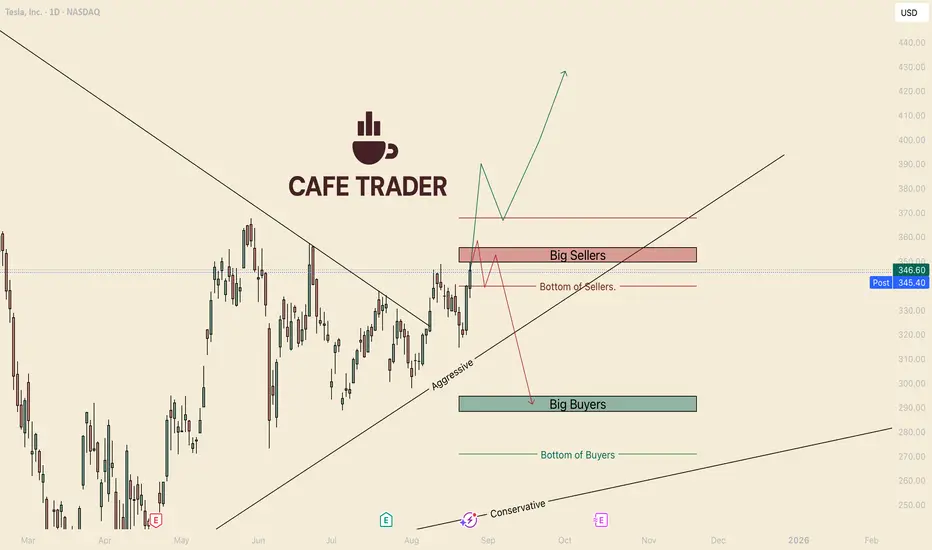
TESLA's Make it or Break it WeekHello I am the Cafe Trader.
Today we are taking another look at Tesla. Everyone knows what a beast this has been in the past, I am going to prep you on what to do when awakens.
As of today, we sit under the last strong seller before the 400's, breaking this and holding (a close above on a Friday) would make a strong case to test highs (minimum).
Overall, I still think there is a strong case for the downside, but this seller determines everything. This is due to the time we have been in the top of the range. So here are your two scenarios
Green Scenario
If Tesla can push through the strong seller zone (roughly 350–365) and actually close above it, then bulls would gain full control. That opens the door for a continuation move toward 400+.
If this happens, I will publish some trade ideas with a new chart.
Red Scenario
If This Seller continues to flush out these buyers, this could spark a large reaction to the downside. In that situation we would be looking for a move back into the big buyer zone around 290. A failure there could drag us all the way to the conservative trend line near 270.
Personally I lean short biased in the next 2-4 weeks, Very bullish over the next few years.
Hope you enjoyed, please DM or comment with questions or another stock you would like analyzed.
Happy Trading
@thecafetrader
LONG | TSLA NASDAQ:TSLA
TSLA is pressing against a key confluence zone $352–$356 (TP1), aligning with daily and weekly resistance. A confirmed breakout could open the path toward $367 (TP2) and $404 (TP3) in the medium term.
Supports: $326 / $318 – must hold to maintain bullish momentum.
Bias: Bullish if above $326; consolidation or pullback likely if rejected at $356.
A monthly close above $367 would confirm a long-term cup breakout, projecting toward the $500 area over the next cycles.

$TSLA Financials: Q2 vs Q1🏛️ Research Notes
A climb to even sub-ATH levels signals profound market irrationality, implying Tesla not only recovered its losses but has also reversed a widespread, likely permanent, client boycott across its key markets (US, EU, Canada). The closer examination of Q2 fundamentals ahead of the Q3 2025 release would be a great help.
⚖️ Q2 vs Q1
Revenue Decline : Revenue fell -12% YoY, automotive sales down -16% → confirms weakness in U.S., EU, and China.
Gross Margins : Erosion continued as price cuts + BYD competition intensified.
Operating Income : Dropped -42% YoY, reflecting higher expenses + lower leverage.
Net Income : Down -16% YoY → analysts’ earnings downgrades justified.
Cash Flow & Liquidity : Free cash flow fell, inventory buildup worsened liquidity strain.
Balance Sheet : Inventory levels rising as deliveries lag production.
Short-term : Bounce faces major resistance near supply zones — failure to break higher could trap late buyers.
Mid-term: With Q2 confirming Q1 risks, the bull case weakens unless Q3 shows clear recovery in demand and margins.
Long-term: Competitive pressures (BYD, Chinese EVs, European slump) + high CapEx needs keep pressure on liquidity and valuation.
🛟 What to Watch in Q3
Delivery Numbers : Any rebound in U.S., China, or Europe sales will be critical to reversing revenue decline.
Margin Stabilization : If Tesla can offset price cuts with cost savings or improvement in production efficiency
Cybertruck Performance : Demand recovery and reduced recall issues are needed to restore confidence in new models.
Inventory Levels : Watch if inventory growth slows - otherwise more discounting and margin erosion likely.
Cash Flow Trends : Improvement in operating cash flow would ease liquidity fears.
CapEx & R&D : How much Tesla spends on batteries, autonomy, and AI vs. how much cash it burns will be closely watched.
Institutional Sentiment : If big funds divest, rallies may keep fading at resistance.
Tesla’s bounce still looks more like a retail-driven relief rally than the start of a sustainable reversal. Q2 earnings show deterioration across key financial metrics. In Q3, watch whether Tesla can stabilize sales, margins, and cash flow failure to do so keeps the path of least resistance to the downside.
The Anatomy of a TSLA Retracement TradeBased on a detailed analysis of Tesla's recent price action, a compelling bearish thesis suggests that the stock is poised for a significant retracement. The current market structure indicates that the recent rally may be unsustainable, necessitating a retest of a critical support level to re-establish a more stable foundation.
The Bearish Hypothesis: Retracement to Trendline Support
The core thesis is that the price is set to retrace and test the integrity of the ascending diagonal support trendline. This is not an indication of a full trend reversal, but rather a high-probability correction. T
This corrective phase will likely see the price descend to the lower boundary of the channel. A retest of this key support trendline is a common and healthy technical pattern.
Trade: A short position could be considered upon a clear rejection at the recent highs or upon a decisive breakdown of a minor support level, with the primary profit target being the ascending diagonal support trendline.
