TESLA BULLISH BREAKOUT|LONG|
✅TESLA is going up
Now and the stocks is trying to
Made a bullish breakout
Of the key horizontal
Level of 367.50$ and IF breakout
Is confirmed we will be expecting
A further bullish move up
LONG🚀
✅Like and subscribe to never miss a new idea!✅
TSLA trade ideas

Tesla: New Alternative Scenario Emerges Tesla continues to face significant upward pressure, repeatedly testing resistance at $373.04. As a result, we have dropped our previous alternative scenario of an early sell-off in favor of a new upside alternative. We now see a 37% chance that the stock will break above the $373.04 resistance, forming an early top for beige wave alt.x above the next key level at $405.54. However, our primary expectation is that TSLA will first pull back into our green Target Zone between $273.11 and $231.66, where we anticipate the low of green wave . Thus, this range could present new short- to medium-term long entry opportunities to capitalize on the subsequently expected rally, which is likely to culminate in the regular wave x high above $405.54. Following this top, we expect the final sell-off phase within the broader corrective structure: wave y should drive price down into the beige Target Zone between $157.88 and $46.70, where we project the low of blue wave (II). This range could present attractive opportunities for longer-term long positions. For potential long trades—whether in the green or the beige zone—a stop set 1% below the lower boundary of the respective zone can help manage risk.

WXY structure with a double topTesla has been in a uptrend with a corrective structure WXY. I am not sure if the WXY is a part of wave 5 terminal structure or a B wave. However expecting a double top or 78.6 retrace to 425-430 range as a minimum. For this scenario, an impulsive upside move is expected within the next few weeks. However the price needs to move back into the channel next week as a first step.

TESLA TO $410 SOON? (September 7, 2025)In this video, we look at Tesla stock from numerous time frames together at the evidence presented for new all-time highs

TSLA 45Minutes Time frameTSLA 45-Minute Snapshot
Current Price: $346.97 USD
Change: +0.18% from the previous close
Intraday Range: Not available
🔎 Technical Indicators
RSI (14): 53.64 — Neutral
MACD: 1.78 — Buy signal
Moving Averages:
5-period SMA: $347.01 — Sell signal
10-period SMA: $346.78 — Buy signal
20-period SMA: $347.82 — Sell signal
50-period SMA: $340.53 — Buy signal
📈 Market Sentiment
Pivot Points:
R1: $347.52
R2: $348.18
R3: $348.95
S1: $345.32
S2: $344.65
S3: $343.99
📅 Outlook
Bullish Scenario: A breakout above $347.52 could lead to a push toward $348.18 and higher.
Bearish Scenario: A drop below $345.32 may test support around $344.65.
Overall Bias: Neutral to slightly bullish, with mixed signals from moving averages.

TSLA 4Hour Time frame 📊 Tesla (TSLA) Snapshot
Current Price: ~$346.97
Recent Range: ~$325 – $358
Intraday Change: Small gain (~+0.2%)
🔎 Key Levels (4H Focus)
Resistance: ~$347 – $351 (immediate ceiling)
Support: ~$325 – $330 (key downside buffer)
📉 Technical Indicators
RSI (14): ~57 → neutral with slight bullish bias
MACD: Positive → upward momentum
Moving Averages: Price trading above 20, 50, 200-period moving averages → bullish trend
Stochastics: Neutral → no overbought/oversold condition
📌 4-Hour Outlook
Bullish Scenario: Break above $347–348 could push price toward $358+.
Bearish Scenario: Drop below $330–332 could test support around $325.
Overall Bias: Moderately bullish; momentum positive but needs to clear resistance for acceleration.
✅ Conclusion: On the 4-hour chart, TSLA is in a moderate bullish phase, trading above key moving averages. The key battle zone is $347–351 for resistance, and $325–330 provides support in case of a pullback.
Follow-through buying on TSLA?Following a one-sided 6.0% gain in Tesla’s share price on Thursday, this helped lift the S&P 500 and Nasdaq to fresh records. As shown in the chart below, the TSLA Stock rallied through a 6M resistance level of US$360.03 to a high of US$368.99, levels which have not been seen since earlier this year.
Further buying could now be seen for the Stock towards the resistance between US$389.72 and US$383.09. However, before reaching said area, a pullback may occur, retesting US$360.03 as support, with a dip into 1M support from US$343.88 possible.
Written by the FP Markets Research Team

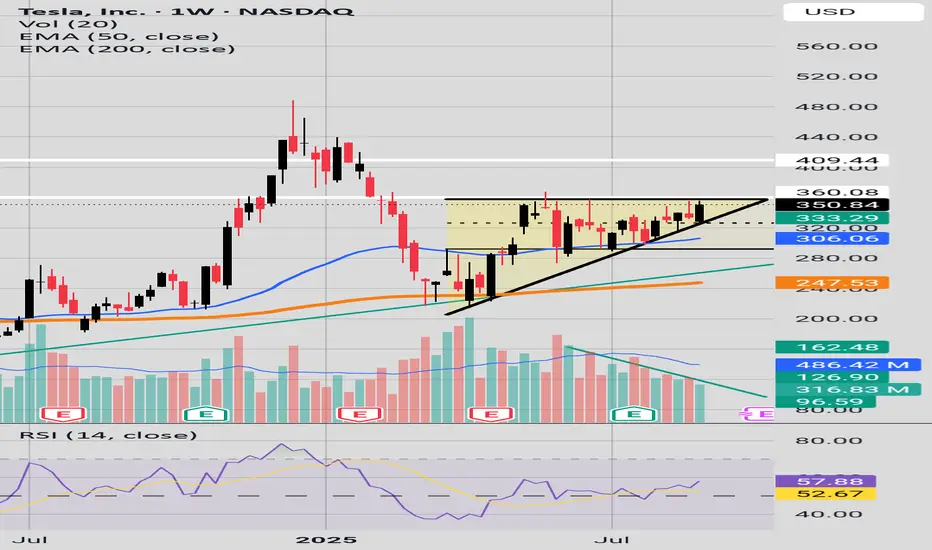
$TSLA - channel breakout on the daily. possible $400 soonTSLA - Stock finally seeing channel breakout after long consolidation. calls above $370 looking good for a move towards $378 and $400. Stock is decent at indicator. needs to hold $365 to hold the breakout move.


TSLA Market Preview for Monday, September 8, 2025,
Price Action & Market Structure
* TSLA is trading around 354–356, up +3.6% overnight, showing relative strength compared to SPY.
* Price broke out of a descending wedge, now consolidating near upper channel resistance.
* Momentum is cooling after the strong overnight run, but structure remains bullish unless price loses 352 support.
Key Levels
* Resistance Zones (Upside Targets):
* 357.5–360 → Near-term rejection zone.
* 362.5 → 365.0 → GEX cluster + Call Wall resistance.
* 370.0 → Major Gamma Wall / Highest positive NET GEX.
* Support Zones (Downside Risk):
* 352.8–354.0 → Local breakout retest support.
* 343.8–345.0 → Strong structural support + previous demand zone.
* 335.0 → HVL anchor + Put hedge support.
Options Sentiment (GEX & IV)
* GEX: Balanced but slightly tilted bullish → Calls 49.4% vs Puts 3.5%.
* IVR: Low at 8.5, options are cheap → potential for strong directional move.
* Gamma Walls:
* 370 → Strong Call Wall (cap).
* 335 → Strong Put Support (floor).
This positioning suggests TSLA is “boxed” between 335 support vs 370 resistance, with intraday swings possible.
Indicators
* MACD (15m): Just made a bearish crossover after extended green histogram → short-term pullback risk.
* Stoch RSI: Rolling down from overbought → signals cooling momentum.
Scenarios for Today
Bullish Case (favored if 352 holds):
* Hold 352–354 support → reclaim 357.5.
* Targets: 362.5 → 365 test, with potential extension to 370 Gamma Wall.
Bearish Case (watch if 352 breaks):
* Lose 352 → retrace quickly to 345 zone.
* If heavy market weakness (SPY fails), could extend to 335 HVL.
Trading Thoughts
* Scalp Longs: Look for bounces near 352–354 support, aiming for 360+.
* Fade Shorts: If price rejects 357.5–360 zone without volume confirmation.
* Stops:
* Longs → below 352.
* Shorts → above 360.5.
Summary
TSLA remains stronge as long as 352 holds, bulls have room to test 360–365 and possibly squeeze toward 370. If 352 fails, expect a deeper retrace to 345–335. Options flow leans bullish, but intraday volatility is likely.
⚠️ This analysis is for educational purposes only, not financial advice. Manage risk and confirm with live price action before trading.

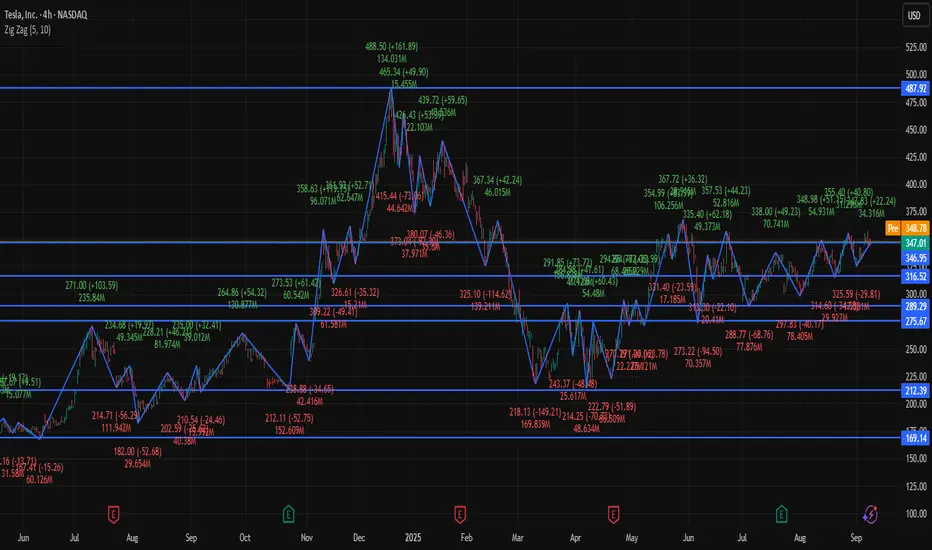
Inflection PointWe have now and ascending triangle forming with key resistance around the 360$ price area.
RSI is above 50.
Volume levels drying up.
Are we soon going to get a possible breakout to the 400$ price levels are a retreat to the green trend line around 290$?
TESLA Under Pressure! SELL!
My dear followers,
This is my opinion on the TESLA next move:
The asset is approaching an important pivot point 350.79
Bias - Bearish
Safe Stop Loss - 354.45
Technical Indicators: Supper Trend generates a clear short signal while Pivot Point HL is currently determining the overall Bearish trend of the market.
Goal - 343.14
About Used Indicators:
For more efficient signals, super-trend is used in combination with other indicators like Pivot Points.
Disclosure: I am part of Trade Nation's Influencer program and receive a monthly fee for using their TradingView charts in my analysis.
———————————
WISH YOU ALL LUCK

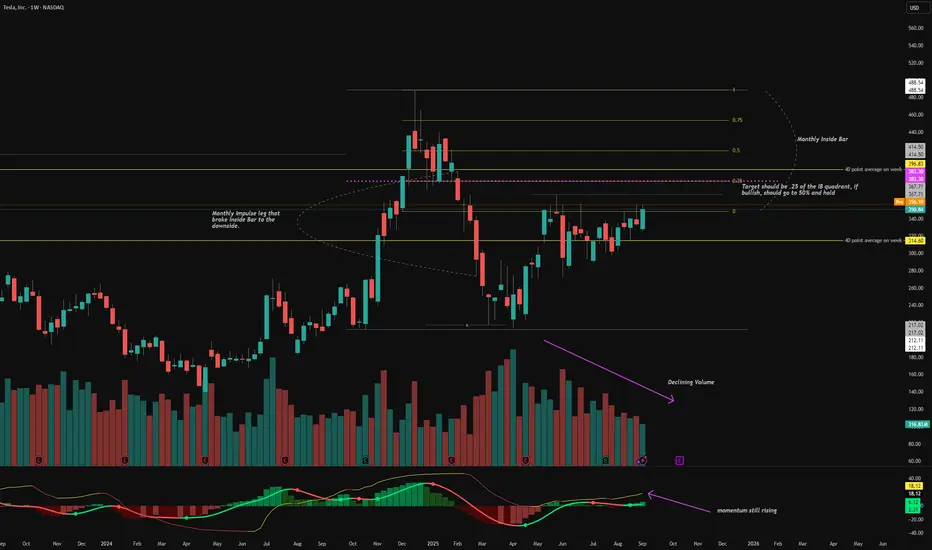
TSLA - LongTSLA looks to be heading to the 25% of the Inside Bar on the monthly. Need to have strict risk management on this incase it falls through. Weekly looks good, with targets of 25% and 50% of the Inside Bar quadrant. TSLA also moves an average 40 points per week, so the upside looks more accurate then downside.
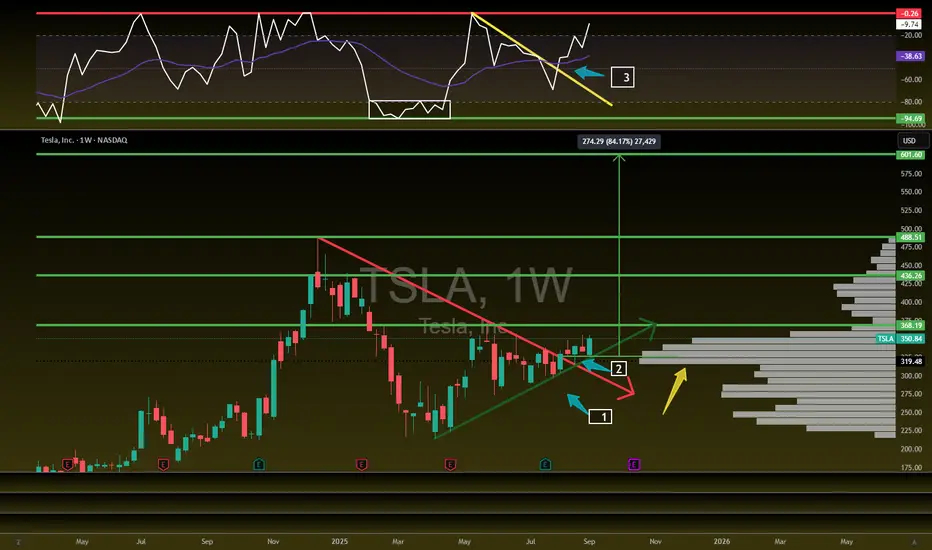
Tesla Looks Primed!NASDAQ:TSLA Looks primed!
Bullish as all getup!
Breaking out-Volume Shelf-Bullish Willy
Targets: $368/ 436/ 488/ 601
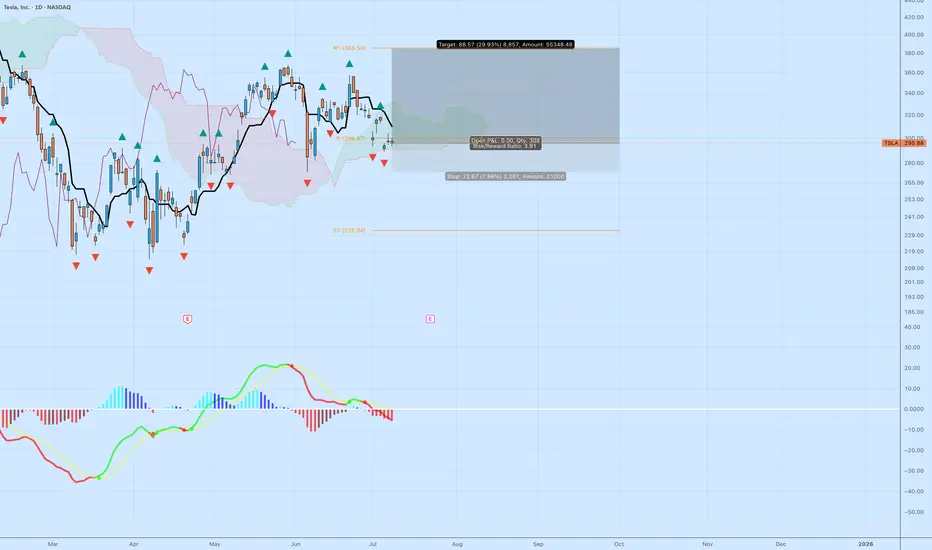
TSLA: High R/R Bounce Play Off the Cloud EdgeTesla NASDAQ:TSLA is sitting at a decision point — testing the edge of the Ichimoku cloud while momentum resets. The setup isn’t confirmed, but the risk/reward is compelling for those watching structure.
🔍 Technical Breakdown
Cloud Support: Price is holding right at the top of the cloud. A breakdown would signal trend weakness, but for now, it's a potential bounce zone.
MACD: Momentum has cooled off, but no bullish crossover yet. Early signs of a flattening histogram could suggest a pivot.
Structure: Horizontal support near $292–295 has held multiple times. If this zone holds again, the upside target opens up quickly.
🎯 Trade Specs
Entry: $296.88
Target: $385.50 (+29.93%)
Stop: $274.21 (–7.66%)
Risk/Reward: 3.91 — solid asymmetry
💡 Trading Insight:
This isn’t about calling bottoms — it’s about defining risk. When price compresses at known support, and you’ve got a 3.9 R/R profile, you don’t need to be right often to be profitable.
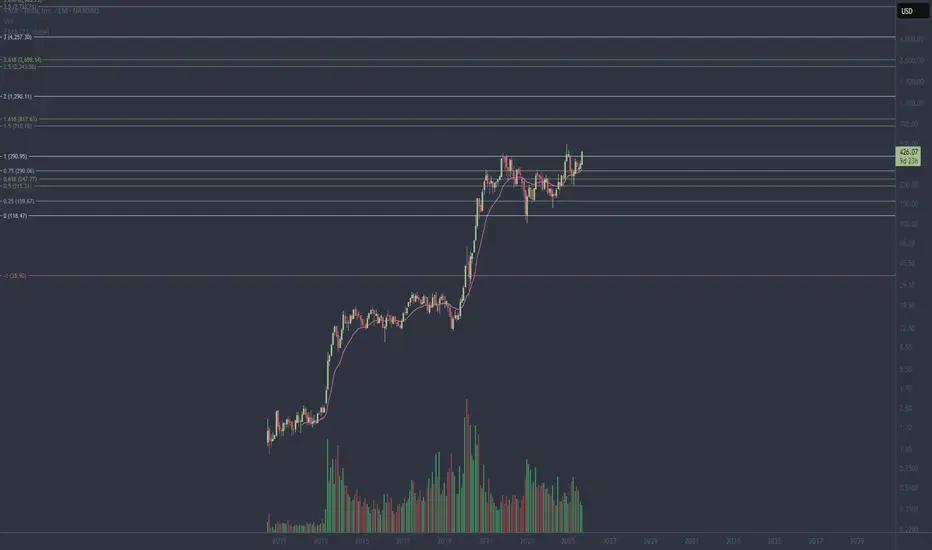
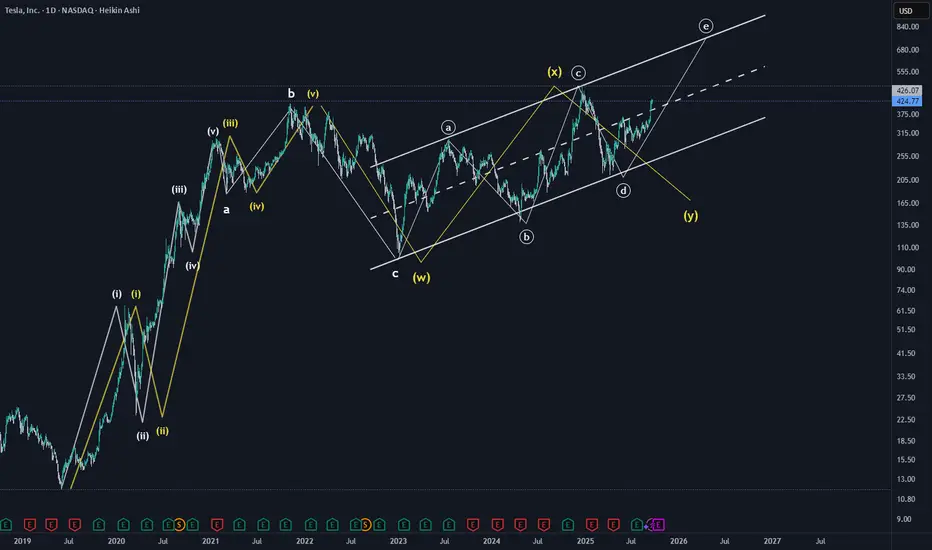
Bullish and Bearish Macro wave patternsThis chart provides a bullish and bearish wave pattern for Tesla. Even though the recent move was very impulsive, both bullish and bearish scenarios are equally possible. This is because the impulsive move seems to be wave C of either X wave or ending diagonal (E of ABCDE).
White represents Bullish scenario and Yellow represents bearish scenario.
Minimum Target reached for the C wave.
Note
**Disclaimer** : All details shared here is for educational purpose only. Please do your own research and consider appropriate risk management before making short term or long-term investment decisions.
Approach Market always with probabilities and make sure risk management in place.
Request your support by like, comment and follow
Ok TSLA.... holding or pullback?TSLA rocked & today it printed a dark cloud candle. Pullback perhaps?
Tesla typically can rally when things look bleak for the rest of the market. However, after that billion dollar move up, maybe we have a pull back before earnings. Or will we range?
<420/420 maybe retest the gap?
That's what I'm looking for.

TSLA Breakout Watch for Sept 18 – Bulls Testing Key Supply LevelHere’s my fresh read on Tesla heading into Wednesday’s session
1️⃣ Market Structure & Price Action
* Clean breakout attempt: TSLA pierced the descending trendline drawn from last week’s highs and closed around $429, holding above the 9 EMA and reclaiming short-term momentum.
* Support shelf: $421–422 zone (prior supply) flipped to support. This is the first line of defense on any early dip.
* Upside pivot: Price is grinding along an ascending intraday trendline that points toward the $435–440 area if momentum keeps up.
2️⃣ GEX (Options Flow) Insight
* Call dominance: Call flow is heavy with ~90% call premium, IVR ~19.6 (low), and IVx ~65.3 (normalizing).
* Big call walls: $432.5 and $436 show strong gamma with 67%+ call concentration, which can attract price if bulls stay in charge.
* Put defense: Major put support sits at $412–417.5. A break below $412 would flip sentiment and invite a fast move to $400.
3️⃣ Trade Thoughts
* Bullish swing / scalp: Buy pullbacks into $423–426 with a stop under $421. Targets $435, stretch $440+.
* Bearish fade: Only if TSLA loses $421 and the hourly closes below it. First target $409, extended $400.
4️⃣ Option Angle
* With call interest stacked and IV still moderate, short-dated call spreads or debit spreads around $430/$440 look attractive for a measured upside shot.
* Aggressive traders could sell puts below $410 for premium, but that’s only if you’re comfortable owning shares on a breakdown.
5️⃣ Personal Take
I like the constructive action. Tesla cleared a multi-day squeeze and is running with the broader tech bid. As long as $421 holds, the path of least resistance is up. I’m watching volume on any morning retest—if buyers show up, I’ll lean long.
Disclaimer: This commentary is for educational discussion only and not financial advice. Always do your own research and manage risk before trading.

My Journey to Building the Adaptive Opening EdgeMy Journey to Building the Adaptive Opening Edge
Like many of you aspiring traders, I was once chasing shortcuts.
I wanted to get rich quick, to find the easiest way out.
Over 10 years ago, I first learned about trading through my mom. I got curious, started exploring, and went on a hunt for the “holy grail.” The history is always the same — I blew up account after account before I finally turned profitable.
The Missing Puzzle
I realized the key wasn’t some secret indicator or magic formula. It was me.
I needed to work on my fundamentals, my psychology, and my discipline.
At the same time, I felt there was a gap in the market — no tool truly fit the trading philosophy I was developing. I wasn’t looking for certainty; I wanted a way to stack probabilities and build expectancy.
Building the Signal
So I invested in myself.
📚 I spent hours in libraries.
💻 I learned coding and logic.
🧩 I started piecing together the type of tool I wished existed.
That’s how the Adaptive Opening Edge was born.
It wasn’t about predicting the future. It was about building a system that:
Risks a fixed % per trade
Avoids overnight risk entirely
Is robust (not overfit, not curve-fitted)
Focuses on expectancy, not win rate
From Testing to Trading
I backtested, forward tested, and finally went live.
I fine-tuned the code, but never broke its logic to “force” more wins. I needed it to be durable — able to handle randomness without collapsing.
For the first time in my trading career, I saw an equity curve I could trust.
The Real Breakthrough
The breakthrough wasn’t just the signal.
It was the combination of:
A robust tool (Adaptive Opening Edge)
The discipline to follow rules without deviation
The patience to let the law of large numbers play out
Trading stopped being about outcome.
It became about process.
Losses stopped hurting — they were just part of the data. Wins stopped exciting me — they were simply the advance payments of my expectancy.
Where I Am Today
I no longer chase predictions.
I don’t need the holy grail.
I’ve built a signal that reflects the way I believe trading should be:
Probability-driven
Rules-based
Consistent over the long run
That’s why I share my trades live on YouTube — every entry, every stop, every exit, no filters.
Final Note
The Adaptive Opening Edge isn’t about being right 100% of the time.
It’s about playing the same game the casinos play — exploiting a small, consistent edge over hundreds of hands.
If you want to learn more about the signal, buzz me.
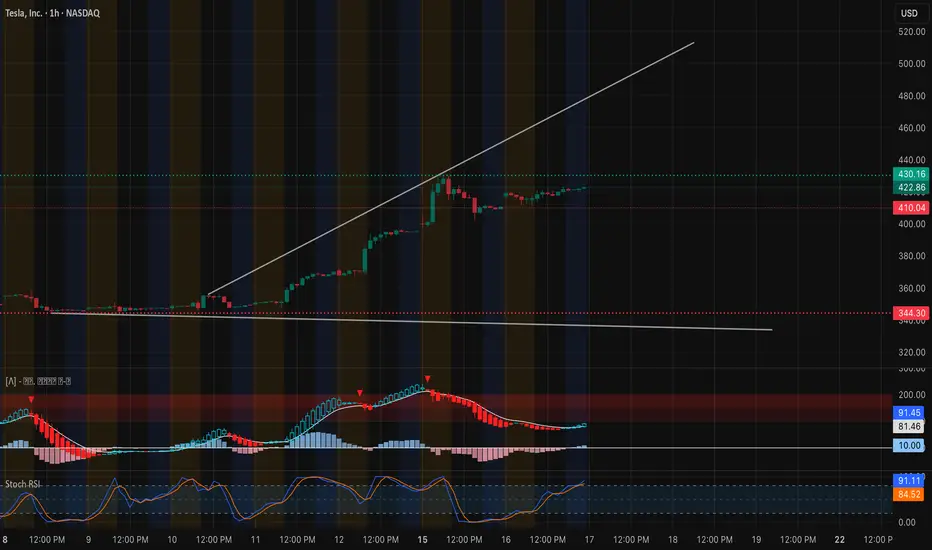
TSLA: Pausing at Key Zone – Swing & Scalp Setups for Sept 171-Hour Chart Technical View
Tesla’s rally from sub-$350 to the $420 area is now consolidating. After an explosive breakout on Sept 12–13, the 1-hour candles are moving sideways in a tight $410–$430 box. MACD has cooled from overbought and is starting to curl back up, while Stoch RSI is hovering in a neutral zone—showing that momentum is recharging, not reversing.
* Immediate Support: $410 (critical breakout retest)
* Major Support: $344 (key demand and high-volume node)
* Near-Term Resistance: $430–$440 (current supply zone)
* Upside Magnet: $450 and $484 if $440 clears with volume
EMA alignment (9 above 21) still favors the bulls, and price continues to respect the uptrend line from the early September pivot.
GEX & Options Flow
Options data underline strong bullish hedging pressure:
* Call Walls: $430 (2nd call wall), $440 (highest positive NET GEX / gamma resistance), $450 next target.
* Put Walls: $407.5 (1st defense), then $385 and $322.5.
* GEX Bias: Calls dominate with 92.8% call-weighted exposure. IVR at 20.1 (IVx ~65.9)
suggests decent option premiums but not extreme volatility pricing.
This configuration typically supports dip buying and favors upward grind, provided $410 stays intact.
Trade Thoughts & Suggestions
* Swing Idea: Accumulation on 1-hour closes above $410 with a stop below $400, aiming for $440–$450, and possibly $484 on continuation.
* Scalp Idea: Intraday traders can fade extremes inside the $410–$430 range, or take a momentum scalp if $430 breaks on strong volume.
* Bearish Scenario: A decisive break under $400 could unwind gamma support and invite a test of $385 and $344.
Quick Take
TSLA is digesting sharp gains in a healthy range. Strong call gamma at $430–$440 is both a near-term lid and a potential springboard. For Sept 17, look for continuation plays if $430 is taken out with conviction.
Disclaimer: This analysis is for educational purposes only and does not constitute financial advice. Always do your own research and manage risk before trading.
Yes, Elon Musk Buys $1 billion of Tesla Stock - $TSLAYes, Elon Musk bought approximately $1 billion worth of Tesla stock on September 15, 2025. We had a nice Fib retracement buy zone on this one around $214-$235 levels. We got in late ourselves and got in at $340. As a value play, this stock still trades at premium valuations, hovering near $410 per share with a trailing P/E above 200x—far higher than both traditional automakers and most growth tech peers.
Risks remain significant. Competition from Chinese rivals, ongoing price cuts that pressure vehicle margins, and regulatory challenges in key markets raise questions about how sustainable current profitability will be. For trading purposes, I would never short the stock, but buy oversold dips and swing trade it.
--------------------------------------------------------------------------------------
Disclaimer:
I do not provide personal investment advice and I am not a qualified licensed investment advisor. I am an amateur investor.
All information found here, including any ideas, opinions, views, predictions, forecasts, commentaries, suggestions, or stock picks, expressed or implied herein, are for informational, entertainment or educational purposes only and should not be construed as personal investment advice. While the information provided is believed to be accurate, it may include errors or inaccuracies. I will not and cannot be held liable for any actions you take as a result of anything you read here.
Conduct your own due diligence, or consult a licensed financial advisor or broker before making any and all investment decisions. Any investments, trades, speculations, or decisions made on the basis of any information found on here, expressed or implied herein, are committed at your own risk, financial or otherwise.
Feel free to give us a follow and shoot us a like for more analysis updates.

CUP AND HANDLE $TSLA TO $515 MINIMUMThe cup and handle is a bullish chart pattern commonly used by traders to spot potential buying opportunities. It features a rounded "cup" formation followed by a slight downward drift forming the "handle." This pattern typically signals a continuation of an upward trend once the handle completes its consolidation phase.
ROBOTAXI BOOM
BUY NOW NASDAQ:TSLL NASDAQ:TSLA
