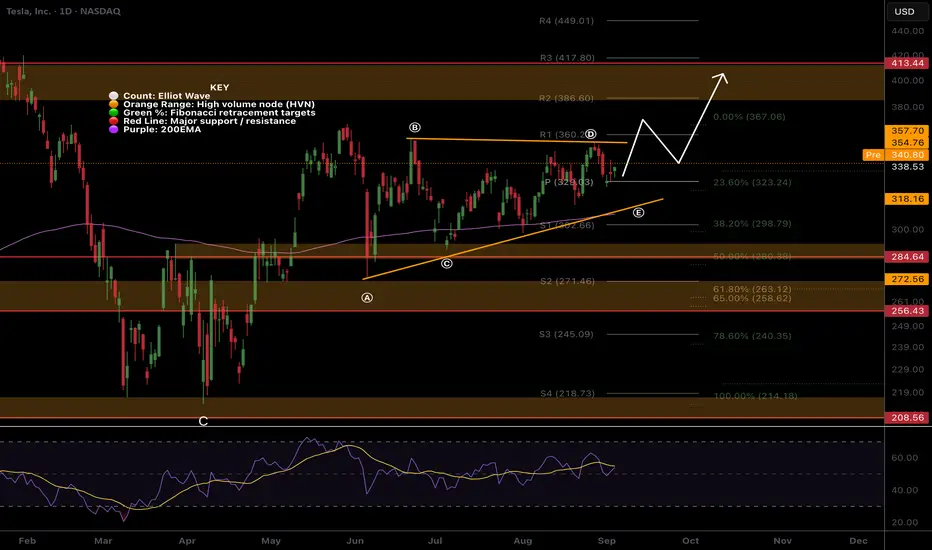
Long TESLATrading Fam,
Today my indicator has signaled a BUY on $TSLA. The technicals align. M pattern looks to have completed at strong support (RED TL) and is bouncing upwards inside of a solid liquidity block. Buyers are stepping in. I'm in at $315 and will shoot for $430 (probably taking some profit along the way). My SL is currently $241 but will trail as we enter profit.
Best,
Stew
TSLA trade ideas


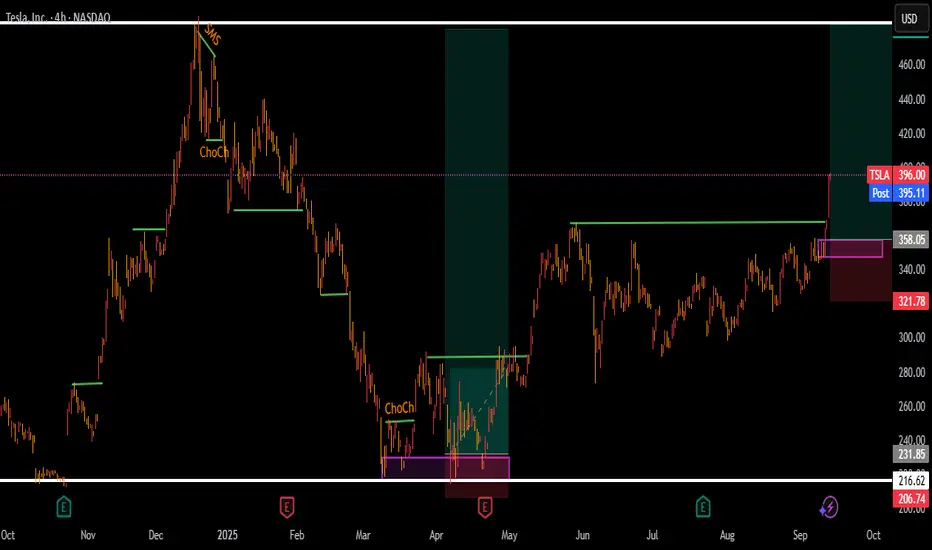
TSLA bull run to $500 before the end of 2025Based on the recent breakout from the triangle pattern, it seems like Tesla is ready to start a bullish run to reach the previous all time high of $488 before the end of 2025.
Once it reaches that resistance level, $500+ will be possible for 2026.
If you decided to trade in Tesla for the upcoming months, check out the current support levels to pick a stop loss according to your Risk - Reward parameters.

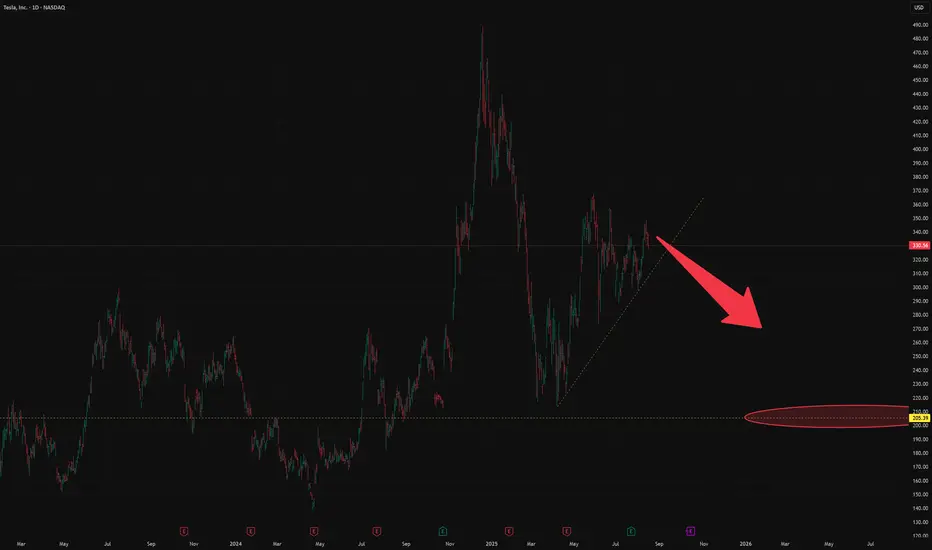
TeslaLevels Ive had for Tesla to hit for the last few months. Seems like we are getting there. Most likely will get there by Feb-March 2026 at the latest before a HUGE DROP.

LONG | TSLA NASDAQ:TSLA
TSLA is pressing against a key confluence zone $352–$356 (TP1), aligning with daily and weekly resistance. A confirmed breakout could open the path toward $367 (TP2) and $404 (TP3) in the medium term.
Supports: $326 / $318 – must hold to maintain bullish momentum.
Bias: Bullish if above $326; consolidation or pullback likely if rejected at $356.
A monthly close above $367 would confirm a long-term cup breakout, projecting toward the $500 area over the next cycles.

Tesla Financials: Q1 2025The market is currently staging a short-term rally - essentially a speculative mean reversion bounce as a reaction to -55% crash from all-time high. This move appears driven largely by retail traders seizing what it perceives as a rare opportunity to accumulate an oversold "large-caps".
While retail participation and opportunistic capital are supporting the current bounce, this alone is insufficient to sustain a full recovery. As the price approaches higher levels, particularly near key supply zones, it will likely encounter significant resistance, resulting in reversal.
Let's not forget the fact that figures in Tesla’s Q4 '24 financial report initiated bearish sentiment among institutional investors which resulted in market crash. Similarly, the upcoming Q1 earnings report presents a clear downside risk, as the significant events throughout this quarter will inevitably be reflected in the financial figures!
Anticipated impact of significant developments on Tesla’s Q1 2025 Financial Statements
🛑 Revenue Decline
• U.S. Market Weakness: Lower-than-anticipated vehicle sales in the U.S. directly reduce automotive revenue.
• Severe European Slump: A significant 76% sales decline in Germany and weakness elsewhere in Europe will notably reduce international revenues.
• Chinese Market Challenges: A substantial 49% sales drop in China will negatively affect one of Tesla’s crucial growth markets.
• Cybertruck Weakness and Recalls: Reduced demand and multiple recalls of Cybertruck models further erode revenue growth.
• Resale Value Decline and Trade-Ins: Increased vehicle trade-ins indicate lower demand, causing inventory buildup, discounting pressures, and further sales reductions.
🛑 Gross Margin Erosion
• Price Reductions and Sales Incentives: Competitive pressures and lower demand likely forced Tesla to reduce vehicle prices and offer incentives, compressing gross margins.
• Increased Competition from BYD: BYD’s advanced battery technology (providing 400 km of range in just 5 minutes of charging) pressures Tesla to increase R&D spending or cut prices further, negatively affecting margins.
• Production Challenges (Supply Chain and Battery Issues): Ongoing global supply chain disruptions and difficulties scaling battery production significantly increase manufacturing costs, further squeezing gross margins.
🛑 Increased Operating Expenses
• Recall Costs and Legal Expenses: Vehicle recalls, along with lawsuits related to product issues such as phantom braking, will significantly increase warranty provisions, legal fees, and related operating expenses.
• Protests and Vandalism Costs: Public backlash and vandalism necessitate additional expenditures on security, facility repairs, and public relations initiatives.
• Employee Turnover Costs: Departures of key personnel result in increased recruiting, training, onboarding, and severance expenses.
🛑 Net Income and EPS Impact
• Analyst Earnings Downgrades: Already-reduced EPS projections by major analysts suggest Tesla will likely report earnings below expectations, reflecting revenue shortfalls and elevated expenses.
• $1.4 Billion Financial Discrepancy: If confirmed or unresolved, this discrepancy could lead to substantial asset impairments, restatements, or write-downs, negatively impacting net income and earnings per share (EPS).
🛑 Cash Flow and Liquidity Pressures
• Lower Operating Cash Flows: Reduced revenue coupled with rising operating costs (including recalls, lawsuits, security, and PR spending) severely diminish cash generated from business operations.
• Increased Capital Expenditures: Additional CapEx is likely required to address battery production bottlenecks and delays in autonomous driving technology development, resulting in elevated investing cash outflows.
• Investor Divestment and Stock Volatility: Negative investor sentiment could lead to costly equity financing conditions if Tesla needs to raise capital, adversely affecting financing cash flows and liquidity.
🛑 Balance Sheet Risks
• Rising Inventory Levels: Weak sales combined with continued vehicle production may lead to increased inventory levels, reducing cash and potentially requiring markdowns or provisions.
• Debt and Liquidity Challenges: Deteriorating credit metrics or covenant breaches could make refinancing existing debt more expensive or complicated, negatively impacting Tesla’s financial stability.

TESLA stock to gain more heights again!Tesla has finally broke out of that ardous consolidation it was in! investors can look for the buying opportunities for a probable pullback on a shown order block!
Tesla Near Term SpeculationBuilding on the flag formation from the past 3 years, its possible an rising wedge could form. Very early days and highly speculative, but if price plays out somewhat like my chart, an ascending wedge could form. Indicating that Tesla may have hit a near/mid term high and can't won't break through for a few years, with several implied price crashes going into 2026 and 2027.
Economic conditions and the apparent slow down in sales, would also support the technical analysis with macro fundamentals.
Very curious to see how things play out, again, highly speculative, just wanted to post to remind myself to keep and eye on this. The potential volatility is presenting interesting trades ahead.

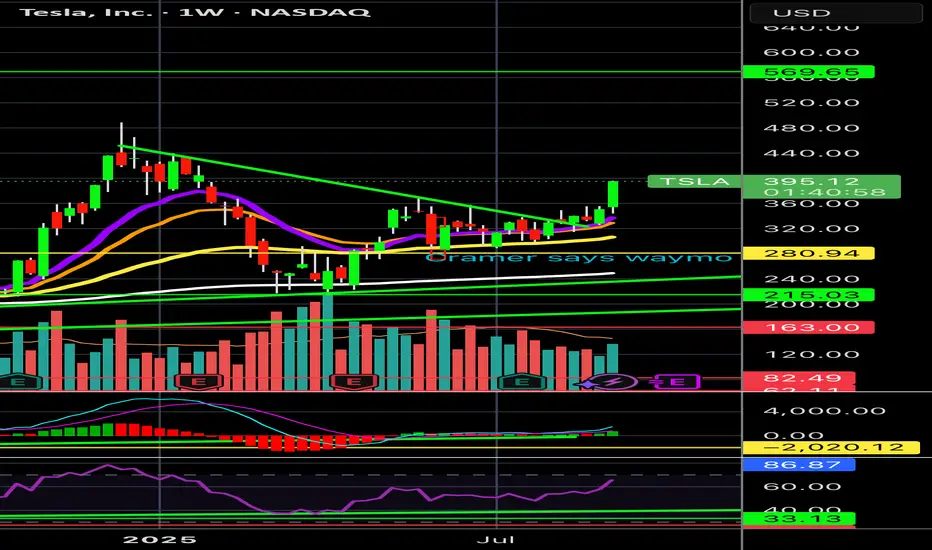
Breakout time $TSLA$570 inbound
The start of the Energy abundance and Robotaxi era is upon us. Autonomous robots will transport everything within the next 10 years.
Optimus wave will follow shortly behind over the next 5 years.
TAM Potential: 10X autonomous transport.
How high this eventually goes is almost laughable, time to sit back and watch compound growth and all its magical glory.
Tesla Breakout? For the majority of the calendar year TESLA has been in a range between $220 - $365 with a clear midpoint of $295.
From March to the beginning of May TESLA bounced between range low and the midpoint until finally breaking through into the upper half of the range where it has stayed ever since. However, there is a clear diagonal resistance level that is preventing higher highs.
So will TESLA breakout, or will it lose the midpoint? Structurally it is clear that the bulls have a set level they are happy to buy at (Midpoint) but the bears are getting more aggressive with their selling, hence the lower highs. This compression inevitably leads to an impulse move but the direction is not so clear.
Bullish scenario: A clean breakout with volume that makes a new higher high, signaling a shift in structure. A pullback and retest of the breakout would be an ideal opportunity to go long and aim for that range high before expecting resistance.
Bearish scenario: The lower highs keep printing until the midpoint is lost and price accepts below it, that would then signify to me the new trading range is between Range Low and Midpoint.
The fakeout scenario is a risk but with price so close to the midpoint already it follows the same invalidation criteria as the bullish scenario, the midpoint is vital to both sides.

#TESLA - $40 Swing?Date: 14-08-2025
#Tesla - Current Price: 339
#Tesla Pivot Point: 339 Support: 331 Resistance: 347
#Tesla Upside Targets:
| 🎯 Target 1 | 356 |
| 🎯 Target 2 | 365 |
| 🎯 Target 3 | 374 |
| 🎯 Target 4 | 384 |
#Tesla Downside Targets:
| 🎯 Target 1 | 323 |
| 🎯 Target 2 | 314 |
| 🎯 Target 3 | 304 |
| 🎯 Target 4 | 295 |
#TradingView #Nifty #BankNifty #DJI #NDQ #SENSEX #DAX #USOIL #GOLD #SILVER

Possible retrace before upside moveThe initial upward move from 214 is corrective in nature. Since the current correction to 273 doesn't seem to be proper ABC correction, I am expecting further C wave correction to the Green box. Breaking the Red Box and the trendline with a retest will invalidate further downward correction. Based on the Major Indexes structure, I am not expecting Tesla to retrace below 213 as depicted by red line .
Note
**Disclaimer** : All details shared here is for educational purpose only. Please do your own research and consider appropriate risk management before making short term or long-term investment decisions.
Approach Market always with probabilities and make sure risk management in place.
Request your support by like, comment and follow

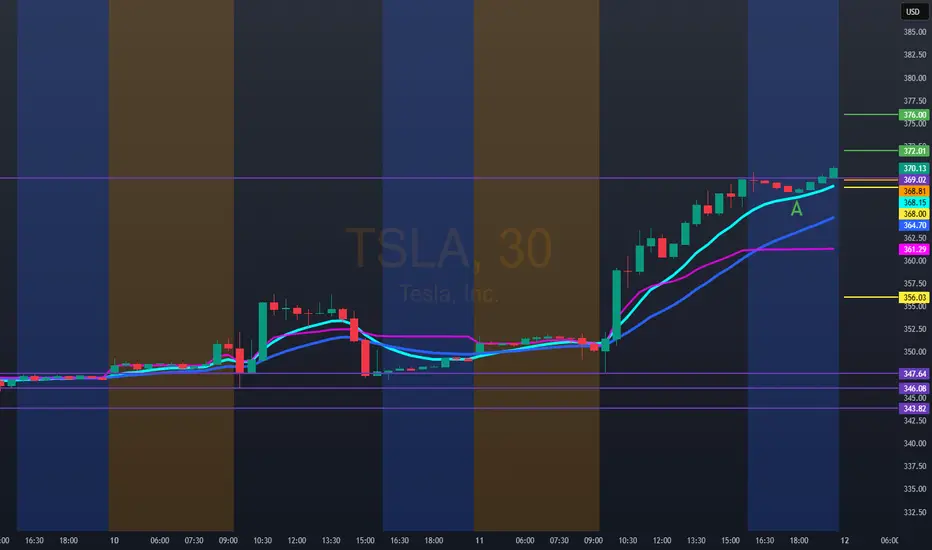
Hello trader, nice to meet you. For tomorrow, TSLA: 368.81we have a bullish entry at 372.00/376.00. Next, a possible target is 385.00/390.00. For better control of your stop, you can use the VWAP.
Bearish technical entry at 368.00. If you lose, this area could reach the 356.00 zone with a possible rebound. It's important to keep in mind that September is often a negative month for TSLA.
TSLA 1D Time frame Tesla (TSLA) Daily Snapshot
Current Price: $346.97
Change: +0.61% from the previous close
Intraday Range: Not specified
Trend: Bullish continuation
🔎 Key Levels
Resistance:
R1: $347.17 – $350.85 (short-term resistance zone)
R2: $360.56 – $362.90 (medium-term resistance zone)
Support:
S1: $324.94 – $330.14 (short-term support zone)
S2: $313.64 (trendline support)
S3: $302.62 (horizontal support)
📈 Technical Indicators
RSI (14): 57.10 — Neutral
MACD: 5.23 — Sell signal
Moving Averages:
5-day EMA: $339.84 — Buy
50-day SMA: $324.49 — Buy
200-day SMA: $330.33 — Buy
📌 Market Sentiment
Catalysts: Positive market sentiment, with TSLA outperforming key competitors in recent sessions.
Sector Performance: Tech sector showing strength, with TSLA leading gains among peers.
📅 Outlook
Bullish Scenario: A breakout above $347.17 could lead to a push toward $360.56–$362.90.
Bearish Scenario: A drop below $324.94–$330.14 may test support around $313.64.
Overall Bias: Moderately bullish, with positive momentum but facing near-term resistance.

Global Government Bond Trading1. Fundamentals of Government Bonds
1.1 What Are Government Bonds?
A government bond is a debt security issued by a country’s treasury or finance ministry to raise money. When an investor buys a government bond, they are lending money to the government in exchange for periodic coupon payments (interest) and repayment of the principal at maturity.
Coupon Bonds: Pay regular interest plus principal at maturity.
Zero-Coupon Bonds: Sold at a discount, repay face value at maturity.
Inflation-Linked Bonds: Adjust coupon/principal with inflation rates.
Savings Bonds / Retail Bonds: Targeted at individual investors.
1.2 Key Features of Government Bonds
Issuer: Sovereign state.
Maturity: Short-term (T-bills), medium-term (notes), long-term (bonds).
Yield: Return investors expect, inversely related to bond price.
Credit Risk: Higher in emerging economies; lower in developed ones.
Liquidity: Developed market bonds (like U.S. Treasuries) are highly liquid, emerging markets less so.
1.3 Importance in Global Finance
Provide a risk-free benchmark rate (e.g., U.S. Treasury yields influence global lending rates).
Used as collateral in repo markets.
Serve as safe-haven assets during crises.
Act as tools for monetary policy (quantitative easing, open market operations).
2. Structure of the Global Government Bond Market
2.1 Primary Market
This is where governments issue new bonds via auctions or syndications. Investors bid for these securities, and the government raises capital.
Auction System: Used by the U.S., UK, Japan. Competitive and non-competitive bidding.
Syndicated Issuance: Banks underwrite and distribute bonds, common in Europe.
2.2 Secondary Market
Bonds are traded between investors after issuance. This provides liquidity and continuous price discovery.
Over-the-Counter (OTC): Majority of global bond trading occurs OTC via dealers.
Electronic Trading Platforms: Growing importance (e.g., Tradeweb, MarketAxess).
2.3 Major Bond Markets
U.S. Treasuries: World’s largest, deepest, and most liquid government bond market.
Eurozone Bonds: German Bunds are benchmark safe assets, Italian and Spanish bonds carry higher yields.
Japanese Government Bonds (JGBs): Very large market but often low yields.
UK Gilts: Highly liquid, influenced by Bank of England policy.
Emerging Market Bonds: Offer higher yields but with currency and default risks (Brazil, India, South Africa).
3. Key Participants in Global Government Bond Trading
3.1 Central Banks
Major holders and buyers of government debt.
Conduct monetary policy through bond purchases (QE) or sales.
Hold government bonds as foreign reserves.
3.2 Institutional Investors
Pension funds, insurance companies, and mutual funds allocate heavily to sovereign debt for predictable returns.
3.3 Hedge Funds & Proprietary Traders
Trade bonds to profit from interest rate changes, arbitrage opportunities, or global macro strategies.
3.4 Foreign Governments & Sovereign Wealth Funds
Invest in foreign government bonds for diversification and reserve management.
3.5 Retail Investors
Participate via government savings bonds, ETFs, and mutual funds.
4. Trading Mechanisms
4.1 Cash Market Trading
Direct purchase/sale of government bonds in the secondary market.
Prices fluctuate with interest rates, inflation expectations, and credit risk.
4.2 Derivatives Market
Futures, options, and swaps based on government bonds or yields.
Example: U.S. Treasury futures (CME), Bund futures (Eurex).
4.3 Repo Market
Repurchase agreements use government bonds as collateral.
Essential for liquidity in the global financial system.
4.4 Electronic Platforms & Algorithmic Trading
Rapid growth in e-trading platforms.
Algorithmic and high-frequency trading now account for a significant share.
5. Factors Affecting Government Bond Prices and Yields
5.1 Interest Rates
Bond prices move inversely with interest rates. Central bank policy shifts directly impact yields.
5.2 Inflation
High inflation reduces real returns, pushing yields higher. Inflation-indexed bonds mitigate this risk.
5.3 Economic Growth
Stronger growth can lead to higher yields due to expectations of rate hikes.
5.4 Fiscal Deficits & Debt Levels
Higher government borrowing can push yields upward due to increased supply and perceived risk.
5.5 Currency Movements
Foreign investors consider exchange rate risks; weaker local currency may deter bond purchases.
5.6 Geopolitical Risk
Wars, sanctions, and political instability drive safe-haven flows into bonds of stable nations.
6. Global Government Bond Trading Strategies
6.1 Buy and Hold
Conservative investors, like pension funds, hold bonds to maturity for stable income.
6.2 Yield Curve Strategies
Steepener: Betting long-term rates rise faster than short-term.
Flattener: Opposite bet.
Butterfly Trades: Exploiting mid-term vs short/long-term curve differences.
6.3 Relative Value / Arbitrage
Traders exploit mispricing between different government bonds.
Example: Spread between U.S. Treasuries and German Bunds.
6.4 Global Macro Plays
Hedge funds trade bonds based on global interest rate cycles, inflation, and geopolitical events.
6.5 Carry Trade in Bonds
Borrowing in low-yield currencies and investing in higher-yield government bonds elsewhere.
7. Risks in Government Bond Trading
7.1 Interest Rate Risk
Sharp changes in central bank policy can cause bond price volatility.
7.2 Inflation Risk
Unexpected inflation erodes real returns.
7.3 Credit Risk
Even sovereigns can default (examples: Argentina, Greece).
7.4 Liquidity Risk
Smaller bond markets may not provide adequate trading liquidity.
7.5 Currency Risk
Foreign bond investors face exchange rate fluctuations.
7.6 Geopolitical Risk
Trade wars, sanctions, and political instability can disrupt markets.
8. Role of Government Bond Markets in Global Economy
Benchmark Rates: Government bond yields influence corporate borrowing costs.
Safe-Haven Assets: During crises, investors flock to bonds like U.S. Treasuries.
Monetary Transmission: Central bank policies work through bond markets.
Fiscal Policy Financing: Governments rely on bonds for infrastructure and welfare spending.
Global Capital Flows: Sovereign bonds drive cross-border capital allocation.
9. Case Studies in Global Bond Markets
9.1 U.S. Treasury Market
Largest and most liquid in the world (~$25 trillion outstanding).
Yields serve as a global reference for risk pricing.
Highly responsive to Federal Reserve policies.
9.2 European Sovereign Debt Crisis (2010–2012)
Greek, Portuguese, Spanish, and Italian bonds saw yield spikes.
Investors demanded higher compensation for perceived default risk.
ECB intervention (OMT, QE) stabilized the markets.
9.3 Japanese Government Bonds (JGBs)
Extremely low or negative yields for decades due to deflationary pressures.
Bank of Japan’s Yield Curve Control (YCC) dominates the market.
9.4 Emerging Market Bonds
Offer higher yields but riskier (Argentina default, Turkey’s currency crisis).
Depend heavily on foreign investor confidence.
10. Future of Global Government Bond Trading
10.1 Digital Transformation
Rise of electronic trading platforms.
Algorithmic and AI-based trading strategies.
10.2 Green & ESG-Linked Sovereign Bonds
Growing issuance of “green bonds” by governments to fund climate projects.
10.3 Impact of Global Debt Levels
Post-pandemic debt burdens remain high.
Long-term sustainability of government borrowing under scrutiny.
10.4 Geopolitical Realignment
U.S.–China rivalry may reshape global bond investment patterns.
“De-dollarization” efforts could impact U.S. Treasury dominance.
10.5 Central Bank Balance Sheets
Unwinding QE will affect bond market liquidity.
“Higher for longer” interest rate regimes may redefine yield structures.
Conclusion
Global government bond trading is the foundation of modern financial markets. It balances risk and safety, yield and liquidity, domestic policy and international capital flows. From U.S. Treasuries as the world’s risk-free benchmark to the volatile sovereign bonds of emerging markets, this market reflects the health of economies, the credibility of fiscal policy, and the confidence of investors.
In times of crisis, investors flock to safe government bonds. In times of growth, they may chase higher yields elsewhere. But regardless of market cycles, government bond trading remains central to how money moves across borders, how interest rates are set, and how nations finance themselves.
As the world transitions into an era of high debt, climate financing, digital trading, and shifting geopolitics, global government bond markets will only grow in importance. Understanding their mechanics is crucial for traders, investors, policymakers, and anyone seeking to grasp the pulse of global finance.

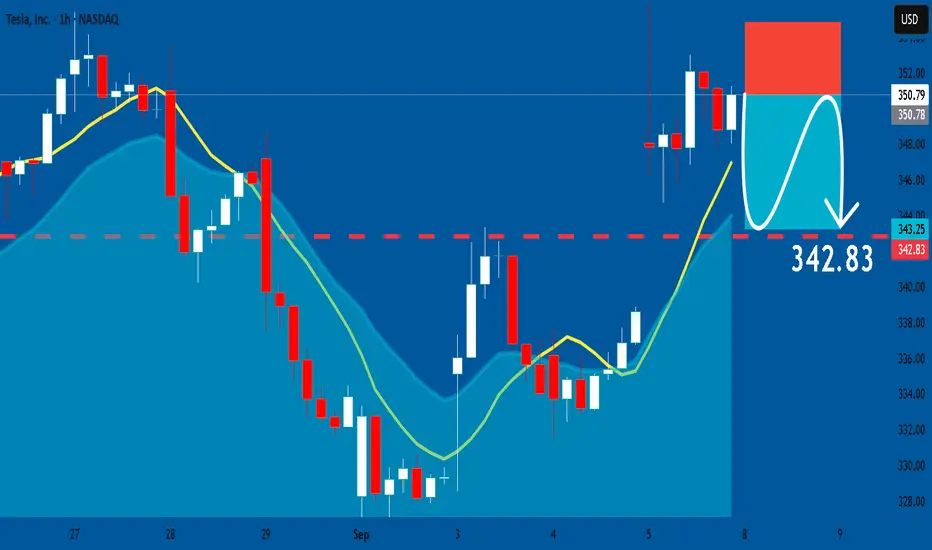
TESLA: Bearish Continuation & Short Signal
TESLA
- Classic bearish setup
- Our team expects bearish continuation
SUGGESTED TRADE:
Swing Trade
Short TESLA
Entry Point - 350.79
Stop Loss - 354.84
Take Profit - 342.83
Our Risk - 1%
Start protection of your profits from lower levels
Disclosure: I am part of Trade Nation's Influencer program and receive a monthly fee for using their TradingView charts in my analysis.
❤️ Please, support our work with like & comment! ❤️
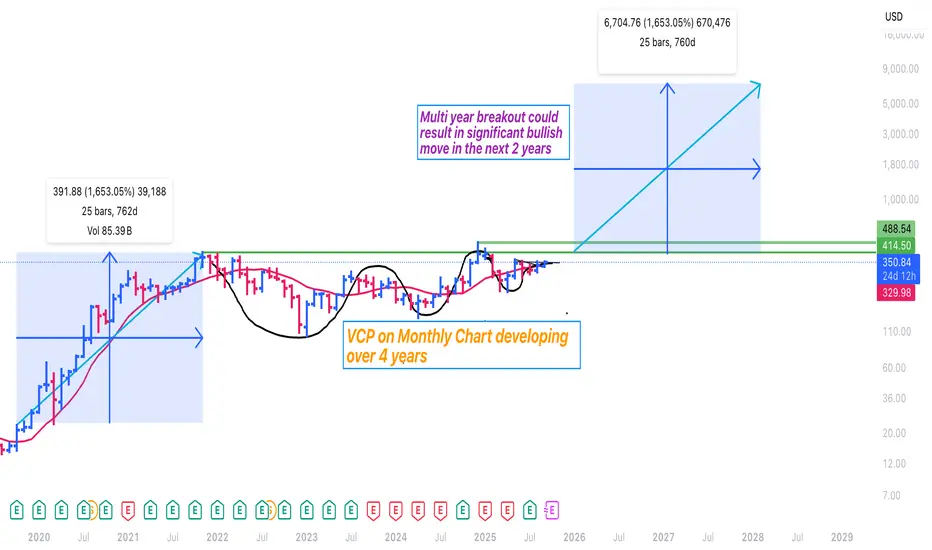
$TSLA showing multi year VCP & a breakout would be Bullish+++AB = CD pattern could emerge once broken out of this multi-year VCP / consolidation pattern that is developing in $TSLA.
Price action seem to indicate $280 - 310 is the likely bottom and odds favor a signficant move up!
Let's see how it pans out.
I am bullish.
Tesla, it cant be this easy.Tesla is following the trendlines like a FINRA book would have you believe, which makes me suspicious. Just the same, dont fight whats in front of you. Should run into some resistance from 362ish. Stay nimble.
TESLA 5TH SEP 2025 PRICE ACTION Price action for Tesla is here. I have clearly explained my plan on how to trade tesla considering every factor in market.
NOTE: OPTION WILL BURN YOUR CAPITAL

We are not positive about TeslaFollow us and don't miss a next idea on Global Markets
The impact of tariffs and expiring EV credits is expected to pressure future US deliveries and regulatory credit revenue in the near term
Elon Musk: Well, we're in this weird transition period where we will lose a lot of incentives in the US. Slab incentives actually in many other parts of the world. But we'll lose them in the US. Across all of it at the relatively early stages of autonomy. On the other hand, autonomy is most advanced and most available from a regulatory standpoint in the US. Does that mean we could have a few rough quarters? Yeah. We probably could have a few rough quarters. I'm not saying that we will, but we could. Q4, Q1, maybe Q2.
Revenue -12% y/y ( decline for the first time in 10 years)!!!
EPS 0,27 $ agj vs 0,39 $ estimated
FCF -89% y/y but still positive ( just 146 M$)
CAPEX for 2025 increased
EBITDA dropped by 7.8%.
Price to Sales 12,7
P/B 14
Expensive
We expect declining of the stock price to 210 $
And, yes, many still regard Tesla as a car manufacturer, but this is not a correct view of the company. Later in our blog we will touch on the question of how to correctly look at the brainchild of Elon Musk.
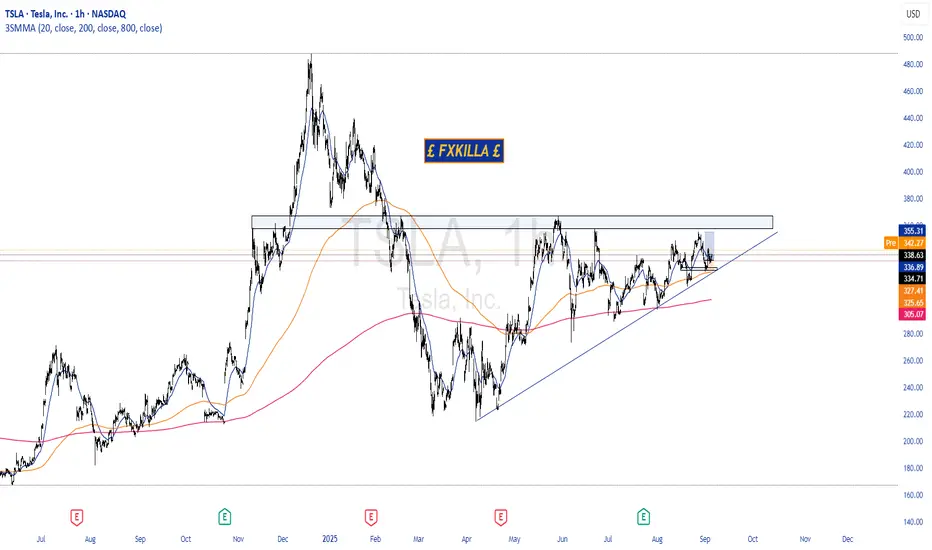
TESLA HIGH PROBABILITY SETUP SOON!!!🚨 TESLA HIGH PROBABILITY BUY SETUP 🚨
* Here We Can See Clearly The Next Potential Move For Tesla Coming Hours/Days.
* Keep Your Eyes Close On Your Trading Positions.
* Happy PIP Hunting Traders.
£ FXKILLA £
BMW Puts on the Techie Suit to Challenge Elon🚘️ BMW Puts on the Techie Suit to Challenge Elon
By Ion Jauregui – Analyst at ActivTrades
BMW (Ticker AT:BMW) has fired up its engines in the technology race against Tesla. The Bavarian brand is launching the Neue Klasse, a platform that promises to revolutionize the electric car and will debut with the new iX3, unveiled ahead of the Munich Motor Show.
This is not just another electric SUV: the company has invested more than €10 billion to turn the car into a “superbrain on wheels.” Four central chips manage everything from infotainment to autonomous driving, with 20 times more computing power than current systems. Added to this are headline-grabbing features: 800 kilometers of range and 350 km of charge in just 10 minutes.
BMW, however, does not manufacture its own batteries. Instead, it relies on Chinese giant CATL (SSE:300750), with whom it has developed new cylindrical cells that halve costs and increase energy density. Six gigafactories spread across China, Europe, and North America will guarantee supply.
Shift to E-Mobility
The shift toward electrification does not come without sacrifices. In 2024, the group saw its net profit fall 37%, to €7.68 billion, due to heavy spending on R&D. However, pure EV sales grew 13.5%, supporting the transition.
BMW benefits from structural reductions in battery production costs, a diversified portfolio supported by solid alliances that integrate electric, hybrid, and combustion models under the same digital platform, and a premium positioning that continues to attract loyal customers. The risk lies in massive spending eroding margins at a time when Tesla (Ticker AT:TSLA) and Chinese manufacturers like Xpeng (NYSE:XPEV) are advancing aggressively.
Technical Analysis
BMW shares on the Frankfurt Stock Exchange show a consolidation trend after a volatile 2024 marked by profit cuts. The current key support at €88.18 seems to be holding, while resistance lies between €88.85 and the unbroken highs of €91.72. This resistance has repeatedly pushed the stock back to support levels after each upward attempt. Breaking through current highs would open a path toward €110, and possibly new yearly highs, while a drop below support could shake investor confidence and push the stock toward the Point of Control (POC) around €86.60.
The 50, 100, and 200-day moving averages have contracted sharply over the past month, which could indicate declining confidence if confirmed. On the other hand, the RSI at 42.05% signals oversold conditions, while the MACD is negative but with a histogram turning positive—another possible signal of recovery. Lastly, the ActivTrades Europe Market Pulse indicator shows a contraction back to neutral territory, suggesting investors may be returning to support the market.
BMW (Ticker AT:BMW)
Trend: Bullish in the medium and long term, with potential lateralization or short-term reversal.
Resistance: Strong zone at the highs of €91.72.
Supports: Key levels between €88 and €88.50, with critical supports at €88.22, €88.18, POC €86.60, €85.18, €83.18, €81.60, and €79.70.
Point of Control (POC): €86.60.
Technical Conclusion: Recent sideways consolidation, with upside potential if the €91.50–91.72 zone is broken.
Tesla
Following political frictions between Elon Musk and Trump, Tesla’s stock has been recovering, moving sideways between May and August, with a slightly upward bias within the range of $361.93 to $291.37. A mid-range area has formed around the POC of $311.43, acting as support for the latest rally.
The RSI stands at 53.96%, a relatively neutral level, while the MACD remains neutral with a histogram gradually entering negative territory, pointing to a strong consolidation move. Meanwhile, the ActivTrades US Market Pulse indicates the American market is in extreme RISK-ON, suggesting potential adjustments due to excessive greed.
Tesla (Ticker AT:TSLA)
Current Trend: Short-term bullish recovery after weeks of lateral consolidation, with positive signs from regaining key moving averages.
Resistances: Strong resistance around $361.93, which could open the way toward $420, the next major level lost in February’s death cross.
Supports: Key support at the POC of $311.43, followed by $291.37, $274.75, and $225.58.
Technical Conclusion: Tesla is at a decisive range. A break above recent highs could trigger an upward move toward $420 or beyond. Conversely, a drop below $320 would increase bearish pressure, potentially driving the stock down to test $291.
Conclusion
The Neue Klasse is not just a product launch—it is BMW’s boldest and riskiest bet in decades. The German manufacturer wants to stop being solely a premium icon and transform into a fully-fledged tech player. Elon Musk no longer runs alone: the racetrack is filling up with rivals hungry for disruption.
*******************************************************************************************
The information provided does not constitute investment research. The material has not been prepared in accordance with the legal requirements designed to promote the independence of investment research and such should be considered a marketing communication.
All information has been prepared by ActivTrades ("AT"). The information does not contain a record of AT's prices, or an offer of or solicitation for a transaction in any financial instrument. No representation or warranty is given as to the accuracy or completeness of this information.
Any material provided does not have regard to the specific investment objective and financial situation of any person who may receive it. Past performance and forecasting are not a synonym of a reliable indicator of future performance. AT provides an execution-only service. Consequently, any person acting on the information provided does so at their own risk. Political risk is unpredictable. Central bank actions can vary. Platform tools do not guarantee success.

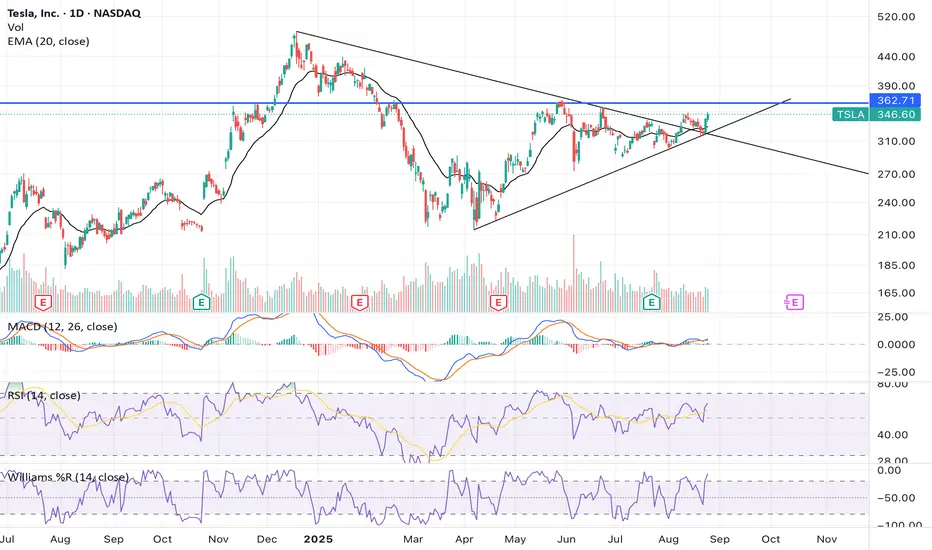
TSLA Creeping up from original triangle, but still in a larger tNASDAQ:TSLA continues to take the stairs of worry up to my trading signal target from the original triangle analysis, $386, but the pattern has morphed into what appears to be a barrier triangle now as price struggles at $360 with a series of higher lows.
RSI is comfortable at the EQ with room to grow while price remains above the daily pivot.
Analysis is invalidated below wave (C) $284
Safe trading