Iron ore snaps back with bullish daily reversalAfter a violent breakdown earlier this week, we have just seen a violent bounce in our iron ore contract, delivering a bullish reversal pattern on the dailies. However, before considering longs, it would be good to see further buying on Wednesday.
Tuesday’s hammer was sparked from a zone consisting

Forecast Description
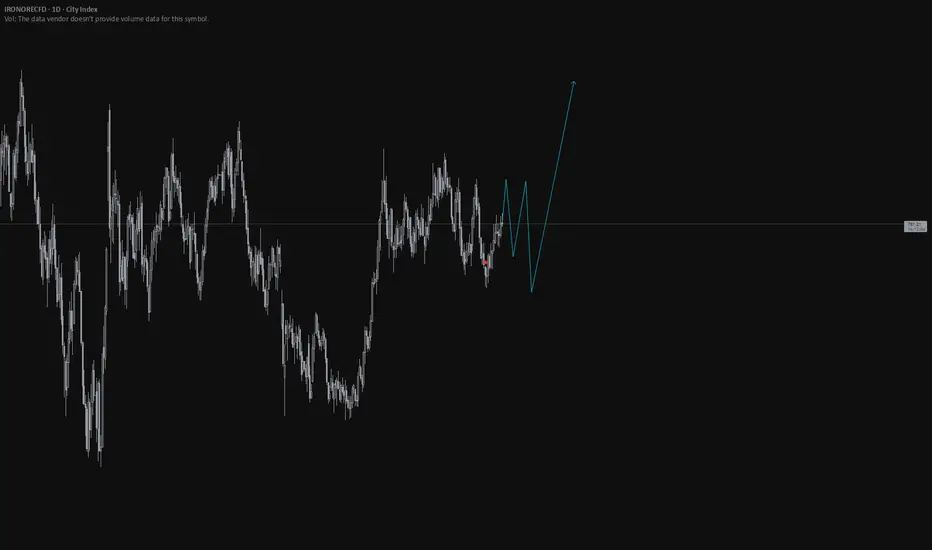
📈 Forecast Description
The blue line indicates a highly bullish and volatile forecast following a prior period of consolidation or price bottoming.
Initial Phase (Consolidation/Recovery): After the historical data (white line) reaches what appears to be a low point, the forecast begins with a peri
Iron Ore Bears in Control After 200DMA BreakIron ore has fallen through the 200-day moving average, a level consistently tested but rarely crossed, as seen in price action over the past year. If the contract closes below it today, a short setup could be on the cards.
Traders could sell with a stop above the 200DMA to protect against a revers

Iron ORE Spot | Chart & Forecast SummaryKey Indicators On Trade Set Up In General
1. Push Set Up
2. Range Set up
3. Break & Retest Set Up
Notes On Session
# Iron ORE Spot
- Double Formation
* 800.20 CNH | Pennant Structure(Reversed) | Subdivision 1
* 655.10 CNH | Retracement Entry | ((50))
- Triple Formation
* Neckline At 799.15 CNH | Su

See all ideas
Displays a symbol's price movements over previous years to identify recurring trends.