Forecast Description
📈 Forecast Description
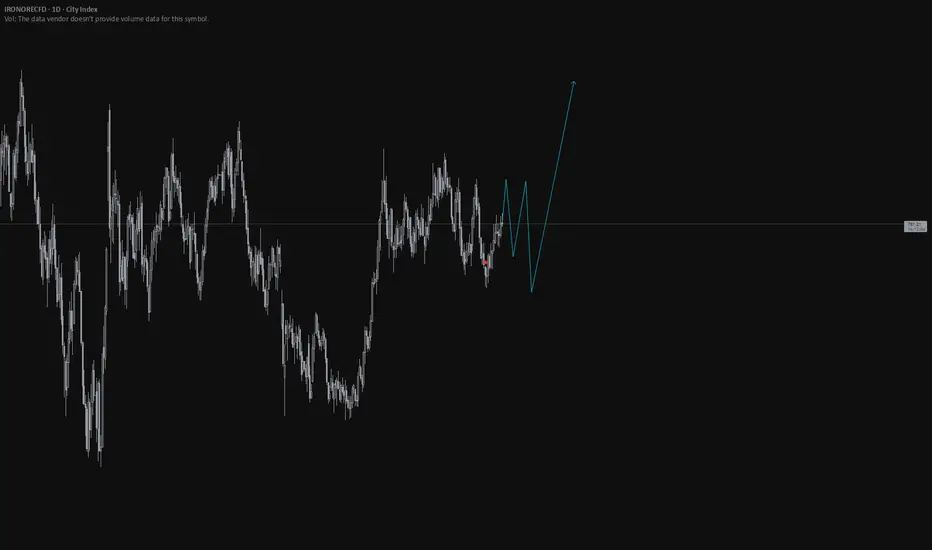
The blue line indicates a highly bullish and volatile forecast following a prior period of consolidation or price bottoming.
Initial Phase (Consolidation/Recovery): After the historical data (white line) reaches what appears to be a low point, the forecast begins with a period of tentative recovery and consolidation. The blue line shows several minor peaks and troughs (a small "W" or zigzag pattern), suggesting that the upward trend might not be immediate or smooth. This indicates an initial phase of battling resistance and finding strong support, potentially around the level of the lower dotted line.
Correction/Dip (The V-Shape): The forecast shows a noticeable sharp downward dip after the initial consolidation phase. This suggests a potential pullback or correction before the major rally begins. This V-shaped segment could represent a final flush-out of sellers or a test of a key support level.
Aggressive Uptrend (The Rally): Following the correction, the forecast enters a phase of aggressive, accelerated growth. The upward swings become significantly steeper and the overall trajectory is a strong, sustained move to the upside. The subsequent dips become shallower and the rallies become much stronger, indicating that the buying pressure is dominating the market.
Conclusion (Target): The forecast ends with the line pointing sharply up and off the chart's visible range, suggesting a high target price or a belief that the value will enter a strong, open-ended parabolic rally or new high-growth channel.
Trade ideas
Iron Ore Bears in Control After 200DMA BreakIron ore has fallen through the 200-day moving average, a level consistently tested but rarely crossed, as seen in price action over the past year. If the contract closes below it today, a short setup could be on the cards.
Traders could sell with a stop above the 200DMA to protect against a reversal, targeting ¥747 support. ¥755, the low of October 20, is also on the radar for anyone considering the setup. Should the unwind extend beyond ¥747, ¥735 is the next logical target, coinciding with former resistance that capped the price several times earlier this year.
Oscillators are sending a bearish message. RSI (14) is trending lower beneath 50, while MACD confirmed the signal with a bearish crossover earlier this week. Downside strength is building, favouring short setups.
On the fundamental side, Chinese trade data released today showed a 4.3% drop in iron ore imports in October. That may be contributing to the bearish breakdown, especially with steel exports also falling sharply compared to a month earlier.
Good luck!
DS

Iron ORE Spot | Chart & Forecast SummaryKey Indicators On Trade Set Up In General
1. Push Set Up
2. Range Set up
3. Break & Retest Set Up
Notes On Session
# Iron ORE Spot
- Double Formation
* 800.20 CNH | Pennant Structure(Reversed) | Subdivision 1
* 655.10 CNH | Retracement Entry | ((50))
- Triple Formation
* Neckline At 799.15 CNH | Subdivision 2
* Top / Bottom Structure | Ranging Area
* Flat ABC Correction | Behavioural Survey | Subdivision 3
Active Sessions On Relevant Range & Elemented Probabilities;
London(Upwards) - NYC(Downwards)
Conclusion | Trade Plan Execution & Risk Management On Demand;
Overall Consensus | Buy
