IONQ: Momentum Monster Breaking Out — How Far Can It Fly Next? After weeks of quiet accumulation, IONQ has erupted into a textbook breakout.
Both the weekly and daily charts are in perfect alignment — structure, volume, and momentum are all screaming continuation.
📆 Weekly Structure
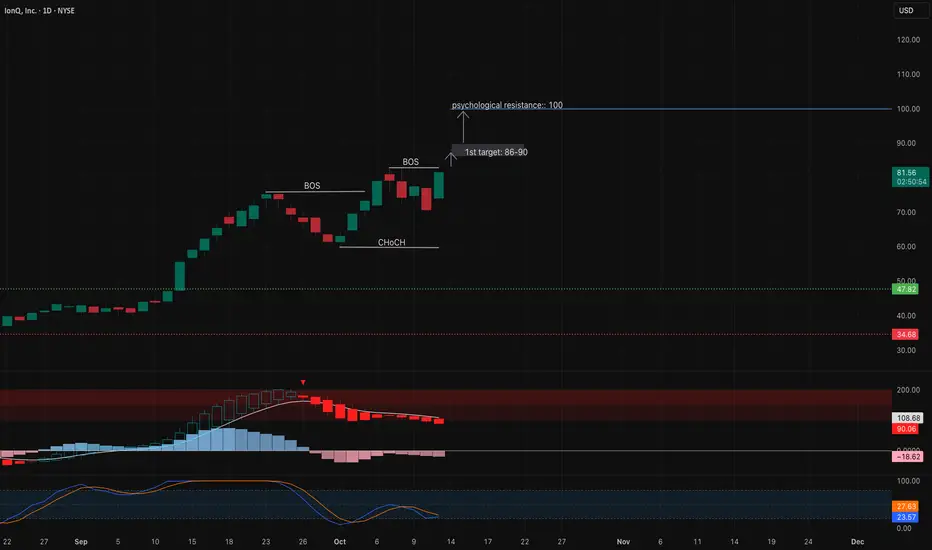
The weekly chart shows a clean Break of Structure (BOS), followed by wide-bodied bullish candles backed by strong volume — a sign that institutional hands are still active.
Momentum on the MACD continues to rise, and the Stoch RSI sitting in the overbought zone doesn’t signal exhaustion yet — it’s a power trend, not a peak.
As long as IONQ stays above the $65–68 demand zone, the trend remains intact. There’s zero evidence of weakness so far.
Key Weekly Levels:
* 🟢 Support: $65–68
* 🟡 Resistance: $90 → $100 psychological level
* 🔮 Extended Target: $105–110 if momentum continues
📊 Daily Structure
Zooming in, the daily timeframe confirms the same story.
After a clean retest of the $66–68 demand area, IONQ bounced sharply and formed another BOS, pushing back into strong bullish territory.
The MACD just turned upward, and the Stoch RSI has reset from oversold — a clear sign that momentum is reloading for another leg higher.
A breakout above $90 with strong volume would likely ignite the next expansion phase toward $100–105, where early profit-taking could start showing up.
🎯 Outlook
IONQ remains one of the cleanest bullish structures in the tech space right now.
Momentum is building across all timeframes, and as long as $68 holds, the next magnet zone sits around $90–100.
A short consolidation near those levels would actually be healthy — a pause before the next vertical push.
💭 Final Thoughts:
This is what a true momentum breakout looks like — aligned structure, volume confirmation, and rising momentum.
The bulls are in full control until proven otherwise.
This analysis is for educational purposes only and does not constitute financial advice. Always manage risk and trade responsibly.
Trade ideas
IONQ Oct. 9 — Bulls Building Base Near $72Breakout Watch Toward $79–$81 🚀
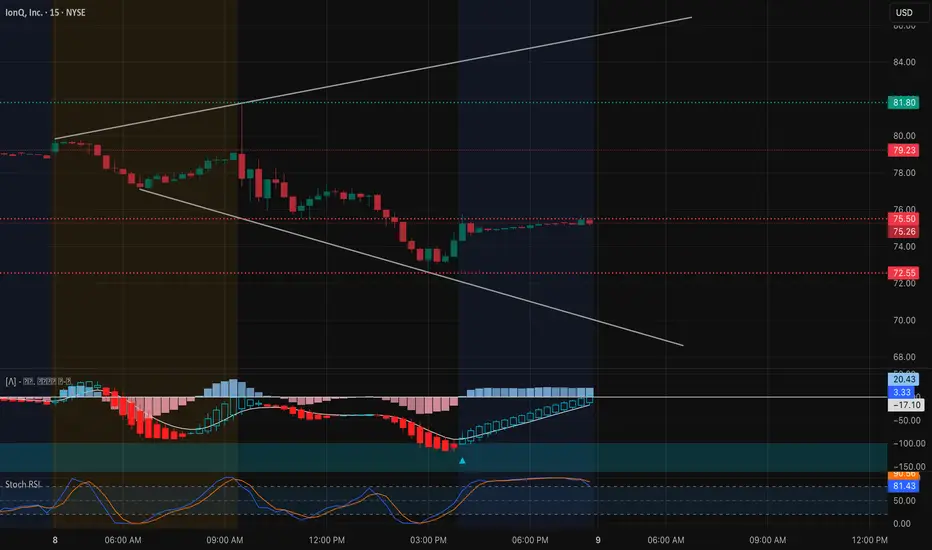
IONQ has been stabilizing after a steep pullback, currently forming a base around the $72–$75 range inside a descending channel. The 15-minute chart shows a clear CHoCH pattern signaling a shift in short-term structure as price rebounds off the lower channel boundary. Buyers are stepping back in near the $72.6 liquidity zone, defending it multiple times.
MACD shows early bullish momentum returning — the histogram flipped positive, and the signal lines are crossing upward. Meanwhile, the Stoch RSI is bouncing from oversold territory, confirming that momentum may carry higher if $75.5 breaks. A breakout from this descending structure could invite a rally toward $79 or higher.
Support and Resistance Levels:
* Immediate Resistance: $75.5 → $76.0
* Major Resistance (Target Zone): $79.2 → $81.8
* Immediate Support: $72.6 → $71.5
* Key Support Zone: $70.0 → $68.5
Technical Insights:
* Descending Channel: Price nearing upper trendline — breakout potential if $75.5 clears with volume.
* CHoCH Confirmation: Shows the first early reversal signal after sustained downtrend.
* MACD: Turning bullish, showing momentum accumulation under the $76 breakout level.
* Stoch RSI: Rising sharply from oversold, confirming short-term buyer strength.
Trade Scenarios:
Bullish Setup:
* Entry: Above $75.5 breakout confirmation
* Target 1: $79.2
* Target 2: $81.8
* Stop-Loss: Below $72.5
* Rationale: Strong CHoCH confirmation, MACD crossover, and volume base around $72–$73 suggest a bullish reversal if price breaks resistance.
Bearish Setup:
* Entry: Below $72.5 breakdown
* Target 1: $70
* Target 2: $68.5
* Stop-Loss: Above $74.5
* Rationale: A rejection from $75.5 or failure to hold $72 could resume the downtrend inside the descending channel.
IONQ is showing early signs of reversal but needs confirmation above $75.5 to trigger bullish continuation. If buyers push past that level with momentum, it could ignite a short squeeze toward $79–$81.
Disclaimer:
This analysis is for educational purposes only and does not constitute financial advice. Always do your own research and manage your risk before trading.
If anyone needs me to TA any stock, PM me.
IONQDump this trash stock. DUMP IT.
I had this chart made weeks ago and forgot to post it. Not short, just spectating.
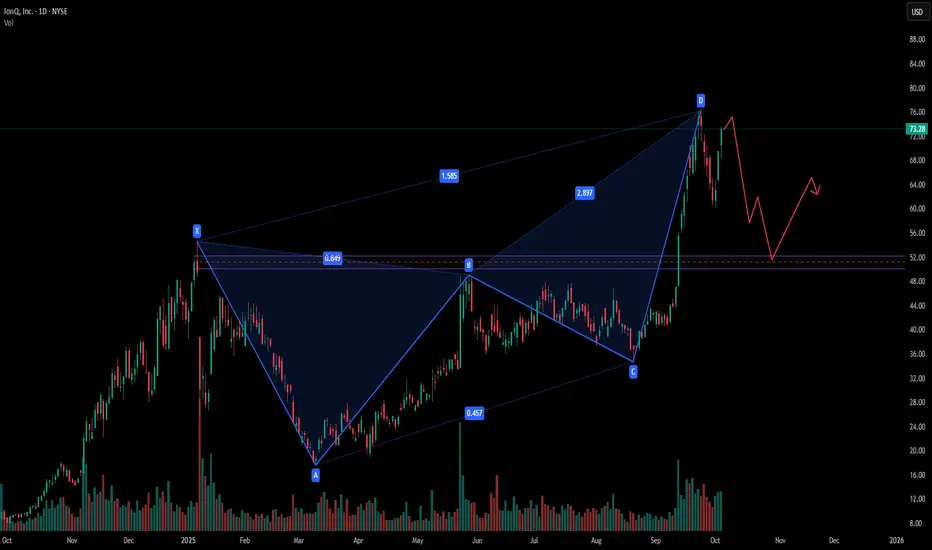
IONQ stock analysisFrom the current structure, it looks like IONQ may be forming a local top after its sharp rally. The price has completed a bearish harmonic pattern, which often signals exhaustion in bullish momentum.
If sellers step in from here, my view is that IONQ could retrace lower and head back to retest the highlighted support zone, where demand has previously stepped in.
📉 Conclusion: The completion of the harmonic pattern combined with the extended move suggests that IONQ may be topping locally. My bias is for a potential pullback into the support area before any attempt at continuation. Still, markets are unpredictable, and this remains only my view.
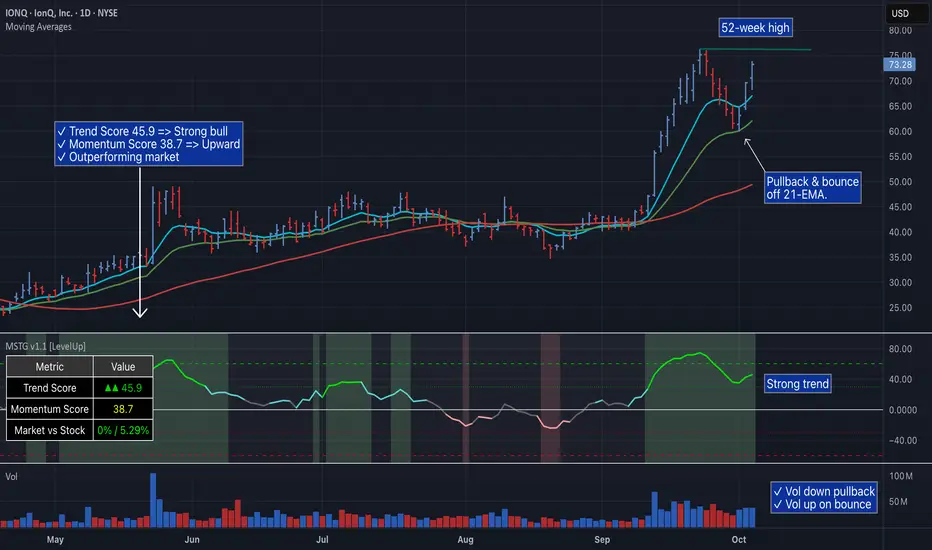
IONQ’s Next Move: $75 Breakout or Another 21-EMA Support Test?IonQ (IONQ) showed strong performance this week, hitting new highs and maintaining bullish technical ratings as sector momentum continued and news of strategic investments boosted sentiment.
The company traded near its 52-week high at around $73.54, up over 70% year-to-date, and benefited from its investment in autonomous freight technology company Einride, as well as new breakthroughs in quantum networking.
Price Action and News
- IonQ shares climbed about 9% this week, consolidating near recent highs ($73–$75), driven by news of major strategic investments and sector-wide rallies in quantum computing.
- The announcement of a stake in Einride and advances in quantum networking technology attracted investor interest and media coverage.
Analyst and Community Sentiment
- Analyst consensus remained "Strong Buy," with price targets ranging from $64.63 to $100, reflecting both high expectations and sector volatility.
- The stock is up over 70% year-to-date, leading quantum sector gains alongside Rigetti and D-Wave.
Idea Summary
IONQ continued its sector-leading momentum this week, consolidating near new highs with strong buy signals across all timeframes. Ongoing investments in freight technology and quantum networking fueled optimism, while technicals favor continuation of the bullish trend. Watch for further breakouts if sector strength holds and/or new partnerships are announced.
IONQAISP and IONQ are my AI plays. I've been spot on on both of these charts, although it turns out the AISP chart moves slower. It's moving in a much slower and larger formation than IONQ, which means it will run bullish longer, whereas IONQ needs to be watched more closely for a localized peak, which I would sell. I have a target. I've advised my target. I've explained my target's theory. I've asked you guys if you need help with your targets.
I'm just trying to help you make money. Recognize patterns. Very simple. Make money without a guru and without runes or spiritual enlightenment. I'm showing you how to do it, and yet I feel like I'm speaking to a wall sometimes.
IONQ Near Exhaustion! $70 Zone Will Decide Everything . Oct. 13IONQ Pullback Near Exhaustion: Bears Pressing, Bulls Watching the Same Level
They took a beating last week, closing down nearly 9% on Friday as growth and speculative tech names sold off hard under the weight of rising volatility. But here’s the interesting part — while the chart still looks bearish, the indicators are quietly showing early signs of stabilization.
Let’s break down what’s happening on the 15-minute intraday chart and the 1-hour GEX setup to see whether IONQ is preparing for another leg down or a sharp rebound.
15-Minute Intraday Technical View
IONQ spent most of Friday grinding lower under a clean descending channel, with each lower high confirming persistent selling pressure.
The stock briefly flushed to $68.3 before bouncing back to the $72 area, which now sits as the key short-term pivot.
MACD has turned from deep red to early light-blue bars — a sign that downward momentum is losing strength.
At the same time, Stoch RSI has already curled up from oversold conditions and crossed bullishly, hovering around the 70–80 level. That shows buyers starting to probe back in, even if cautiously.
The most important levels heading into Monday:
* Resistance: $72.5–73 (trendline & prior intraday supply)
* Support: $68–65 (demand base and short-term floor)
If IONQ breaks and sustains above $73, it could trigger a short-covering move toward $76–78, which lines up with both the previous structure high and the descending upper channel.
But if it loses $68 again, expect another wave of selling — next potential support lands near $65, then $60 if the market continues to unwind.
For scalpers, the play is straightforward:
Stay nimble around $72. Above that is momentum zone; below $68, it’s continuation down.
1-Hour GEX Analysis — Options Sentiment
The GEX chart shows the broader volatility pressure that’s been building for weeks.
Right now, the HVL (Highest Volatility Line) sits around $69–70, exactly where IONQ bounced late Friday — a classic gamma inflection point.
Below this, we’ve got stacked Put Walls near $65 and $60, signaling strong downside hedging and dealer short exposure. Those levels will act as magnets if selling continues.
On the upside, Call Walls sit between $75 and $80, capping potential rallies unless we see a sharp volatility contraction or an institutional bid returning to small-cap tech.
IVR is at 48.7, IVX at 72, meaning volatility is still elevated but starting to stabilize. Dealers are positioned in negative gamma below 72, so any push under that line can accelerate quickly — same on the flip side, meaning a reclaim of 73 could fuel a fast squeeze.
This tug-of-war is setting up an explosive short-term setup — but timing will depend on whether the market opens risk-on or risk-off Monday morning.
My Thoughts and Trade Ideas
IONQ has been in a controlled downtrend, but the signs of exhaustion are visible. The combination of flattened MACD, rising Stoch RSI, and GEX inflection around $70 suggests the downside may be near its limit — at least for now.
If volatility cools off and the market stabilizes, IONQ could easily stage a rebound toward $75–78 before running into heavy resistance.
If the VIX stays above 21 and tech remains weak, expect continued chop or a retest of $65.
Intraday plan:
* Long above $73 with tight stop under $70 — target $76–78.
* Short only if price breaks $68 with momentum — target $65, then $60.
Option setups:
* Bullish scalp: 75C or 80C (if above 73 early).
* Bearish hedge: 65P or 60P (if under 68).
Momentum traders should wait for confirmation — this stock moves fast when it flips sentiment.
Final Take
IONQ is sitting at a make-or-break level where both buyers and sellers are evenly matched.
The first move out of the $70–73 zone will likely dictate the week’s direction.
Watch how volume reacts to that breakout — quiet moves will fade, but strong spikes could lead to a full retrace back toward $78.
It’s a tight coil. Expect fireworks either way.
Disclaimer: This analysis is for educational purposes only and not financial advice. Always trade responsibly and stick to your risk plan.

Long trade
1Htr TF overview
📘 Trade Journal Entry
Ticker: IONQ (IonQ Inc.)
Date: Wed 8th Oct 25
Time: 3:30 pm
Session: NY Session PM
Direction: Buyside Trade
Timeframes: 1H + 15M
🔹 Trade Details
Entry: 75.40
Profit Target: 82.97 (+13.04%)
Stop Loss: 72.77 (–0.93%)
Risk-Reward Ratio (RR): 9.93
🔹 Technical Context
Model Type: Model 010 — Sweeper/Trigger Entry Model
Structure: Post-accumulation bullish continuation with aligned multi-TF expansion.
Confluences:
15M chart confirms liquidity sweep into order-block zone (73.40) followed by sharp displacement. 1H chart displays sustained bullish structure above both 50 EMA and 200 WMA.
Fib projection: 1.272 → 1.618 extension zone aligns precisely with TP (82.90 – 83.00).
Volume spike validates institutional activity concurrent with catalyst release.
MSB / FVG sequence suggests efficient re-accumulation before impulse continuation.
15min TF
🔹 Narrative Context
Following IonQ’s acquisition of Vector Atomic (Oct 7 2025), market sentiment shifted decisively bullish. The trade capitalized on post-news volatility, entering at the 73 – 75 range liquidity sweep. Momentum extended cleanly through the 1H structure, confirming directional conviction via both technical and fundamental catalysts. The 15M entry provided timing and risk definition, while the 1H projection maintained the broader macro trajectory toward 83 – 85 zones.

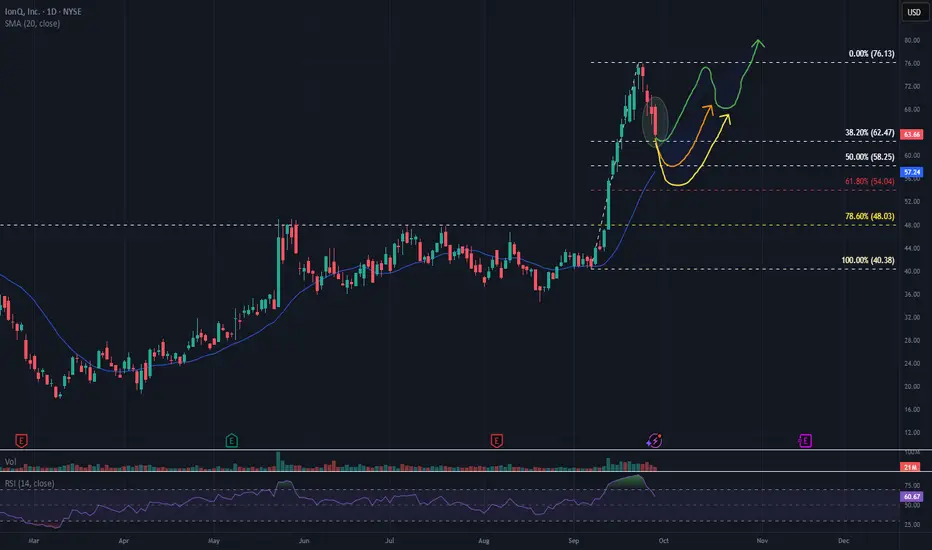
$IONQ - Strategic Buy Zones in IonQ (IONQ) Based on Fibonacci This chart of IonQ, Inc. (NYSE: IONQ) outlines a technical setup identifying three potential buy zones based on Fibonacci retracement levels and anticipated recovery paths:
First Buy Zone – 38.60% Retracement ~63$~~
This level may act as initial support. A bounce here could signal early recovery, especially if volume confirms buying interest.
Second Buy Zone – 50.00% Retracement ($58~~)
Highlighted by a yellow arrow, this zone suggests a short-term dip before a potential rebound. It aligns with a moderate correction and is often considered a strong technical level for accumulation.
Third Buy Zone – 61.80% (54$~~)
This deeper retracement zone is supported by a green arrow, indicating a longer-term recovery path. It may offer a high-reward entry point if the stock stabilizes and RSI confirms oversold conditions.
This analysis is for informational purposes only and does not constitute a recommendation to buy or sell any security. Always conduct your own research or consult a financial advisor before making investment decisions.
$IONQ potential for madness? +$100?If price continues to hold the $65 level as a low, then I think there's potential for an extremely large move higher from here.
I think it's possible that the stock price can go over $100 from here, which does sound crazy, but my thesis is that we're about to see a blow off top and shorts will get squeezed very hard.
I think the most likely resistance level is the first box, but I won't rule out the possibility of higher.
I've taken some calls to express this idea.

$IONQ - Priced to perfection?IonQ is an early-stage quantum computing company (trapped-ion architecture). Disclosure is thin: revenue is not segmented by source and recent acquisitions (e.g. Oxford Ionics, Capella, Lightsynq) make organic revenue growth trends hard to isolate.
Even if FY2025 revenue reaches ~$100m (≈132% y/y), I estimate a full-year net margin ≈ -240%. Given the scale of continued R&D and engineering spend required to reach error-corrected, production-grade systems, I don’t expect positive operating margins in the near term, and at an enterprise value of roughly $20bn, the stock embeds substantial future success.
On simple cross-checks (EV/Revenue, implied long-run FCF margin, and dilution
from SBC/capex needs), the market price already assumes rapid commercialization and high
steady-state margins. As such, execution risk is under-discounted and the shares screen
overvalued on current fundamentals.
For today’s ~$20bn EV to be reasonable, IonQ would likely need:
• Commercial scale: multi-year >50% revenue growth from recurring customers and annual contracts.
• Economics: credible path to ~30%+ GAAP net margin in the early 2030s.
• Technology: order-of-magnitude gains in algorithmic qubits and error correction, independently verified.
• Disclosure quality: segmented revenue (organic vs M&A), backlog visibility.
Technicals:
Significant overvalued signal on RSI, and close to the next Fib level, indicates a good opportunity to short.

IonQ Setting Up for a Key BreakoutIonQ on the Move – What’s Fueling the Surge and Key Levels to Watch 🚀
Why IonQ Has Jumped So Hard Lately
IonQ’s latest rally isn’t random—it’s powered by a string of catalysts that have caught traders’ and institutions’ attention:
* Strategic Acquisitions: The company is expanding beyond pure quantum computing. Deals like Oxford Ionics (advanced ion-trap control) and Vector Atomic (quantum sensing and atomic-clock tech) broaden IonQ’s technology stack and position it as a full-stack quantum platform.
* Government & Defense Contracts: Recent U.S. and UK partnerships and approvals boost credibility and open doors to high-value federal projects in quantum sensing, space, and security.
* Sector Momentum: Quantum computing is one of today’s hottest themes, and IonQ stands out as a liquid pure-play, attracting speculative and institutional money.
* Strong Vision and Guidance: The firm continues to outline aggressive qubit-scaling and fault-tolerance targets, reinforcing long-term growth narratives.
These fundamental wins have sparked a surge in call option buying, which in turn drives hedging demand from market makers—fuel for the strong price run you see on the chart.
Technical Setup
On the 1-hour chart, IonQ is riding a rising trendline that’s been intact since mid-September. Price is consolidating near $71–72, holding above key support and building energy for the next leg.
* Support: $70.4 (first defense), then $66.1 and $63.8 if the trend breaks.
* Resistance: $74.4 immediate, with $75 and $80 as next upside targets.
* Indicators: MACD histogram has flipped positive with signal lines turning up. StochRSI sits around 50, leaving room for momentum to expand.
GEX (Gamma Exposure)
Options data shows heavy call walls between $70 and $75. The 2nd Call Wall at $70 (~52% GEX) acts like a strong magnet/support, while the 3rd Call Wall at $75 (~16% GEX) caps near-term upside. Put walls cluster at $64 and $60. This call-heavy setup often supports upward pressure as market makers hedge.
Trading Scenarios
* Bullish Play: Look for a clean hourly close above $74.4 to target $75 and possibly $80.
* Suggested stop: below $70.4 or the rising trendline (~$69).
* Bearish Contingency: A decisive break under $70.4 could trigger a pullback to $66 or the $63.8 put wall.
Bottom Line
Fundamental momentum (acquisitions, government contracts, sector buzz) and bullish technicals (rising trendline, positive MACD, dominant call walls) are working together. As long as $70 support holds, the bulls retain the upper hand with $75–80 in sight.
Disclaimer: This analysis is for educational purposes only and does not constitute financial advice. Always do your own research and manage risk before trading.

9/22/25 - $ionq - Gym Kramer not yo friend9/22/25 :: VROCKSTAR :: NYSE:IONQ
Gym Kramer not yo friend
- apparently gym kramer is gonna talk to the "ceo" of the quantum-themed meme "ionq" tonight
- let's just say it this way:
- if kramer says "buy" is that a good thing?
- if kramer says "not to buy" (which the mkt doesn't expect and is bidding today - i'd guess, why else), is that a good thing?
- tails you lose, heads i win
- careful what you wish for, unless of course you have a real quantum computer that can help you with this otherworldly math
- for the rest of us, we don't let grandma pay 100s of x's sales for a meme, there r better ones out there
V

IONQ - BREAKOUT DOWN TRENDLINEIONQ - CURRENT PRICE 48.00 - 50.00
The stock is bullish as the share price is above 50-day EMA. The lows are getting higher - indicating demand is increasing.
The stock broke out down trendline - signaling bullish momentum. This bullish outlook is strengthened by positive readings in RSI (above 50 level).
ENTRY PRICE : 48.00 - 50.00
TARGET : 59.00 and 66.00
SUPPORT : 50-day EMA (CUTLOSS below 50-day EMA on closing basis)

IONQ BUY SET UPPrice has broken out of a triangular consolidation, with fundamentals supporting the move.
The UK just cleared IonQ’s Oxford Ionics acquisition, strengthening its quantum hardware capabilities. At the same time, revenue growth and improving financials add weight to the bullish breakout.

9/16/25 - $ionq - max short, gl 2 all9/16/25 :: VROCKSTAR :: NYSE:IONQ
max short, gl 2 all
- doesn't have a useful product
- continues to acquire companies by diluting you
- mgmt is dumping shares while unethically (at best) pumping their own shares on live TV
- no cash flow for 5 years
- all i can say is... been there... done that...
- gl to all.
- stock is probably worth $10-15 at most.
- trade it, have fun. but owing it here is financial suicide. don't tell yourself "nobody understands" unless you can look yourself in the mirror and honestly tell yourself "i do". let's be real - even the CEO knows this thing is headed way. way. lower.
V

Why IonQ (IONQ) Could Be the NVDA of Quantum ComputingIf you haven`t bought IONQ before the rally:
Now you need to know that IonQ isn’t just another speculative quantum stock — The company is building a robust ecosystem around its best‑in‑class trapped‑ion architecture and targeting fault‑tolerant, networked quantum systems. With record bookings, major acquisitions, and a strong balance sheet, IonQ could emerge as the NVIDIA equivalent for quantum infrastructure.
Key Bullish Arguments
1) Superior Quantum Tech – Trapped‑Ion Advantage
IonQ’s trapped-ion processors boast 99.9% two-qubit fidelity, demonstrating higher accuracy and scalability than superconducting alternatives
These systems also operate at room temperature, meaning simpler deployment and lower costs
2) Ecosystem Strategy & Acquisitions
The $1.08B acquisition of Oxford Ionics (expected close in 2025) expands IonQ’s qubit control tech, pushing toward planned 80,000 logical‑qubit systems by decade’s end
Combined with ID Quantique and Lightsynq, IonQ is building a full-stack quantum and networking offering
3) Strong Revenue Growth & Cash Runway
Revenue soared from $22M in 2023 to $43.1M in 2024, with bookings of $95.6M
. Q1 2025 saw $7.6M revenue and EPS –$0.14, beating expectations; cash reserves near $697M provide years of runway
4) Real Commercial Deployments
IonQ sold its Forte Enterprise quantum system to EPB ($22M deal) for hybrid compute and networking, marking real-world commercial applications
5) AI & Quantum Synergy
Involvement in NVIDIA’s Quantum Day and hybrid quantum‑classical AI demos (e.g., blood pump simulation with Ansys, ~12 % faster) indicates strategic synergy and positions IonQ as a critical piece in the future AI stack
Recent Catalysts:
Texas Quantum Initiative passes – positions IonQ at forefront of U.S. state-backed innovation
Oxford Ionics acquisition pending – major expansion in qubit scale & tech
Barron’s analyst buys – industry analysts see long-term potential; IonQ among top quantum picks
Broader quantum optimism – McKinsey & Morgan Stanley forecasts highlight synergy between quantum and AI, benefiting IonQ

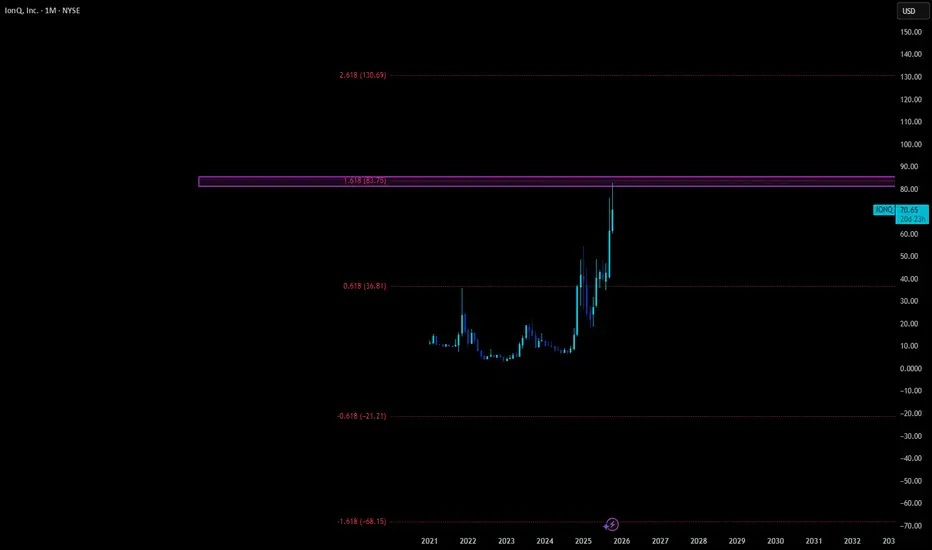
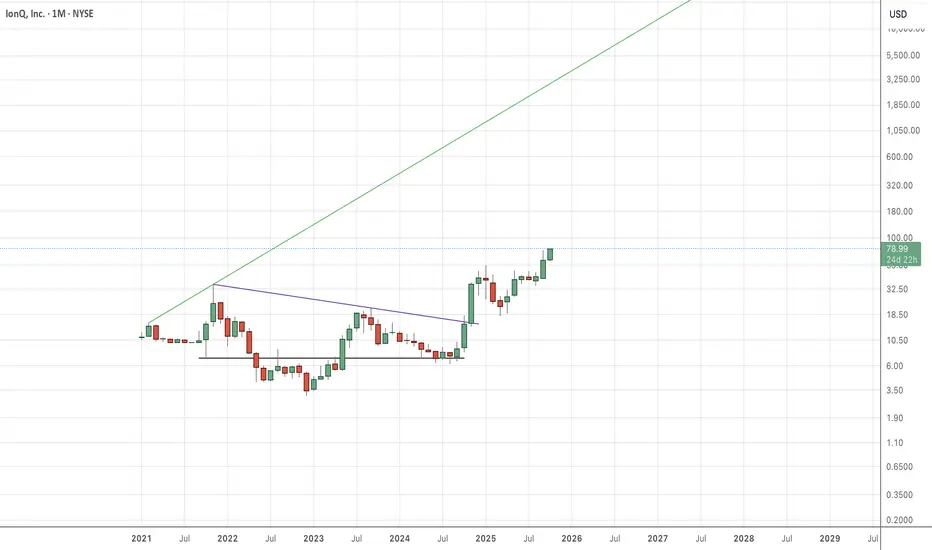
IONQ — trend breakout and growth potentialIonQ shares have consolidated above the 47–50 zone and successfully broke the trendline, opening the way for further upside. The first target is set around 120, and if buying pressure continues, the price could extend toward 200. Key support levels are at 47–48 and 36, providing attractive accumulation zones.
From a fundamental perspective, the quantum computing sector is gaining momentum, and IonQ remains one of its leading players. Increasing demand for innovative technologies may support the continuation of the bullish trend in the medium term.
A stock you buy and forget — the longer you hold, the more you earn.

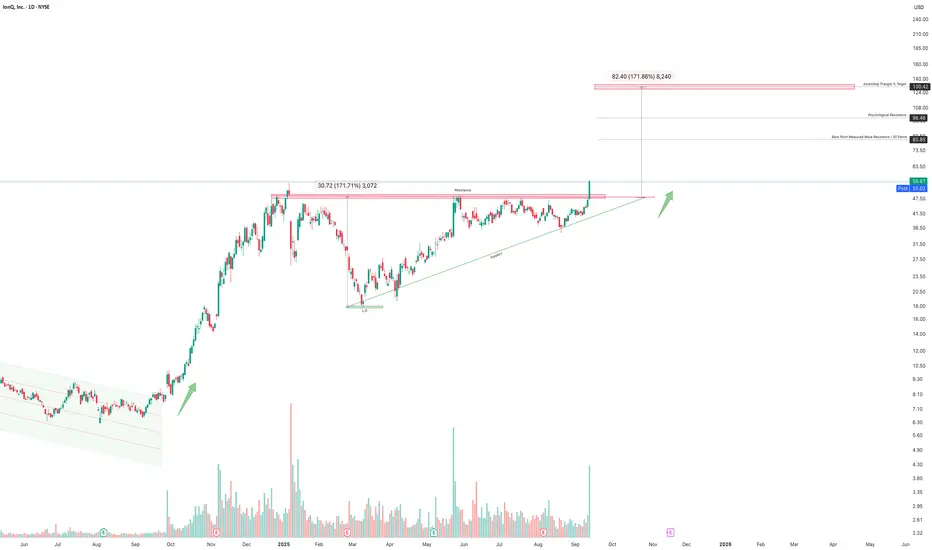
IONQ 's Ascending Triangle Breakout!IONQ has completed a prolonged consolidation phase, forming a textbook ascending triangle with a flat resistance ceiling at $48 and steadily rising higher lows. This structure represents clear accumulation pressure, with buyers consistently stepping in at higher price points.
Breakout Confirmation:
The stock has now broken above the $48 resistance with a surge in volume, validating the bullish breakout. This is a strong technical signal that the next leg higher has begun, rather than a false move.
Target Zones:
Measured move target (triangle projection): $80–82
Intermediate resistance: $98–109 (psychological and technical zones)
Extended target: $130–135 (171% projection, aligning with long-term triangle objective)
Risk Management:
The $48 breakout zone now acts as a critical support level. A sustained close below would negate the bullish breakout and suggest a failed pattern. As long as price remains above $48, momentum favors higher levels.
Volume & Momentum:
The recent volume spike at breakout confirms institutional participation. This is crucial, as breakouts from long consolidations often trigger strong trending moves when backed by volume.
Macro/Sector Context:
IONQ remains a flagship in quantum computing. The sector continues to benefit from rising AI + high-performance computing investments, making IONQ a key proxy for investor sentiment in the space. A breakout here could attract even more capital inflows into quantum plays.
✅ Conclusion:
IONQ’s breakout above $48 confirms the end of its consolidation and the start of a new bullish cycle. With well-defined support and multiple upside targets ( $80 → $100+ → $130), the risk/reward profile remains highly favorable. As long as the breakout level holds, the chart supports a multi-leg rally with significant upside potential.
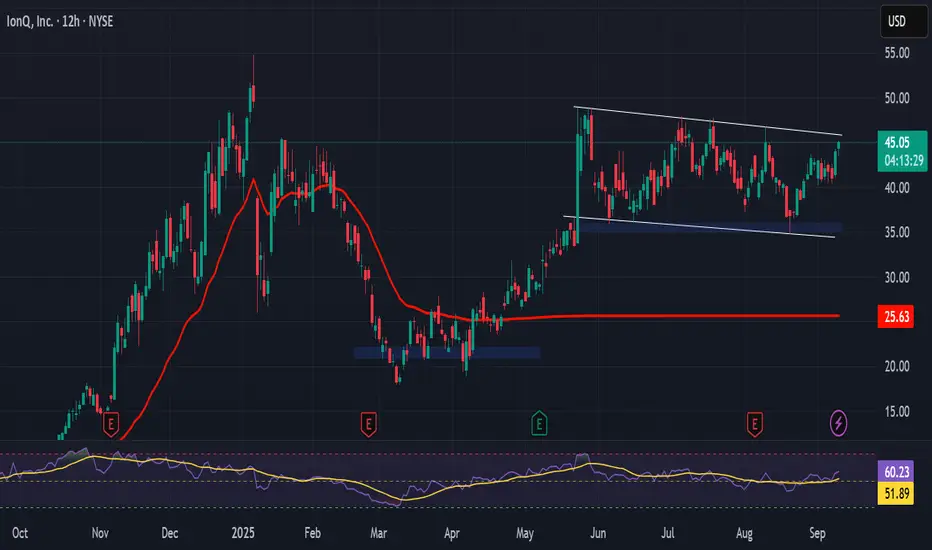
IONQ long (early alert)IONQ weekly: tight range for almost two months. Have a feeling last week's candle was a reversal. Nothing is perfect on this, yet: the hammer reversal candle is red, MACD is not constructive, RSI and Williams% are both MEH. But I think today's AMD/IBM announcement will revalidate quantum plays. If IONQ can take out the volume shelf around 41ish, another 10% move (+) higher is likely. Looks like limited downside in the pattern...

IonQ - Bullish break above likelyNYSE:IONQ is likely to break to the upside as the stock has broken out of the corrective descending channel/flag and resistance gap has been tested multiple times and it is likely to be weaken. Momentum is flat over the long-term but mid-term stochastic and 23-period ROC has risen. Target is looking at 65.00

IonQ (IONQ) — Quantum Leader Targeting 8,000 Logical QubitsCompany Overview:
IonQ, Inc. NYSE:IONQ is a quantum computing pioneer using trapped-ion technology to solve problems beyond the reach of classical systems, offering investors exposure to the fast-growing quantum sector.
Key Catalysts:
Quantum communications expansion: Strategic acquisitions (e.g., Capella Space) and investments in quantum networking aim to build a future quantum internet.
Talent & execution strength: High-profile hires like Dr. Marco Pistoia (ex-JPMorgan) and Dr. Rick Muller (ex-IARPA) enhance R&D capabilities.
Long-term roadmap: Goal of 8,000 logical qubits by 2030, a milestone that could cement its competitive edge and drive adoption of practical quantum applications.
Investment Outlook:
Bullish above: $35.00–$36.00
Upside target: $80.00–$82.00, supported by tech milestones, strategic expansion, and top-tier talent.
#IONQ #QuantumComputing #Innovation #AI #QuantumInternet #Investing #TechGrowth
IonQ Inc. (IONQ), NYSE, (W)- cup-like structureThe stock is forming a rounding base (cup-like structure) after a corrective phase.
Price is consolidating below the major resistance zone at $48.66.
A breakout above this zone can trigger strong upward momentum.
Key Levels
Support Levels:
$42.35 (immediate pivot)
$36.05 (major support, must hold)
Resistance / Target Levels:
$48.66 (immediate breakout level)
$54.96
$61.26
$67.57
Volume Analysis
Volumes spiked on earlier rallies (May–June 2025), showing institutional interest.
Current consolidation shows low-to-medium volumes → suggests preparation for a breakout.
Bias : Bullish on breakout — IonQ is building a base below $48.66. A confirmed breakout could take it into the $55–67 zone in the medium term.
⚠️ Disclaimer: This chart is for educational purposes only.
Regulatory Note: We are an independent development team. Our services are not registered or licensed by any regulatory body in India, the U.S., the U.K., or any global financial authority. Please consult a licensed advisor before making trading decisions
