ABNB Update: Short Term Trade OpportunityYahoo Finance:
Even though a company’s earnings growth is arguably the best indicator of its financial health, nothing much happens if it cannot raise its revenues. It’s almost impossible for a company to grow its earnings without growing its revenue for long periods. Therefore, knowing a company’s potential revenue growth is crucial.
In the case of Airbnb, Inc. the consensus sales estimate of $1.79 billion for the current quarter points to a year-over-year change of +18.7%. The $9.66 billion and $11.14 billion estimates for the current and next fiscal years indicate changes of +15% and +15.2%, respectively.
Last Reported Results and Surprise History
Airbnb, Inc. reported revenues of $1.9 billion in the last reported quarter, representing a year-over-year change of +24.1%. EPS of $0.48 for the same period compares with $0.08 a year ago.
Compared to the Zacks Consensus Estimate of $1.87 billion, the reported revenues represent a surprise of +1.7%. The EPS surprise was +77.78%.
The company beat consensus EPS estimates in each of the trailing four quarters. The company topped consensus revenue estimates three times over this period.
Technical Overview:
H4 Chart Timeframe:
Advanced Chart Pattern Tracker: Bullish Triangle Pattern and Cont. I SHS Pattern
Cycle Sniper Indicator: D1 Headed North.
Price Closed above P100 Beta Bands. The technical target will be P200 Beta Bands.
Shorter term: Closing above 120$ will confirm the next target at 126$.
Longer term: If it holds above 100 $, targets will be 131.25$ 137.50$ and 143$ .
Trade ideas

AIRBNB Stock Chart Fibonacci Analysis 042923Trading Idea
1) Find a FIBO slingshot
2) Check FIBO 61.80% level
3) Entry Point > 118/61.80%


Airbnb ($ABNB) StraddleThis is a Goldman trade idea from their Weekly Options Watch Tactical Trades on 4/19/23: NASDAQ:ABNB 5/26/23 straddle ahead of earnings on 5/2/23. Goldman expects considerable volatility in the growth profile of alternative accommodation booking platform AirBNB. The May 26th Straddle is going for $13.55; breakeven at $128.55 and $101.45. The 1M IV of 48 is only in its 22nd percentile relative to the past year.

ABNB Brake out and BULL flagABNB Brake out from weekly resistance and BULL flag formation.
Wait on brake out and go LONG

ABNB - dark cloud cover - SHORTWe can observe a dark cloud cover pattern. Most likely there's more downside on ABNB therefore it may be a good moment to short ABNB.
Entry , stop loss and target are shown on the chart.
Good luck

ABNB daily break above long day bearishABNB daily break above long day bearish if we break above should go higher into 200 moving average.

BreakdownBreaking down now as it finally broke through the ascending trendline. Targeting 108-111 for it to settle and chop around.

Airbnb - Buy at rebound Double bottom and descending triangle saw a potential upside especially the intraday chart shows a strong closure yesterday

SHORT ABNB. Highly likely $86 Target PriceThe chart speaks for itself. SHORT ABNB at anything > $118.50. SL = $132.78. REWARD:RISK = 2.26. Target Price ~$86

Bear Flag PatternThe chart is showing a Bear Flag Pattern,
And with the rsi being below the 50 middle band,
And with breaking major support line at 119,69.
I see a bearish sentiment for the next few days,
And if we break the 115.94 trend line,
I see ourselves dropping to the 111.51 trend line,
And drop again to finally hit the button off the next major support line of 106.39.
This is just my opinion...Safe trading everyone

Still watching this for a short tradeDidn't break out and seeing some selling today. Currently under the daily 5 MA. Back to the 50 and 20 too. If it fumbles around here and doesn't find much of a bid, I think I'll start a position to the short side with a target to revert to the 200.

ABNB - AirBNB 25% Don't sleep on ABNBAirBNB is 25% away from its recent high zone. Is it time for Airbnb to catch some air tine? Is it a must have for the watchlist?

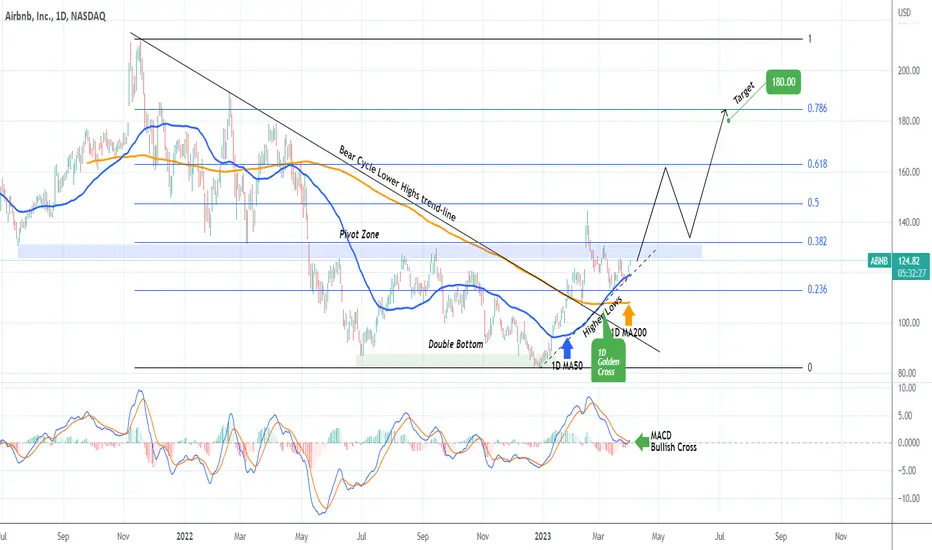
AIRBNB well supported targeting $180.Airbnb Inc (ABNB) is flashing major buy signals as it came outside the 2022 Bear Cycle. Not only is it supported by the 1D MA50 (blue trend-line) on a Higher Lows trend-line, but is also past a 1D Golden Cross pattern.
Having broken above the Bear Cycle Lower Highs trend-line and successfully re-tested it as a Support, it almost filled the 0.5 Fibonacci retracement level on February 16 and is now targeting the upper ones. We characterize the 0.382 - 0.618 Fibonacci range as the High Volatility Zone and our target by Q3 is just below the 0.786 Fib at $180.00.
-------------------------------------------------------------------------------
** Please LIKE 👍, FOLLOW ✅, SHARE 🙌 and COMMENT ✍ if you enjoy this idea! Also share your ideas and charts in the comments section below! **
-------------------------------------------------------------------------------
💸💸💸💸💸💸
👇 👇 👇 👇 👇 👇
AIRBNB Stock Chart Fibonacci Analysis 033023Trading Idea
1) Find a FIBO slingshot
2) Check FIBO 61.80% level
3) Entry Point > 117/61.80%

AIRBNB is trying to 'accomodate' back 140 soon.4HR higher lows -- ascending continuation.
Spotted at 118.80 -- may target 140 recent peak soon.
TAYOR.

Weekly Levels : ABNBNext Support and Resistance Area for $ABNB
Identified on the chart the next possible Support and Resistance, where the price will exit this trading range.

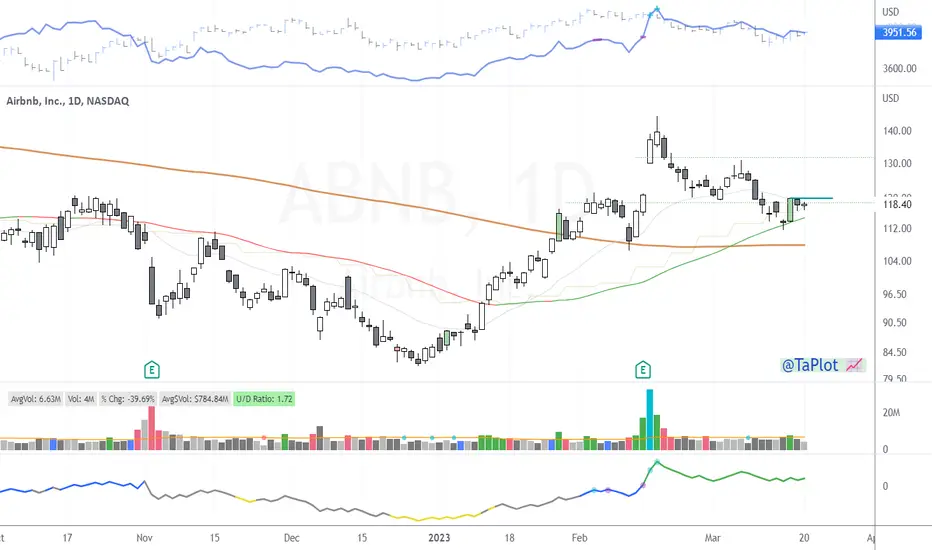
$ABNB Pullback Setup$ABNB setting up a pullback buy off its 50 MA after its earning gap up.
Pullback volume been orderly.
Trading Idea 003: AirbnbMarket Conditions:
- trend reversal
- bullish sentiment in the market
Key Level and Lines:
- $103.50 resistance
Trading Ideas:
- go long after a consolidation around the resistance
- a downward movement below $100 and the bearish sentiment in the market = go short.


ABNB - Cup And HandleABNB has had a long run to the downside primarily due to global economical reasons, and now seems to have a great run to the upside.
We can see that the chart has formed a Cup and Handle-pattern, and is now trying to retest its high of the handle.
We will wait for a breakout of the handle, to take our position with the expectation of a return of 26%.
More details are shown on the chart.

ABNB rejected by anchored VWAPRejected three times but another test incoming... If over, bulls have control
