Charter Communications – Hidden Gem with Up To 85% Upside OpportIf you like this idea, please don’t forget to Boost it.
Fundamental Indicators:
Sector – Communication Services
US Business Cycle Stage – late cycle, when this sector is neutral
Revenue – consistently growing for the past 5 years, with 13% average annual rate
Profits – even more explosive growth, with 26% average annual rate
Net margin – decent 12% which has considerably increased since 2018
P/E – quite low with 13.6 ratio compared to S&P500 with 21 and Communication Services sector with 17.5
Liabilities - debt ratio is at 0.91 which is a little over the norm, Net Debt/ EBITDA is at 4.54 – no major problems with debt
Conclusion – great performance across all indicators apart from the debt ratio, which shouldn’t be a concern at this stage – stock likely to continue growing
Technical Analysis (Elliott Waves):
Main scenario of this idea suggests that we are still observing development of the global growth cycle which is currently at the stage of completing wave 5 of 5 (see higher timeframe graph)
The key elements of this scenario are Contracting Tringle of wave 4 that lasted between 2017 and 2019 which reflects accumulation phase, and the final fifth which is taking a complex shape
This final fifth wave is clearly shaping up by a choppy movement which indicates formation of an Ending Diagonal (see guidelines for Ending Diagonals below)
Waves 1 to 4 have already formed and wave 5 is just about to start
This may present a good long term opportunity with a target of $825 – up to 85% upside
This is a higher timeframe to reflect the full history of Charter Communications and to provide full wave count:
This is the link to the guidelines for Ending Diagonals
What do you think about Charter Communications and its short term prospects?
Also let me know if you would like to see other stocks, indices, Forex or Crypto analysed using Elliott Waves. And BOOST this idea if you like it.
Thanks
Trade ideas

$CHTR with a Bullish outlook following its earnings #Stocks The PEAD projected a Bullish outlook for $CHTR after a Negative Under reaction following its earnings release placing the stock in drift D with an expected accuracy of 75%.

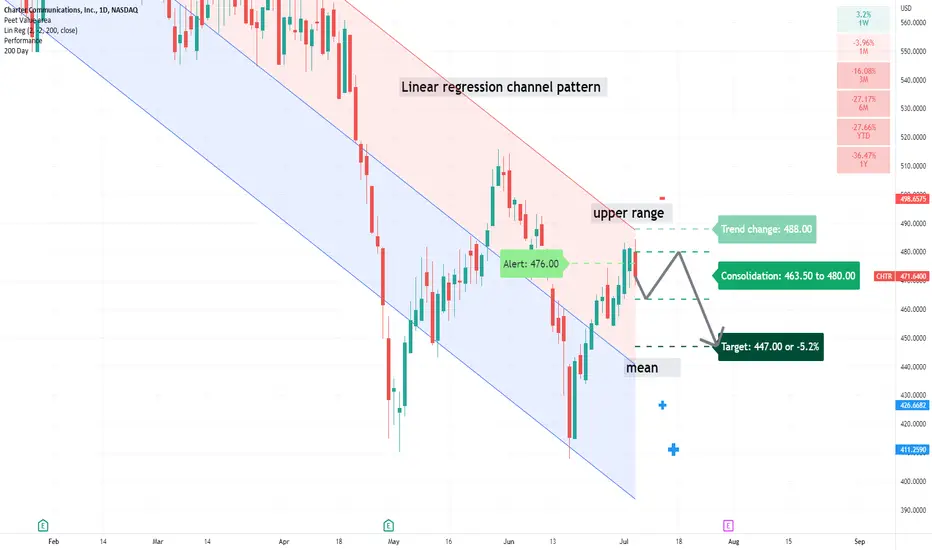
CHTR: mean reversion trade?The price action to the upper range of the linear regression channel pattern increases the likelihood of a mean reversion trade.
A price action below 488.00 supports a bearish trend direction.
Crossing above this level will negate the bearish trend.
Consolidation range from 463.50 to 480.00.
Crossing below 463.50 might target 447.00.
Crossing above 480.00 might be the first sign of strength.
Downward sloping linear regression channel pattern also supports a bearish trend direction.
Trendline resistanceTrendline resistance of CHTR since the last year. Could have been a good short trade.

$CHTR looking like a good value$CHTR is currently trading at a 16PE and is at the bottom of its trend and supported above the price volume profile. Additionally it has started to show relative strength at these levels getting minor gains while the rest of the market was down the last several days.

$CHTR with a Bullish outlook following its earnings #Stocks The PEAD projected a Bullish outlook for $CHTR after a Negative Under reaction following its earnings release placing the stock in drift D with an expected accuracy of 66.67%.

CHTR good earnings= selloffFB reported atrocious earnings, revenue miss and slowest growth since IPO and goes up, CHTR sells off on good ER. This is the market we're in. Support appears to be in the $410 range. Stock is way oversold. Looking for an entry point for a bounce.

$CHTR short squeeze - 9 days to coverchtr beaten down lost and forgotten. 7% float short interest 9.65 days to cover... 22.46 p/e lowest since 2018


Chart Master for Charter CommunicationsLooks appealing, not even sure what they do. Relatively high short % against the float which means it can have a more elastic bounce.
they're also defended with pricing powers (inflation pain handover capability)

Charter Comm lost an earpiece. CHTRGoals 521, 504. Invalidation at 615.
We are not in the business of getting every prediction right, no one ever does and that is not the aim of the game. The Fibonacci targets are highlighted in purple with invalidation in red. Fibonacci goals, it is prudent to suggest, are nothing more than mere fractally evident and therefore statistically likely levels that the market will go to. Having said that, the market will always do what it wants and always has a mind of its own. Therefore, none of this is financial advice, so do your own research and rely only on your own analysis. Trading is a true one man sport. Good luck out there and stay safe

$CHTR with a Neutral outlook following its earnings #Stocks The PEAD projected a Neutral outlook for $CHTR after a Negative over reaction following its earnings release placing the stock in drift C with an expected accuracy of 20%.
CHTR LongPrice action compared to an adjusted earnings growth rate of about 43% with forward looking EPS growth of 24% in 2023 and 20% in 2024. Current blended P/E is about 24, which is close to the expected growth in the next few years
Risk is 84 LT debt to cap. Company has been repurchasing stock, though which is nice.


CHTR: Short term sellAll trade in sell order/buy order, might not trigger, cancel if the price has run too far.

$CHTR with a Bullish outlook following its earnings #Stocks The PEAD projected a Bullish outlook for $CHTR after a Positive under reaction following its earnings release placing the stock in drift A with an expected accuracy of 57%.
If you would like to see the Drift for another stock please message us. Also click on the Like Button if this was useful and follow us or join us.

$CHTR with a Bullish outlook following its earnings #Stocks The PEAD projected a Bullish outlook for $CHTR after a Negative over reaction following its earnings release placing the stock in drift C
If you would like to see the Drift for another stock please message us. Also click on the Like Button if this was useful and follow us or join us.

CHTR - Upside potential NASDAQ:CHTR
CHARTER COMMUNICATIONS INC (#CHTR)
Downward channel taking place from December 2021
Higher low on the 6 April 2021 which may lead to a reversal
Gradually closing above the 50MA
MACD sloping up ( a close above 0 would confirm the positive momentum)
RSI in the middle, room for upside
Target USD 680
Stop loss USD 600


Charter Communications will eventually be a good buy opportunityCharter Communications is a pillar of the telecommunications industry and is seeing prices decline right now (April 6, 2021) but will eventually be a great buy opportunity.
Weaknesses
Endless debate between the "oh my god cord-cutters!" vs. the "cord-cutters need broadband internet!" crowds on social media
Doesn't pay a dividend so they fail my "ok boomer" test
Looming threat of 5G revolutionizing connectivity
$174M "scandal" in 2018 post Time Warner Cable acquisition to settle fraud claims
Insider selling in the last two quarters (EVP David Ellen unloading 35,000+ shares) but no insider buying**
Strengths
Revenue increasing yearly from 2018 to 2020*
67% of shares owned by institutional investors (including Vanguard, BlackRock, and State Street) and 29% of shares owned by insiders**
Makes up about 4.7% of the XLC***
TipRanks
15 Analysts covering Charter Communications in the last 6 months
Median price target is $725, about 20% higher than the close on April 6, 2021
Chart
Price fell beneath the 200-Day SMA on April 5, 2021
RSI is dropping and was <40 on April 5, 2021
MACD is increasing in the negative direction
Summary
Charter Communication's price drop is only making them more appealing to small-timers like me, and I will be watching this decline with great interest. The median price target of $725 from TipRanks means more and more upside as the price drops, since I do not believe that broadband internet via cable will be immediately and instantly supplanted by 5G technology. Charter Communication's latest close was below their 200-Day SMA of $612.47, which has almost certainly put them on institutional watchlists worldwide. Passive index fund giants Vanguard, BlackRock, and State Street already own 25+ million shares and though they collectively sold about 1M shares in Q4 2020**, this price decrease may signal significant buys as part of their rebalancing effort.
*Sourced from 2020 10-K filing for Charter Communications
**Sourced from WhaleWisdom
***Sourced from etf com summary of XLC


CHTR LongWilliam Alligator : the stock is in a bullish position because the candlesticks start being above the Teeth, Lips and Jaw.
RSI : the line is under 70, so the stock is not overbought.
Candlestick patterns : there are three white soldiers which are a bullish confirmation.
Overall : it can be interesting to take a buy position on this stock because the indicator indicates that the price is increasing. Entry price is higher than the current price for assurance and stop loss is set at -5%.

ABC BullishCHTR has fallen from multiple rising wedges. I drew 2. It has cleared bottom trendline of all of them now but does not mean it can not fall further.
Rising wedges are a bearish pattern and terminal in the end. Too much buying without healthy pullbacks which interrupts supply and demand.
Possible stop a few tics below C in case a retest of C occurs.
Targets are based on fib levels and the length of the AB leg. As a rule targets 1 are the .386, .618 and .786 levels. Targets 2 are those above that (o: Folks do this differently, this I know..
Not a recommendation
