MTB - 9 months HEAD & SHOULDERS══════════════════════════════
Since 2014, my markets approach is to spot
trading opportunities based solely on the
development of
CLASSICAL CHART PATTERNS
🤝Let’s learn and grow together 🤝
══════════════════════════════
Hello Traders ✌
After a careful consideration I came to the conclusion that:
- it is crucial to be quick in alerting you with all the opportunities I spot and often I don't post a good pattern because I don't have the opportunity to write down a proper didactical comment;
- since my parameters to identify a Classical Pattern and its scenario are very well defined, many of my comments were and would be redundant;
- the information that I think is important is very simple and can easily be understood just by looking at charts;
For these reasons and hoping to give you a better help, I decided to write comments only when something very specific or interesting shows up, otherwise all the information is shown on the chart.
Thank you all for your support
🔎🔎🔎 ALWAYS REMEMBER
"A pattern IS NOT a Pattern until the breakout is completed. Before that moment it is just a bunch of colorful candlesticks on a chart of your watchlist"
═════════════════════════════
⚠ DISCLAIMER ⚠
The content is The Art Of Charting's personal opinion and it is posted purely for educational purpose and therefore it must not be taken as a direct or indirect investing recommendations or advices. Any action taken upon these information is at your own risk.
0JW2 trade ideas

$TRV with a bullish outlook following its earnings #StocksThe PEAD projected a bullish outlook for NYSE:TRV after a positive under reaction following its earnings release placing the stock in drift A with an expected accuracy of 70%.

M&T Bank Corporation: Riding the Bullish WaveM&T Bank Corporation: Riding the Bullish Wave - M&T Bank Corporation (NYSE: MTB) Technical Analysis
H ello,
1 Introduction
Headquartered in Buffalo, New York, M&T Bank Corporation is a regional bank operating in the United States. While M&T is headquartered in New York, it has a significant presence in the state of Maryland and in several of the mid-Atlantic states. It was founded in 1856 as the "Manufacturers and Traders Bank." Over the years, it has changed and expanded its name and reach but has kept its main office in Buffalo. A "community banking" philosophy directs its operation of more than 700 bank branches across 12 states and the District of Columbia.
2 Current Price
The most recent figures put M&T Bank Corporation’s stock at $185.19. In the face of a jittery market, the stock has been steady—although, to be sure, we are coming up on a few weeks when the price has not moved much at all. Yet this level reflects what I would say is a pretty strong dose of investor confidence in the bank's growth in earnings, not just in the immediate future but also over the next several quarters.
3 Moving Averages
5-day Moving Average: $182.50
20-day Moving Average: $180.00
50-day Moving Average: $175.00
200-day Moving Average: $165.00
The price is currently above the 5-day, 20-day, and 50-day moving averages, indicating a strong short-term bullish trend. Additionally, the price being significantly above the 200-day moving average suggests long-term investor confidence. Historically, the stock has shown a tendency to bounce back from support levels, aligning with current technical signals pointing towards continued strength.
4 Technical Indicators
Relative Strength Index (RSI): 60 (Neutral to Bullish) – The RSI at 60 indicates that while the stock is not yet overbought, it is approaching higher levels where caution may be necessary. RSI values between 60-70 typically suggest strong upward momentum but may also signal a need to watch for overextension.
MACD (Moving Average Convergence Divergence): 3.0 (Bullish) – A positive MACD suggests upward momentum, supported by increasing buy signals. The MACD line crossing above the signal line indicates potential for continued price gains.
Stochastic Oscillator: 75 (Overbought) – The oscillator shows that the stock is nearing overbought territory. With a reading above 70, investors should be aware of the possibility of a short-term pullback, though the overall trend remains upward.
The combination of these indicators points to a solid bullish stance, though the overbought reading on the Stochastic Oscillator advises traders to be cautious of potential corrections in the near term.
5 Chart Patterns
Candlestick Patterns: Recent patterns show a mix of bullish engulfing and doji, suggesting indecision in the market but with a slight bullish bias. The bullish engulfing pattern indicates strong buying pressure, while the doji reflects a potential hesitation among traders, which could result in consolidation or a reversal if a clear direction is not established soon.
Support Levels: $180.00, $175.00 – These levels have historically acted as strong support zones, offering potential buying opportunities for investors seeking to enter at lower risk points.
Resistance Levels: $190.00, $195.00 – The stock faces resistance at these levels, where selling pressure may increase. A breakout above $195.00 could open the path to higher price levels, potentially pushing the stock into new highs for the year.
Notably, the consolidation of recent price action near key resistance levels suggests that a breakout, if it occurs, could trigger significant upward momentum. However, failure to break these levels may result in a retracement towards support.
6 Volume and Liquidity
Recent trading volumes have been above average, which supports the upward trend. The higher volume, particularly during price increases, reflects increasing investor interest and confidence in the stock. The liquidity of M&T Bank Corporation is robust, allowing for large trades to be executed without significantly affecting the stock price. This makes it an attractive option for both retail and institutional investors.
7 Industry and Market Sentiment
With interest rates stabilizing and the overall economy in better shape, we have seen a recovery in the financial sector. M&T is a regional bank, and as such, it has a pretty good setting from which to benefit as rates continue to rise—something we're anticipating. Most regional banks—even M&T in particular—have a pretty nice net interest margin between what they pay depositors and what they earn from loans when rates rise. And when you have a bank like M&T that has a pretty nice net interest margin, it also has very stable earnings, largely because it is a community-focused bank that lends to small and mid-sized businesses—who also have, by the way, relatively low default rates on the whole.
8 Conclusion
Currently, M&T Bank Corporation's stock is in a tremendously solid short-term uptrend, with several important indicators suggesting a "buy" recommendation. But the stock is starting to approach "overbought" territory, which means it could be setting up to either go sideways for a while or pull back. Good support levels to look for should this happen are around $180.00 and $175.00. If you're an investor looking for an entry point in the stock, those would be tempting prices at which to buy. On the other hand, if the stock can push and hold above $190.00, we could start to talk about a potential target of $195.00.
Regards,
Ely

baissier sur ce titreJ'anticipe un coup de bambou, sur cette banque et plus largement les banques régionales US.

MTB approaching channel supportM&T Bank Corp. (MTB) presently approaching channel support, able to absorb weekly selling pressures.
From here, (MTB) can gain strength and trade higher eliciting gains of ~20% over the following 2 - 3 months.
If a weekly settlement above the overhead channel occurs, this would lead to a long-term buy signal in (MTB) into later year.
Inversely, closing below channel support puts (MTB) into a sell signal where losses of 20% would be anticipated over the same time horizon.

MTB | Oversold Regional Bank | LONGM&T Bank Corporation operates as a bank holding company for Manufacturers and Traders Trust Company and Wilmington Trust, National Association that offer retail and commercial banking products and services in the United States. The company's Business Banking segment offers deposit, lending, cash management, and other financial services to small businesses and professionals. Its Commercial Banking segment provides deposit products, commercial lending and leasing, letters of credit, and cash management services for middle-market and large commercial customers. The company's Commercial Real Estate segment originates, sells, and services commercial real estate loans; and offers deposit, and credit services. Its Discretionary Portfolio segment provides deposits, securities, residential real estate loans, and other assets; and short and long term borrowed funds, as well as foreign exchange services. The company's Residential Mortgage Banking segment offers residential real estate loans for consumers and sells those loans in the secondary market; and purchases servicing rights to loans, and sub-services residential real estate loans for others. Its Retail Banking segment offers demand, savings, and time accounts; consumer installment loans, automobile and recreational finance loans, home equity loans and lines of credit, and credit cards; mutual funds and annuities; and other services. The company also provides trust and wealth management; fiduciary and custodial; insurance agency; institutional brokerage and securities; and investment management and advisory services; financial management, and planning, leasing, and financing services. It offers its services through banking offices, business banking centers, telephone and internet banking, and automated teller machines. M&T Bank Corporation was founded in 1856 and is headquartered in Buffalo, New York.

$MTB with a Bullish outlook following its earnings #Stocks The PEAD projected a Bullish outlook for $MTB after a Positive Under reaction following its earnings release placing the stock in drift A with an expected accuracy of 77.78%.

$IBN with a Bullish outlook following its earnings #Stocks The PEAD projected a Bullish outlook for $IBN after a Positive Under reaction following its earnings release placing the stock in drift A with an expected accuracy of 81.82%.

MTB BUY ++++ banks are getting oversold hereMTB should bounce back to $156.75 first target $163.47 in coming days/ weeks. Overall the bank stocks along with energy stocks are oversold here and ripe to start positions and ADD on weakness.

$MTB with a Bullish outlook following its earnings #Stocks The PEAD projected a Bullish outlook for $MTB after a Negative Under reaction following its earnings release placing the stock in drift D.

$MTB with a Neutral outlook following its earnings #Stocks The PEAD projected a Neutral outlook for $MTB after a Negative over reaction following its earnings release placing the stock in drift C with an expected accuracy of 83.33%.

$MTB with a Bullish outlook following its earnings #Stocks The PEAD projected a Bullish outlook for $MTB after a Positive Under reaction following its earnings release placing the stock in drift A with an expected accuracy of 75%.

MTB BANK : CMP 158STOCK is In correction from Feb 2017.. which is a weekly timeframe Correction...stock Expected to Breakout till March above 175.. After Breakout stock expected to test levels of 425 in next 2 years...with stop 150

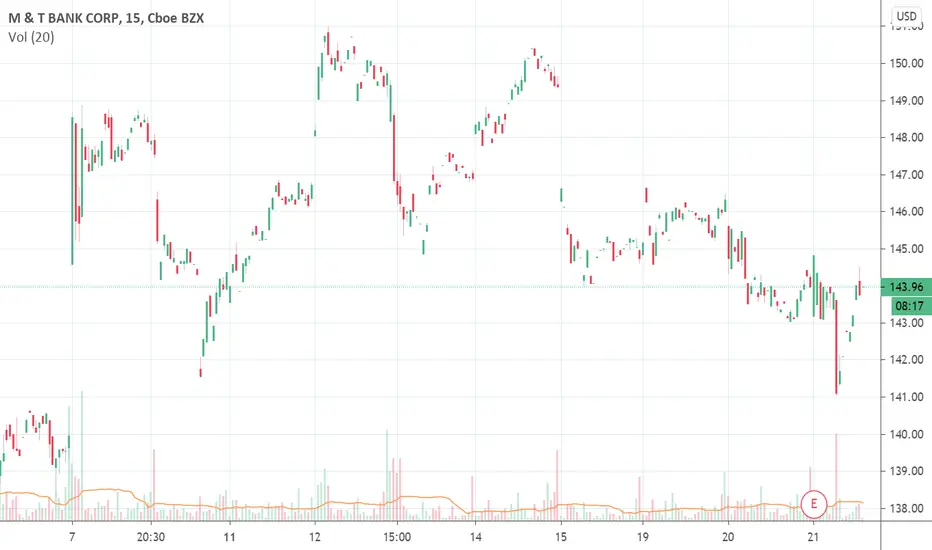
MTB Long Through $144MTB has been basing under $144 all summer
While putting in higher lows first at $128
Then at $132
In time as the next higher pivot low forms the risk to be involved in this base breakout continues to get smaller and smaller
Target $168

M&T Bank Corporation(MTB) Stock Analysis - Semi-Long term TradeHere is a short analysis based on technical support and resistance for M&T Bank Corporation($MTB). If the 114-110 level is broken, the setup is not valid anymore and would exit the trade and look for better entry at 90. Expect to hold this trade for few months.
Two potential buy areas:
Buy area 1: 129
Buy Area 2: 114-110
Two potential sell areas:
Sell Area 1: 140-142
Sell Area 2: 160-165

M&T Bank Corporation Announces Common Stock Repurchase Program!!MTB: M&T Bank Corporation
2021-01-20 16:00:00
M&T Bank Corporation Announces Common Stock Repurchase Program
MTB, Triangle Symmetrical BottomSTATUS = Confirmed
CURRENT CONFIDENCE = 68%
TARGET (EXIT) PRICE = 138.43 USD
BREAKOUT (ENTRY) PRICE = 126.77 USD
DISTANCE TO TARGET PRICE = 7.95%
EMERGED ON = Nov 27, closing price
CONFIRMED ON = Dec 03, closing price
WITH CONFIDENCE LEVEL = 70%
The Symmetrical Triangle Bottom pattern forms when the price of a security fails to retest a high or a low and ultimately forms two narrowing trend lines. As the support and resistance levels consolidate, it forms a triangle (15). Symmetrical Triangles are characterized by the upper line sloping downward and lower line sloping upward. The price movement inside the triangle should fill the shape with some uniformity, without leaving large blank areas.
This pattern is commonly associated with directionless markets, since the contraction (narrowing) of the market range signals that neither bulls nor bears are in control. However, there is a distinct possibility that market participants will either pour in or sell out, and the price can move up or down with big volumes (leading up to the breakout).
Trade idea
If the price breaks out from the top pattern boundary, day traders and swing traders should trade with an UP trend. Consider buying a security or a call option at the breakout price level. To identify an exit, compute the target price by adding the pattern height from the breakout point. The height of the pattern is the difference between the highest high and lowest low.
To limit potential loss when price suddenly goes in the wrong direction, consider placing a stop order to sell at or below the breakout price.

MTB, Triangle Symmetrical Bottom (bullish)I found this pattern at tickeron website with the following data:
STATUS = Confirmed
CURRENT CONFIDENCE = 71%
TARGET (EXIT) PRICE = 138.31 USD
BREAKOUT (ENTRY) PRICE = 126.88 USD
DISTANCE TO TARGET PRICE = 8.64%
EMERGED ON = Nov 27, closing price
CONFIRMED ON = Dec 03, closing price
WITH CONFIDENCE LEVEL = 71%
The Symmetrical Triangle Bottom pattern forms when the price of a security fails to retest a high or a low and ultimately forms two narrowing trend lines. As the support and resistance levels consolidate, it forms a triangle (15). Symmetrical Triangles are characterized by the upper line sloping downward and lower line sloping upward. The price movement inside the triangle should fill the shape with some uniformity, without leaving large blank areas.
This pattern is commonly associated with directionless markets, since the contraction (narrowing) of the market range signals that neither bulls nor bears are in control. However, there is a distinct possibility that market participants will either pour in or sell out, and the price can move up or down with big volumes (leading up to the breakout).
Trade idea
If the price breaks out from the top pattern boundary, day traders and swing traders should trade with an UP trend. Consider buying a security or a call option at the breakout price level. To identify an exit, compute the target price by adding the pattern height from the breakout point. The height of the pattern is the difference between the highest high and lowest low.
To limit potential loss when price suddenly goes in the wrong direction, consider placing a stop order to sell at or below the breakout price.

BUY to M & T BANK CORP DailyHey investors, M & T BANK CORP is in a fake bearish push with some kind of bear variant and low past sell volume. By leaning on the TIMEFRAME M1 we see a hammer bear candle upside down with a huge volume of sales issued. It starts from its last precedent lower to make a reversal there is a strong chance of breaking out the price. To make up for the losses before the session and to go and fill the bearish breaking gap, then the first resistance to pass on the TIMEFRAME M15. And the TIMEFRAME H1 to retest the intermediate median of ANDREWS PITCHFORK then finish the top of TIMEFRAME H4.
Please LIKE & FOLLOW, thank you!

M&T BANK CORP DAILY ANALYSIS Hi friends
the daily chart of this market will experience a downtrend in the coming days but you have to be vigilant of the change of direction towards the opposite
please subscribe to receive my analyzes

M & T Bank Corp (MTB - US) ABC wave patternM & T Bank Corp (MTB - US) is moving down in ABC zigzag down wave pattern. B wave is in triangle, which may be result in sharp reversal. C wave down is already started .

M&T Bank (MTB - US) Sell C wave downM&T Bank (MTB - US) seems within B wave triangle. If brakes then only - sell for C down wave with stops above 110.90.

