SS&C Technologies Holdings, Inc. | Chart & Forecast SummaryKey Indicators On Trade Set Up In General
1. Push Set Up
2. Range Set Up
3. Break & Retest Set Up
Notes On Session
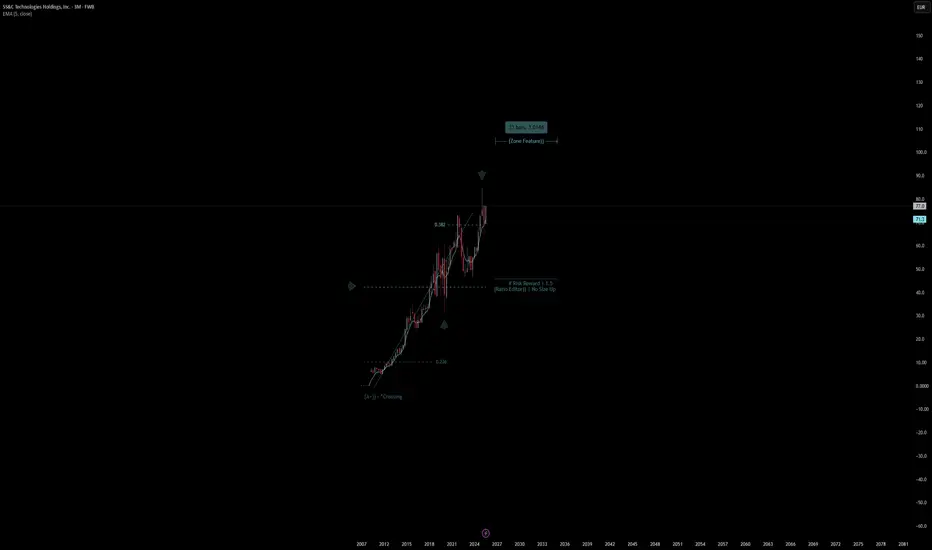
# SS&C Technologies Holdings, Inc
- Double Formation
* (A+)) - *Crossing - Long Entry - *5EMA | Subdivision 1
* (Ratio Editor)) | No Size Up - *Uptrend Area | Completed Survey
* 33 bar
Next report date
—
Report period
—
EPS estimate
—
Revenue estimate
—
3.2 USD
760.50 M USD
5.88 B USD
209.06 M
About SS&C Technologies Holdings, Inc.
Sector
Industry
CEO
William Charles Stone
Website
Headquarters
Windsor
Founded
1986
ISIN
US78467J1007
FIGI
BBG00JVRJB36
SS&C Technologies Holdings, Inc. engages in the development and provision of software solutions to the financial services and healthcare industries. It operates through the following geographical segments: United States, Europe, Middle East and Africa, Asia Pacific and Japan, Canada, and the Americas, excluding the United States and Canada. Its products include advent genesis, antares, asset allocators, AWD, axys, BANC mall, BRIX, DST vision, evare, lightning, and moxy. The company was founded by William Charles Stone in March 1986 and is headquartered in Windsor, CT.
Related stocks
7/23/25 - $ssnc - Interesting, i'd dip buy it7/23/25 :: VROCKSTAR :: NASDAQ:SSNC
Interesting, i'd dip buy it
- 5% fcf yield
- ez does it top line growth, nothing stellar MSD
- mid teens PE
- software-esque ebitda mgns
- nothing that i know well and it's HC, so honestly the fact it's bid, doesn't run similar risks as insurers but ultimately

Why SSNC technologies is bullishAbout 45 trillions of assets are run on the technology provided by SS & C company. Its financial services and health operations have received good feedback from its clients. The principal aspect of this company’s strategy is organic growth and scaling through acquisition which is a double edge swo

Possible swing hi @ $79ish & short to $63I dowse stocks and my pendulum picked this stock a week ago. It got an upgrade Friday and was up a lot. I have an upper target around $79 and the guidance is that it goes back down to around $63.
It could be completely wrong, of course, but I do expect indexes lower, so we'll see. There's also some

$SSNC with a bullish outlook following its earnings #StocksThe PEAD projected a bullish outlook for $SSNC after a positive under reaction following its earnings release placing the stock in drift A with an expected accuracy of 100%.

$SSNC with a Bullish outlook following its earnings #Stocks The PEAD projected a Bullish outlook for $SSNC after a Negative over reaction following its earnings release placing the stock in drift C with an expected accuracy of 50%.

SSNC is one to keep an eye on!* Excellent earnings and accelerating
* Very strong up trend since inception
* High 3-month relative strength in the Tech sector
* Breaking out of a ~5 month base creating a cup and handle pattern
* Depth of the cup is ~15.5%
* Breaking out with higher than 15 day average volume
Trade Idea:
* Gi

Selecting the best of the best of the Russell 2000This one i like for a medium trade. Cup and handle formed with up trend on price action, MACD, and RSI. This looks bullish

fundamental analysis (SSNC)Limit buy - 70,5$
Target - 76,78
Risk/Reward Ratio - 3,06
Stop-loss - 68,05


See all ideas
Summarizing what the indicators are suggesting.
Neutral
SellBuy
Strong sellStrong buy
Strong sellSellNeutralBuyStrong buy
Neutral
SellBuy
Strong sellStrong buy
Strong sellSellNeutralBuyStrong buy
Neutral
SellBuy
Strong sellStrong buy
Strong sellSellNeutralBuyStrong buy
An aggregate view of professional's ratings.
Neutral
SellBuy
Strong sellStrong buy
Strong sellSellNeutralBuyStrong buy
Neutral
SellBuy
Strong sellStrong buy
Strong sellSellNeutralBuyStrong buy
Neutral
SellBuy
Strong sellStrong buy
Strong sellSellNeutralBuyStrong buy
Displays a symbol's price movements over previous years to identify recurring trends.
SSNC5805813
SS&C Technologies, Inc. 6.5% 01-JUN-2032Yield to maturity
6.43%
Maturity date
Jun 1, 2032
SSNC5805814
SS&C Technologies, Inc. 6.5% 01-JUN-2032Yield to maturity
5.75%
Maturity date
Jun 1, 2032
SSNC4809170
SS&C Technologies, Inc. 5.5% 30-SEP-2027Yield to maturity
5.49%
Maturity date
Sep 30, 2027
See all 0L1G bonds
Curated watchlists where 0L1G is featured.

Software stocks: US companies at our finger tips
49 No. of Symbols
See all sparks
Frequently Asked Questions
The current price of 0L1G is 87.8 USD — it has decreased by −0.51% in the past 24 hours. Watch SS&C Technologies Holdings, Inc. stock price performance more closely on the chart.
Depending on the exchange, the stock ticker may vary. For instance, on LSE exchange SS&C Technologies Holdings, Inc. stocks are traded under the ticker 0L1G.
0L1G stock has fallen by −1.78% compared to the previous week, the month change is a −0.78% fall, over the last year SS&C Technologies Holdings, Inc. has showed a 18.08% increase.
We've gathered analysts' opinions on SS&C Technologies Holdings, Inc. future price: according to them, 0L1G price has a max estimate of 110.00 USD and a min estimate of 88.00 USD. Watch 0L1G chart and read a more detailed SS&C Technologies Holdings, Inc. stock forecast: see what analysts think of SS&C Technologies Holdings, Inc. and suggest that you do with its stocks.
0L1G reached its all-time high on Aug 22, 2025 with the price of 90.6 USD, and its all-time low was 40.6 USD and was reached on Apr 3, 2020. View more price dynamics on 0L1G chart.
See other stocks reaching their highest and lowest prices.
See other stocks reaching their highest and lowest prices.
0L1G stock is 0.51% volatile and has beta coefficient of 0.78. Track SS&C Technologies Holdings, Inc. stock price on the chart and check out the list of the most volatile stocks — is SS&C Technologies Holdings, Inc. there?
Today SS&C Technologies Holdings, Inc. has the market capitalization of 21.46 B, it has decreased by −1.40% over the last week.
Yes, you can track SS&C Technologies Holdings, Inc. financials in yearly and quarterly reports right on TradingView.
SS&C Technologies Holdings, Inc. is going to release the next earnings report on Oct 23, 2025. Keep track of upcoming events with our Earnings Calendar.
0L1G earnings for the last quarter are 1.45 USD per share, whereas the estimation was 1.39 USD resulting in a 4.60% surprise. The estimated earnings for the next quarter are 1.47 USD per share. See more details about SS&C Technologies Holdings, Inc. earnings.
SS&C Technologies Holdings, Inc. revenue for the last quarter amounts to 1.54 B USD, despite the estimated figure of 1.51 B USD. In the next quarter, revenue is expected to reach 1.55 B USD.
0L1G net income for the last quarter is 180.80 M USD, while the quarter before that showed 213.00 M USD of net income which accounts for −15.12% change. Track more SS&C Technologies Holdings, Inc. financial stats to get the full picture.
Yes, 0L1G dividends are paid quarterly. The last dividend per share was 0.27 USD. As of today, Dividend Yield (TTM)% is 1.14%. Tracking SS&C Technologies Holdings, Inc. dividends might help you take more informed decisions.
SS&C Technologies Holdings, Inc. dividend yield was 1.29% in 2024, and payout ratio reached 32.71%. The year before the numbers were 1.44% and 36.89% correspondingly. See high-dividend stocks and find more opportunities for your portfolio.
As of Sep 28, 2025, the company has 26.8 K employees. See our rating of the largest employees — is SS&C Technologies Holdings, Inc. on this list?
EBITDA measures a company's operating performance, its growth signifies an improvement in the efficiency of a company. SS&C Technologies Holdings, Inc. EBITDA is 2.13 B USD, and current EBITDA margin is 35.16%. See more stats in SS&C Technologies Holdings, Inc. financial statements.
Like other stocks, 0L1G shares are traded on stock exchanges, e.g. Nasdaq, Nyse, Euronext, and the easiest way to buy them is through an online stock broker. To do this, you need to open an account and follow a broker's procedures, then start trading. You can trade SS&C Technologies Holdings, Inc. stock right from TradingView charts — choose your broker and connect to your account.
Investing in stocks requires a comprehensive research: you should carefully study all the available data, e.g. company's financials, related news, and its technical analysis. So SS&C Technologies Holdings, Inc. technincal analysis shows the sell today, and its 1 week rating is buy. Since market conditions are prone to changes, it's worth looking a bit further into the future — according to the 1 month rating SS&C Technologies Holdings, Inc. stock shows the buy signal. See more of SS&C Technologies Holdings, Inc. technicals for a more comprehensive analysis.
If you're still not sure, try looking for inspiration in our curated watchlists.
If you're still not sure, try looking for inspiration in our curated watchlists.