Trading $TTD to the trendline with 50c exp 11.21Support and Resistance Zones
Next Week (Short-Term)
Immediate Support : The most critical support zone is between $43.10 and $46.20. This is the low from March/April and the current price level. Holding this area is paramount for any bullish case.
Immediate Resistance : The first level of res
Next report date
—
Report period
—
EPS estimate
—
Revenue estimate
—
0.85 USD
393.08 M USD
2.44 B USD
442.95 M
About The Trade Desk, Inc.
Sector
Industry
CEO
Jeffrey Terry Green
Website
Headquarters
Ventura
Founded
2009
ISIN
US88339J1051
FIGI
BBG00JVRMC85
The Trade Desk, Inc. engages in the provision of a self-service and cloud-based ad-buying platform. It operates through the United States and International geographical segments. The firm offers omnichannel advertising, audience targeting, solutions for identity, application programming interface (API), custom, and programmatic, measurement and optimization. The company was founded by Jeffrey Terry Green and David Pickles in November 2009 and is headquartered in Ventura, CA.
Related stocks

TTD could return 200% in the next yearsThe Trade Desk is this big American tech company that basically helps advertisers buy digital ads in a super smart, automated way. They run a platform (called a DSP, or Demand Side Platform) where brands and agencies can set up, manage, and optimize their ad campaigns across tons of channels—like we

bullish on $ttd, potential bottom inbullish on NASDAQ:TTD , potential bottom in
- price fall down to 2020 level, 5 year of chips wiped out
- in key multi-year support zone
- weekly volume surging
- RSI/MACD bullish divergence

A TTD Trade for the Long-Term BullCore Thesis: The Open Internet's Champion
The bull case for The Trade Desk is centered on its position as the leading independent demand-side platform (DSP) in a digital advertising landscape that is rapidly consolidating into "walled gardens" controlled by tech giants like Google, Meta, and Amazon.

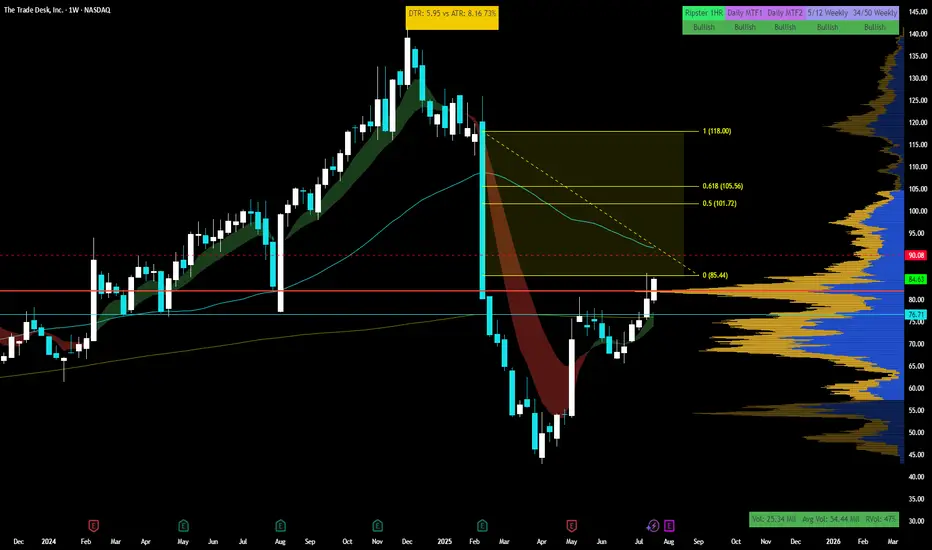
TTDGap range between $56.95 and 87.39. mid target around 0.5 fib level. High target at gap close. RSI at 33.57 marking an under valued stock price. Entry at 46.08 rebound.

TTD crashIn the long term, this stock is in a side cycle and after seeing the top, it starts moving towards the bottom and goes through the natural market cycle, but very fast and intense.
The first support area for this stock is $48-50 and if it encounters strong buyers, it will move towards $69 and after

$TDD calls? Bounce to $50-60+?I bought some TDD calls as it looks like this stock has finally bottomed. The stock has been falling since early August, and fell another 12% yesterday which to me looks like capitulation.
I could see a move from here back up to the 50 - $60 range or so (and can potentially go higher).
I've marked

$TTD Bears in Control, Can Bulls Defend Support?Trend: Weekly chart shows a strong downtrend since the 2024 peak. Price is struggling below major moving averages (EMA cluster overhead).
Support: 44- $45 is key structural support. A deeper breakdown opens risk toward $30.
Resistance: Upside hurdles at $55 and $63 before any trend reversal can be

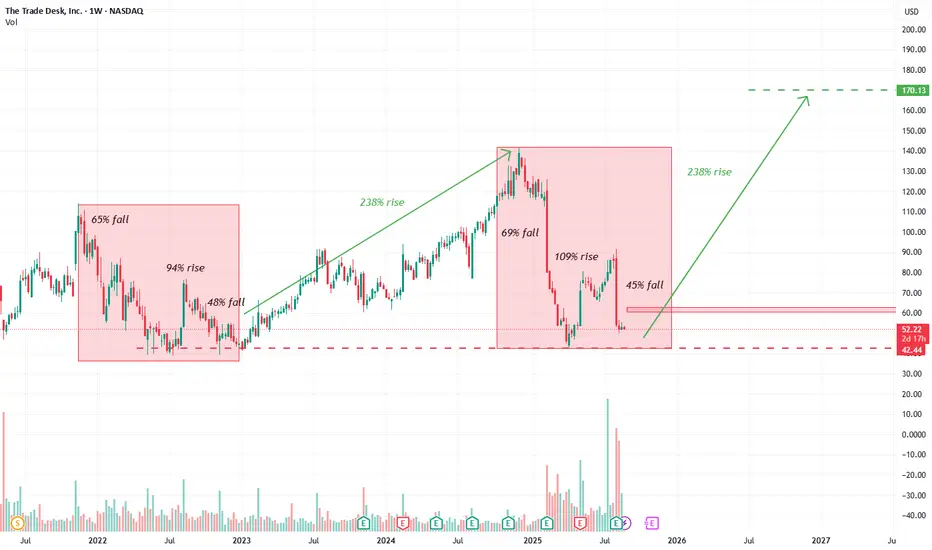
TTD seems to be following its historic pattern. TTD had followed the drop of 69% followed by 90% share rise and 38% drop in 2020 . Following with that we are experiencing similar pattern in 2025. If TTD Follows the historic pattern we can anticipate a more than 200% rise in the price with new ATH in TTD with price $170.
$TTD is ready to move into triple digits - Lock n load Pretty straight forward in the face setup.
Here are pros-
+Got added to s&p500
+massive volume shelf from multi year above 80 which we are above
+beautiful gap from q1 2025 to ride from $85 to $120
++Relative strength strong vs spy for 55 period(thats what I use)
+++ $100 Psych level is a MAGNET -
See all ideas
Summarizing what the indicators are suggesting.
Neutral
SellBuy
Strong sellStrong buy
Strong sellSellNeutralBuyStrong buy
Neutral
SellBuy
Strong sellStrong buy
Strong sellSellNeutralBuyStrong buy
Neutral
SellBuy
Strong sellStrong buy
Strong sellSellNeutralBuyStrong buy
An aggregate view of professional's ratings.
Neutral
SellBuy
Strong sellStrong buy
Strong sellSellNeutralBuyStrong buy
Neutral
SellBuy
Strong sellStrong buy
Strong sellSellNeutralBuyStrong buy
Neutral
SellBuy
Strong sellStrong buy
Strong sellSellNeutralBuyStrong buy
Displays a symbol's price movements over previous years to identify recurring trends.
Curated watchlists where 0LF5 is featured.

Software stocks: US companies at our finger tips
49 No. of Symbols
See all sparks
Frequently Asked Questions
The current price of 0LF5 is 46.90 USD — it has increased by 0.24% in the past 24 hours. Watch Trade Desk, Inc. Class A stock price performance more closely on the chart.
Depending on the exchange, the stock ticker may vary. For instance, on LSE exchange Trade Desk, Inc. Class A stocks are traded under the ticker 0LF5.
0LF5 stock has risen by 6.23% compared to the previous week, the month change is a −10.52% fall, over the last year Trade Desk, Inc. Class A has showed a −58.12% decrease.
We've gathered analysts' opinions on Trade Desk, Inc. Class A future price: according to them, 0LF5 price has a max estimate of 135.00 USD and a min estimate of 34.00 USD. Watch 0LF5 chart and read a more detailed Trade Desk, Inc. Class A stock forecast: see what analysts think of Trade Desk, Inc. Class A and suggest that you do with its stocks.
0LF5 reached its all-time high on Dec 4, 2024 with the price of 141.45 USD, and its all-time low was 4.30 USD and was reached on Feb 12, 2018. View more price dynamics on 0LF5 chart.
See other stocks reaching their highest and lowest prices.
See other stocks reaching their highest and lowest prices.
0LF5 stock is 2.26% volatile and has beta coefficient of 1.10. Track Trade Desk, Inc. Class A stock price on the chart and check out the list of the most volatile stocks — is Trade Desk, Inc. Class A there?
Today Trade Desk, Inc. Class A has the market capitalization of 23.05 B, it has increased by 0.29% over the last week.
Yes, you can track Trade Desk, Inc. Class A financials in yearly and quarterly reports right on TradingView.
Trade Desk, Inc. Class A is going to release the next earnings report on Nov 6, 2025. Keep track of upcoming events with our Earnings Calendar.
0LF5 earnings for the last quarter are 0.18 USD per share, whereas the estimation was 0.18 USD resulting in a 1.34% surprise. The estimated earnings for the next quarter are 0.20 USD per share. See more details about Trade Desk, Inc. Class A earnings.
Trade Desk, Inc. Class A revenue for the last quarter amounts to 694.04 M USD, despite the estimated figure of 685.47 M USD. In the next quarter, revenue is expected to reach 718.74 M USD.
0LF5 net income for the last quarter is 90.13 M USD, while the quarter before that showed 50.68 M USD of net income which accounts for 77.85% change. Track more Trade Desk, Inc. Class A financial stats to get the full picture.
No, 0LF5 doesn't pay any dividends to its shareholders. But don't worry, we've prepared a list of high-dividend stocks for you.
As of Sep 27, 2025, the company has 3.52 K employees. See our rating of the largest employees — is Trade Desk, Inc. Class A on this list?
EBITDA measures a company's operating performance, its growth signifies an improvement in the efficiency of a company. Trade Desk, Inc. Class A EBITDA is 570.57 M USD, and current EBITDA margin is 21.05%. See more stats in Trade Desk, Inc. Class A financial statements.
Like other stocks, 0LF5 shares are traded on stock exchanges, e.g. Nasdaq, Nyse, Euronext, and the easiest way to buy them is through an online stock broker. To do this, you need to open an account and follow a broker's procedures, then start trading. You can trade Trade Desk, Inc. Class A stock right from TradingView charts — choose your broker and connect to your account.
Investing in stocks requires a comprehensive research: you should carefully study all the available data, e.g. company's financials, related news, and its technical analysis. So Trade Desk, Inc. Class A technincal analysis shows the sell today, and its 1 week rating is sell. Since market conditions are prone to changes, it's worth looking a bit further into the future — according to the 1 month rating Trade Desk, Inc. Class A stock shows the strong sell signal. See more of Trade Desk, Inc. Class A technicals for a more comprehensive analysis.
If you're still not sure, try looking for inspiration in our curated watchlists.
If you're still not sure, try looking for inspiration in our curated watchlists.