The Conviction Crescendo: VRSK's Critical Support Test# The Conviction Crescendo: VRSK's Strengthening Defense at Critical Support
## The Power Shift (Points 1→3)
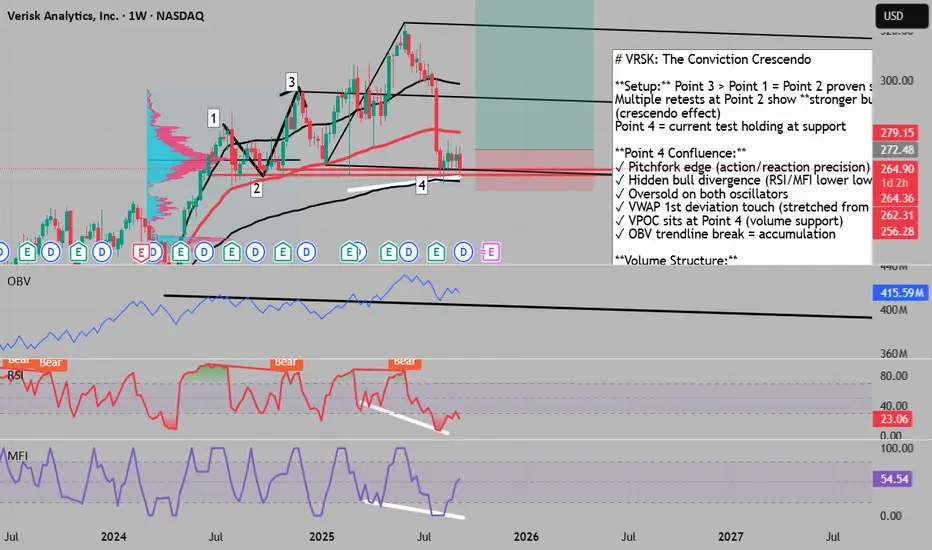
When **Point 3 decisively closed above Point 1**, the market delivered an unambiguous verdict: **Point 2 is now proven support**. The buyers who emerged at Point 2 didn't just challenge the sellers from Point 1 - they **conquered them entirely**, establishing a new high and demonstrating objective strength. This isn't speculation; it's mathematical proof of buyer dominance.
## The Crescendo Effect
What's fascinating here is the **escalating conviction** at Point 2. With multiple retests of this level, each producing a **stronger buyer response** - a crescendo of defensive action. This isn't random; it's the market collectively recognizing Point 2 as increasingly "cheap" territory. **Point 4 represents the current test**, where buyers are once again defending this critical support with conviction.
## Precision Technical Alignment
**The Pitchfork's Mathematical Edge**
Using **action/reaction principles**, the reverse pitchfork precisely identifies Point 4 as the mathematical edge of this move. This isn't arbitrary line-drawing - it's based on Andrews' principle that markets move in measurable, predictable channels.
**Divergence Duality**
• **Price:** Higher low at Point 4
• **RSI/MFI:** Lower lows = **Hidden bullish divergence**
• Both oscillators: **Oversold territory**
This hidden divergence signals continuation of the underlying trend, while oversold conditions suggest immediate bounce potential.
**VWAP Deviation Analysis**
Point 4 touches the **1st standard deviation below VWAP** (anchored from market low). Historically, VRSK has respected VWAP as dynamic support. While this deviation could warn of weakness, within our broader narrative it suggests price has been **stretched too far** from its mean - a rubber band ready to snap back.
## Volume Structure Revelations
**VPOC Magnetic Pull**
The **Volume Point of Control sits precisely at Point 4**. Once our stop order triggers and price moves above the POC, we'll have the market's highest-volume node defending our position - institutional-level support.
**The Exploration Zone Below**
Stretching the volume profile reveals a critical insight: the area below Point 2 is an **exploration zone** - sparse volume indicating these prices were tested but **rejected by the market**. This isn't an acceptance area; it's a void.
The implication? Price won't drift lower aimlessly. Any move below Point 2 would require **strong conviction and purpose** to reach distant value areas. Without that catalyst, the void acts as a natural deterrent.
## The OBV Breakout Signal
The **On-Balance Volume trendline has broken to the upside**, confirming what price action suggests - accumulation is accelerating. Smart money is positioning, even as price tests support.
## Trade Architecture
This setup layers multiple independent confirmations:
• **Structural:** Proven support at Point 2 with escalating defense
• **Mathematical:** Pitchfork edge + VWAP deviation extreme
• **Momentum:** Hidden divergence + oversold conditions
• **Volume:** VPOC support + exploration void below + OBV breakout
• **Behavioral:** Crescendo of buyer conviction with each test
## Risk/Reward Framework
**Entry:** Above Point 4 on confirmation
**Stop:** Below Point 2 (protected by volume void)
**Target 1:** VWAP mean reversion
**Target 2:** Point 3 resistance test
**Invalidation:** Acceptance below Point 2 would negate the "proven support" thesis
---
**Bottom Line:** The repeated tests of Point 2 with increasingly strong reactions, combined with mathematical precision from the pitchfork, divergence signals, and volume structure, create a high-conviction reversal setup where buyers have repeatedly proven their commitment to defending this level.
0LP3 trade ideas
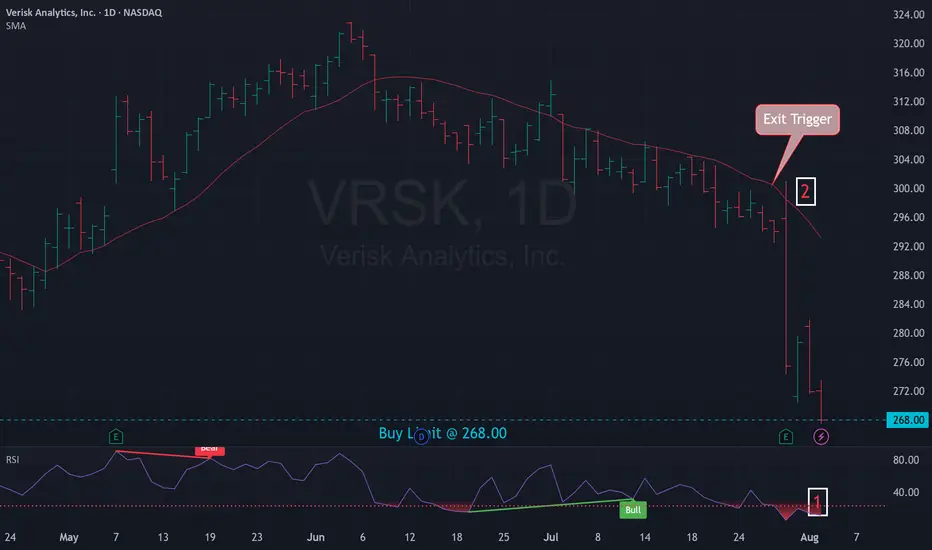
Mean Reversion Trade: VRSK1. RSI in oversold region
2. Price likely to rebound back the the mean
Trade Rules:
Entry Trigger - RSI has cross below oversold region, enter limit buy at close price
Exit Trigger - Close at market when close price cross above exit trigger (Red line)
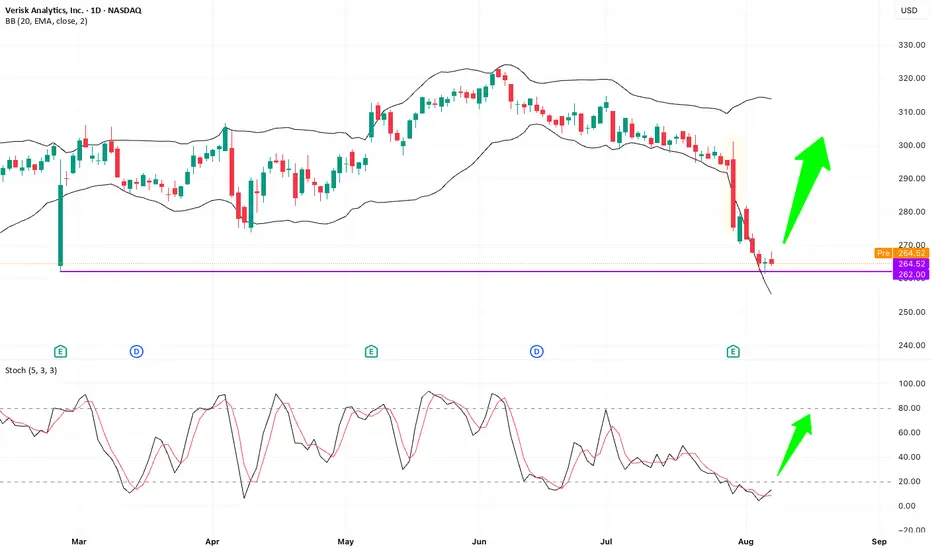
VRSK – Bullish Pin Bar at Key Support after Earnings Flush?NASDAQ: VRSK delivered good quarterly results, yet price action showed a sharp flush-down bar breaking below the lower Bollinger Band. Recently, price retested the key previous low level at $262, triggered some small stop-losses, and closed back at $262 with a bullish small pin bar. Double bottom setup on VRSK.
Key factors supporting this level:
1. Flush-down move likely to stop out weak holders.
2. Break below lower Bollinger Band, indicating short-term oversold condition.
3. Stochastic oversold and attempting a bullish cross.
4. Bullish pin bar closing back above support.
VRSK - 5 months HEAD & SHOULDERS══════════════════════════════
Since 2014, my markets approach is to spot
trading opportunities based solely on the
development of
CLASSICAL CHART PATTERNS
🤝Let’s learn and grow together 🤝
══════════════════════════════
Hello Traders ✌
After a careful consideration I came to the conclusion that:
- it is crucial to be quick in alerting you with all the opportunities I spot and often I don't post a good pattern because I don't have the opportunity to write down a proper didactical comment;
- since my parameters to identify a Classical Pattern and its scenario are very well defined, many of my comments were and would be redundant;
- the information that I think is important is very simple and can easily be understood just by looking at charts;
For these reasons and hoping to give you a better help, I decided to write comments only when something very specific or interesting shows up, otherwise all the information is shown on the chart.
Thank you all for your support
🔎🔎🔎 ALWAYS REMEMBER
"A pattern IS NOT a Pattern until the breakout is completed. Before that moment it is just a bunch of colorful candlesticks on a chart of your watchlist"
═════════════════════════════
⚠ DISCLAIMER ⚠
The content is The Art Of Charting's personal opinion and it is posted purely for educational purpose and therefore it must not be taken as a direct or indirect investing recommendations or advices. Any action taken upon these information is at your own risk.

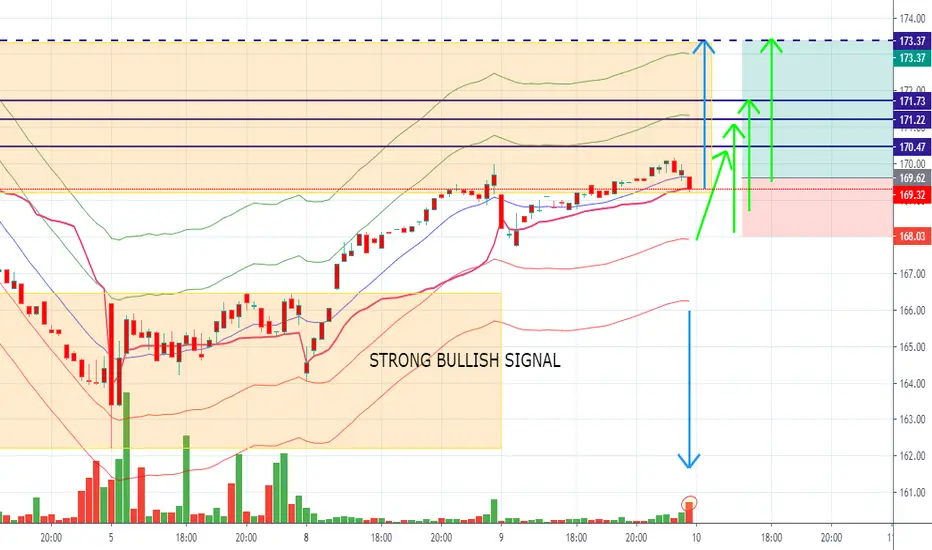
long $VRSK ideacontinuation pattern breakout
bullish staging on higher time frames
blue sky breakout attempt
high probability of follow through
entry $273
stop $261.5
buy 8 shares
max risk $92
sell at fib nodes
+$28 (sell 2 shares at pattern high, set stop break even)
+$96 (sell 3 shares at 1.61 fib)
+$305 (sell 5 shares at 2.61 fib)
no trail

VRSKVerisk Analytics, Inc. is an American multinational data analytics and risk assessment firm based in Jersey City, New Jersey, with customers in insurance, natural resources, financial services, government, and risk management sectors.
Emerging from a short term consolidation zone.

VRSK Entry, Volume, Target, Stop, ResistanceWhen price clears: 222.93
With daily volume greater than: 1.14M
Target: 249.50 area
Stop: Depending on your risk tolerance; 214.08 gets you 3/1 Risk/Reward.
Resistance: 231.50 area
This swing trade idea is not trade advice and is strictly based on my ideas and technical analysis. No due diligence or fundamental analysis was performed while evaluating this trade idea. Do not take this trade based on my idea, do not follow anyone blindly, do your own analysis and due diligence. I am not a professional trader.

VRSK repulsion from bottom of side trendIdea:
Born of local growing trend
Buy - current price
SL < 169.49
Fundamentals:
- Pro: Growing Gross Margin
- Pro: High RoE
- Con: Debt to Equity > 1
Technicals:
- Pro: Clean buy plan
- Con: Reporting is close

$VRSK with a Neutral outlook following its earnings #Stocks The PEAD projected a Neutral outlook for $VRSK after a Negative Under reaction following its earnings release placing the stock in drift D with an expected accuracy of 83.33%.

bullish reclaim of 200WMA for this data companythe fed has quietly halted bottom line reductions of the balance sheet, markets should rally leading into the holiday season and then tank once again. Data is the new currency. Expect Data companies to out perform.

$VRSK with a Bullish outlook following its earnings #Stocks The PEAD projected a Bullish outlook for $VRSK after a Positive Under over reaction following its earnings release placing the stock in drift A with an expected accuracy of 100%.

VRSK - Strong Double TopA double top has formed at the end of this structure
This will lead to the break down of this dominant trend line
Should be considered bearish

$VRSK with a Bullish outlook following its earnings #Stocks The PEAD projected a Bullish outlook for $VRSK after a Negative over reaction following its earnings release placing the stock in drift C with an expected accuracy of 16.67%.

ABC BullishNegative volume is high on VRSK This is volume of down day. Large players buy on down days and supposedly we buy on up days, positive volume days. I do not buy much on up days, especially as of late, but I think the general public will learn to to buy so much when price is up that day. The market is super volatile as of late. Just maybe chill for a down day, sell on a good day for now. I am not sure it is a long term investor's market right now unless they wait for bottoms.
ABC bullish is a pull back pattern and stop goes under C. Targets are measured using fib levels, .38, .618 and .786 in relation to the AB leg for targets 1. C can not be below A and the target is D.
No recommendation.
There was an earnings miss at last report on 2-22.
No recommendation


Bullish Cypher PatternThis is a 4 legged reversal pattern and idea is to get in at the end of this pattern if you are going long...if you know the pattern well, you can trade every leg by going long then short...
The cypher is recognized by C being higher than A and D being higher than X. The point of completion zone is at D and this level is often retested. Often you will see volatility at the PCZ. D should be close to the 0.786 of XC (Not XA) and B can retrace anywahere from 0.38 to 0.618 of XA..so to find D you could place your fib table to encompass entire pattern and look for the 0.786 (nothing is exact but in the proximity) and be sure it stops there (hard part) (o: You have ruled out several other patterns because C is above A. There are several ways to figure this out and it almost gives you a headache explaining so I will stop now..lol..Note XC is NOT XA (o: I feel like I am back in algebra class for some reason!
B needs to retracebetween 38.2 and 61.8 percent of XA, at least 38.2 percent, but not exceeding 61.8 percent (Wide range and at this point you do not know which pattern this is)
So although the Cypher pattern makes sharp reversals, the trend is still upwards.
Learning harmonic patterns is challenging but worth it in the long run for me. I enjoy it and was always pretty good in math (for a girl)
Possible stop below X, or D, or last pivot low, or where you feel comfy..I see pivots at all the points in this pattern (X,A,B,C) except D according to the pivot tool I am using on here. So keep an eye on it as retests are always possible..
Not a recommendation

Range reversal #stocksBuying here with a stop at 187.00 looking for 210 hopefully. VRSK has had a pull back so far this month but the macro trend remains positive.

SetupAs we break through the range lows we will either have continuation to the downside or a reversal back higher into the range. Range highs and lows are the most important action areas and offer the best risk reward setups


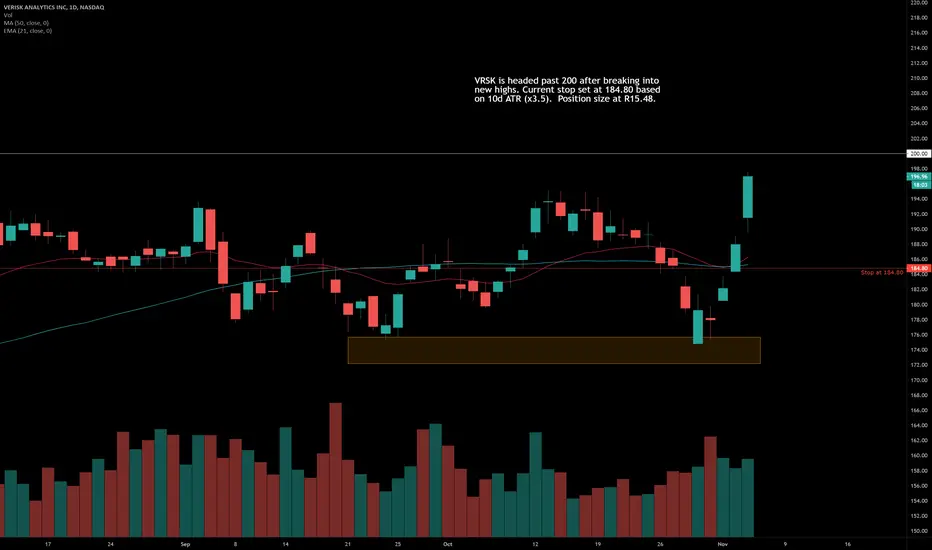
VRSK at new highs, to break above 200VRSK is headed past 200 after breaking into new highs. Current stop set at 184.80 based on 10d ATR (x3.5). Position size at R15.48.
Verisk Analytics, Inc. (VRSK) long.All description on the chart.
Please, don't forget to like and follow.
Thank you.

Exam Analysis on VERISK ANALYTICSHey investors, VERISK ANALYTICS a close on the range with the largest volume of the session following a selling power, it should make an increase can be considerable.
Please LIKE & FOLLOW, thank you!