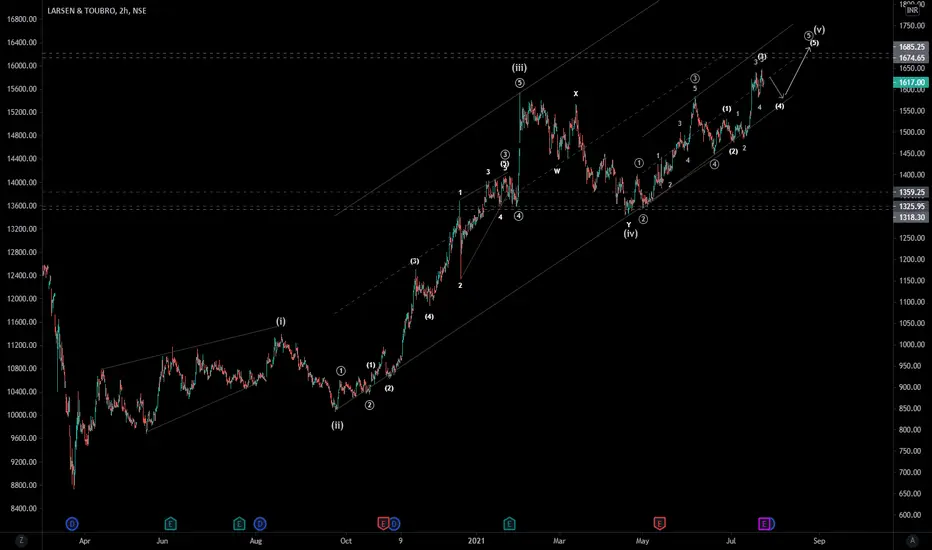
LT - Elliott wave analysis - 5th of 5th wave up It is in 4th of 5th of 5th wave and form small corrective price action before it go for new high towards 1670 level.
Larsen & Toubro Limited Shs Sponsored Global Depositary Receipt Repr 1 Sh Reg-S
No trades
Trade ideas
LT breakout tradeRS is positive, RSI above 50 shows that stock has momentum. and its results are about to come in coming days so there will be good chance that stock will be 52week high. keep watching it.

Larsen and Toubro | Multiyear breakout | PositionalLT has broke out of its all time high in the last week. Now the previous resistance is being tested. If the stocks fails to break the support, we can expect a 1:3 trade with stop loss 1470.
Sharing this for educational purposes only

LARSEN & TOUBRO Daily Bearish Shark
Vertical dotted line is Ultra high volume up bar , Higher volume- Professionals are selling into the public buying
SET UP BECOMES VALID ONLY when RSI is below 70 and IF Price breaks ULTRA HIGH VOLUME Candle LOW with LOW VOLUMES & with NO DEMAND l.e place for short


L&T cup and handle breakout pattern and ↗️➡️↗️ possibilityDear traders,
Friends I came with a classical cup and handle breakout pattern.
Along with this idea we saw that there was a impulse before this consolidation (presently) . So we can guess a impulse in future.
The stock has already give the breakout and this is the time to play a buy move.
We expect a bullish movement for long term.
I setup a take profit and stop loss but I want to suggest in this trade that the trailing Stop loss strategy is the best 👍.
🧐➡️ After breakout there is a slow movement because of the overbought condition.
We can see the overbought condition by the RSI indicator.

The dark horse.This is a weekly chart of LT. The stock has given a breakout on weekly chart. This breakout is called as breakout above multiple tops . If you see, in the past this stock has taken resistance multiple times around 1560 to1600 levels. This week, however, it has managed to give a clear breakout. 1600 used to be its all time high and it has broken it with huge volumes. This stock will be moving under blue sky, means there's no upper cap for this stock. My target is around 3200. It should take around 2 years, as mentioned earlier. It's a great fundamental company so investors should take this opportunity to buy this stock.

LT#LT (Larsen & Toubro)
Given weekly closing above previous all time high of 2019 & made a new all time high.
CMP- 1618
SL- 1440 (closing base)
Target- 1760.....2000.....2150


LARSEN & TOUBRO WEEKLY BEARISH BAT with TRIPLE TOP
Within 3-5 price bars need the confirmation from a BEARISH CANDLE with RSI Below 70
POTENTIAL SELL

LARSEN & TOUBRO Monthly Strong REVERSAL ZONE
BEARISH Deep Crab On Type 1 Entry Earlier Pattern given good reaction & Hit TARGETS
now price is again in PRZ Zone of Pattern it becomes a TYPE2 Entry which is REVERSAL
Within 3-5 price bars need the confirmation from a BEARISH CANDLE with RSI Below 70
POTENTIAL SELL

fibonacci retracement on LTbuy
trend is up
cnx infra given breakout of 10 years
bounce from support
bounce from fibo 50% retracement level
target 1596: 1706
sl closing below 1529

LT - Bullish - Consolidation & nearest to Breakout LT is Bullish, Creating Ascending Triangle with respect of Trendline and forming Squeeze nearest to breakout


SHORT TERM INVESTMENT VIEW IN #LT CUP & HANDELSHORT TERM INVESTMENT VIEW IN #LT CUP & HANDEL
BUY LT CMP @ 1500 ADD MORE ON ABOVE 1530
STOP LOSS - 1450 CLBS
TARGET - 1560 1600 1650 1700 ++
TIME FRAME - 30 TO 45 DAYS


L&T :: Looking Bullish on Daily chartL&T is very near to forming an inverse H&S pattern on daily chart frame with neckline at 1584. If it breaks this level and sustains above it the next target should be around 1700 to 1800 range.
Keep an eye on this...
Note: Only for education purpose not a recommendation


L&T - Again failed to surpass key resistance zone L&T seems like again failed to surpass key resistance zone...
Stock has made many attempts in this zone past few months but failed to do so and even we can see clear trend change.
As per chart watch out for these levels if keeps breaking than we can see 1327 or below it... View negative above 1426...
Note that this is not a stock recommendation...
Do your own analysis don't invest and trade blindly...
1300 to 1290 is a strong demand zone and we might see trend reversal from that zone... View negative below 1280...
