LT--Drop Base Drop??This stock is in consolidation state...
drop base drop is going to observe in this stock...
So keep your view to bearish in this.
But a manipulation move to topside chance is more, then fall happens.
We have a demand Zone lies at bottom, look for buying at that demand Zone.
Larsen & Toubro Limited Shs Sponsored Global Depositary Receipt Repr 1 Sh Reg-S
No trades
Trade ideas

10% correction in L&T, should we buy now?
L&T has corrected around 10% from its recent high. I plan to buy it if it stay in green tomorrow.

LT .. wait for retraceLT amazing bull run..
Waiting for retracements to 0.5 2600 or 0.618 levels 2260

LT--Retracement or Reversal??This stock observed a strong fall from the resistance...
broken the trendline as well....
if this is a retracement price again continue its upward momentum...
if this is a reversal price will gives us retest to the trendlines fall back...
Look for buy opportunities when price comes to the demand area...shorting opportunities when it comes to resistance area...

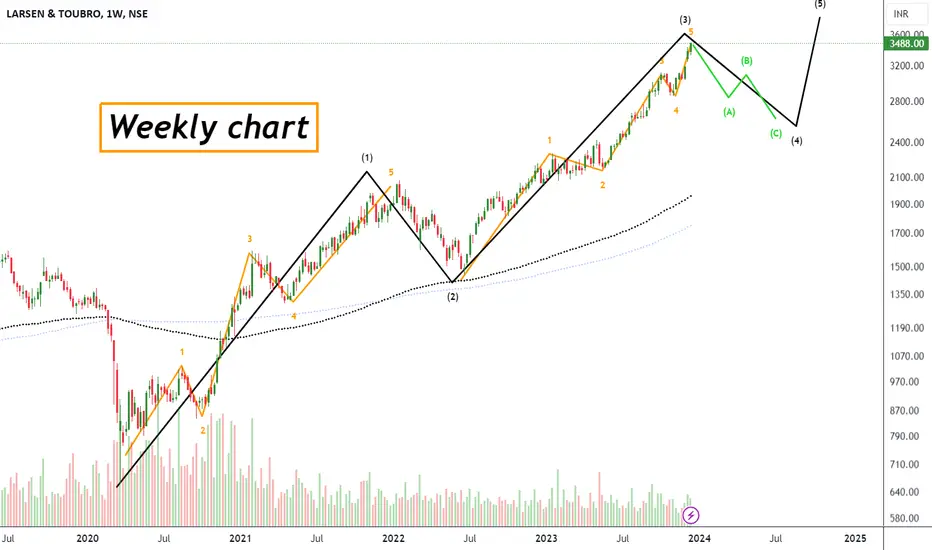
Imaginary path for Larsen & Toubro (L&T) India Weekly chart, the stock formed a rising wedge and reached the target.
The technical indicator RSI reached an over-bought zone..
This is my imaginary path for the next 14 months: down zigzag to S1 at around 3030, then up zigzag to R1 at around 4065
Above 3750 for 2 weeks, will void this path, and the stock will target 5750 long-term.


LT will reach 4000 ? cmp 3429 15% Upside PotentialLT broke the 52 week high and also broke the higher resistance
cmp 3429.
Target 3560, 3769, 3812, 3900, 4000
10% - 15% Upside Potential

Larsen&Toubro should be soon at the INR 4k markThe stock looking to move towards the INR 4000-4150 zone in wave "III" structure.
The stock was previously in a Wave "I" structure between Oct end till Dec end.
The correction to the wave I in the form of wave II was a mere 23.8% retracement of the first wave and lasted for a mere 3 days. This a reflection of strength in the stock. The stock is also the 5Th best performing stock in the Nifty 50 index in the Year 2023,and the same strength can be again witnesses in these shallow retracements.
Wave i of III has already been spotted on the stock and now it looks to complete the rest of the Wave III towards the INR 4150 mark.
On the downside INR 3400 is a crucial area and should be considered as "sl" for all sorts of longs initiated on the stock from here on.

L&t in consolidationl&t is trading in a rectangular channel.
close above 3550, will give a next move towards 3685
a 4% upmove is expected

MBlockStopLoss & Two Targets. T2 is ambitious. T1 has better shot on achieving.
This is for educational purposes only.

LTNSE:LT
LIFE TIME BO !!!!!!!!!!!!!!!!!!
One Can Enter Now ! Or Wait for Retest of the Trendline (BO) Or wait For better R:R ratio
Note :
1.One Can Go long with a Strict SL below the Trendline or Swing Low of Daily Candle.
2. Close, should be good and Clean.
3. R:R ratio should be 1 :2 minimum
4. Plan as per your RISK appetite
Disclaimer : You are responsible for your Profits and loss, Shared for Educational purpose

Larsen toubro Weekly AnalysisLt share weekly analysis
Lt share current time move 3rd wave . be aware price come down 4th wave
Larsen Tubro share AnalysisLT share one hour chart analysis
Larsen tubro share current time move 5th wave . 2 or 4 wave vertical trend line very importanat this trendline break . Upside 5 th complete and price again come correction

Larsen tubro share analysisLarsen tubro share current time move 5th wave . 2 or 4 wave vertical trend line very importanat this trendline break . Upside 5 th complete and price again come correction

Cup with handle BO in $NSE:LTNSE:LT
Pattern details:
Up-trend before forming Cup with handle pattern
Cup with ~8% correction and length of cup 22 bars (31 days)
Handle length is 8 bars (13 days) and ~3% correction.
BO Volumes are good
Disc - invested, for educational purposes only

Chart of the week. Techno-Funda pick. LTThis is one of my favorites. I am recommending this stock since 1450 and continuously buying at each breakouts. Recently I recommended it when it was trading around 2450. Now again its a good level to enter or average your stock (always at higher price). As recommended earlier, 30/6/23, stock is ready to hit 3500 levels.
T -3500
Sl - 3045

Larsen & Toubro - Ichimoku BreakoutStock Name - Larsen & Toubro Limited
Ichimoku Cloud Setup :
1). Today's close is above the Conversion Line
2). Future Kumo is Turning Bullish
3). Chikou span is slanting upwards
All these parameters are showing bullishness at Current Market Price
and more bullishness AFTER crossing 3200
#This is not Buy and Sell recommendation to any one. This is for education purpose and a helping hand to learn trading in Market.
#CloudTrading
#IchimokuCloud
#IchimokuFollowers
#Ichimokuexpert
I hope you all like my analysis.
Please do share your thoughts into comment section.
Please give a like, share & subscribe for daily analysis.


LT--@Resistance Zone??A strong bullishness is observed from this stock from 3040 levels...if this is an exhaustion or initiation.
Previously a strong fall is observed from the levels 3120 levels...
now its again at resistance zone...if this move is initiated by buyers again this will break the resistance soon...if this is an exhaustion of buyers it will breaks the support at 3040.wait until it confirm its bullish or bearish then look for sell or buy..until keep in wait and watch mode...


LTThese are swing ideas which you can add your watchlist and analysis for yourself !
Keep on your radar!
This content only education purpose!
❗I am not sebi ragister❗


INTRADAY LT SHORTSHORT @ 3060
stop loss: 3075
target : 3032
NOT A SEBI REGISTERED ADVISOR , its for educational purpose only
