Bearish Divergence on Bigger tf but...OGDC Analysis
Closed at 270.21 (10-12-2025)
Strong Resistance Zone around 272 - 290.
Bearish Divergence on Bigger tf but,
Monthly Closing above 238 - 240 would be a +ve sign.
Crossing 290 with Good Volumes may lead the price towards 350 - 352
Oil & Gas Development Co. Ltd. Sponsored GDR RegS
No trades
Next report date
—
Report period
—
EPS estimate
—
Revenue estimate
—
1.40 USD
608.20 M USD
1.44 B USD
About Oil & Gas Development Co. Ltd.
Sector
Industry
CEO
Ahmed Hayat Lak
Website
Headquarters
Islamabad
Founded
1961
Identifiers
2
ISIN:US67778Q2003
Oil & Gas Development Co. Ltd. engages in the exploration and development of oil and gas resources. It operates through the Oil and Gas and Renewable Energy segments. The Oil and Gas segment focuses on the exploration, production and sale of oil & gas, undertaken through OGDCL. The Renewable Energy segment includes renewable energy development activities, undertaken through OREL. It also involved exploration, drilling, process and plants, production, reservoir management, and engineering support. The company was founded on March 4, 1961 and is headquartered in Islamabad, Pakistan.
Related stocks

OGDC - Technical Update - Round Bottom OGDC is forming a strong rounded bottom on the 1h chart. Price is pressing against the 273 neckline, while the major breakout level sits at 286. A clean breakout above these zones could open room toward 305+. Watching for either a direct breakout or the formation of a small handle. Overall structu

OGDC strategyOGDC can be bought at the current price, but it is better if we get it a little cheaper.
We should try to enter the buying zone.

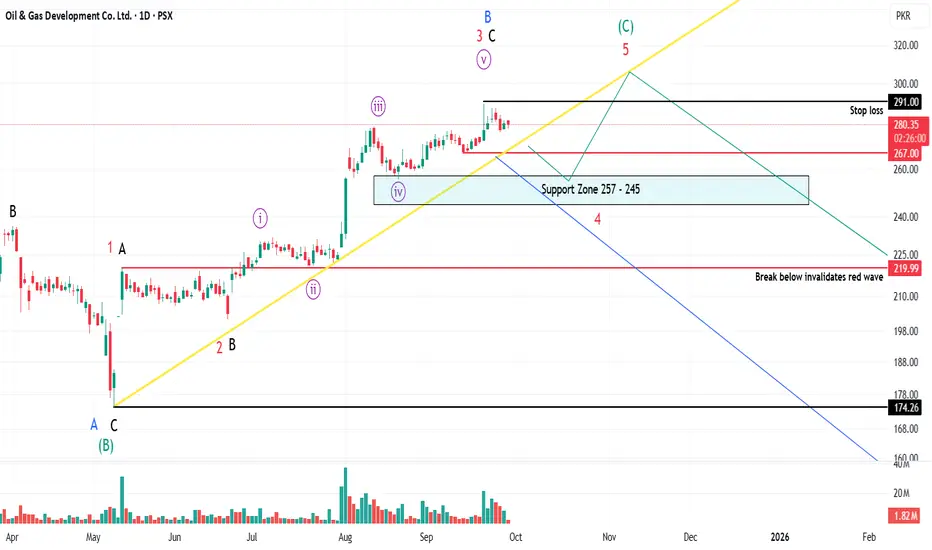
OGDC PROBABLY IN WAVE ' 4 ' or ' C ' - SHORTThis is in continuation to our ongoing tracking of OGDC wave structure.
If our wave count is correct then the 5th wave is almost over and a downtrend will start taking price toward 257- 245 level as wave 4 and further down if this turns out as wave C
Alternately, if price goes above the 291 level
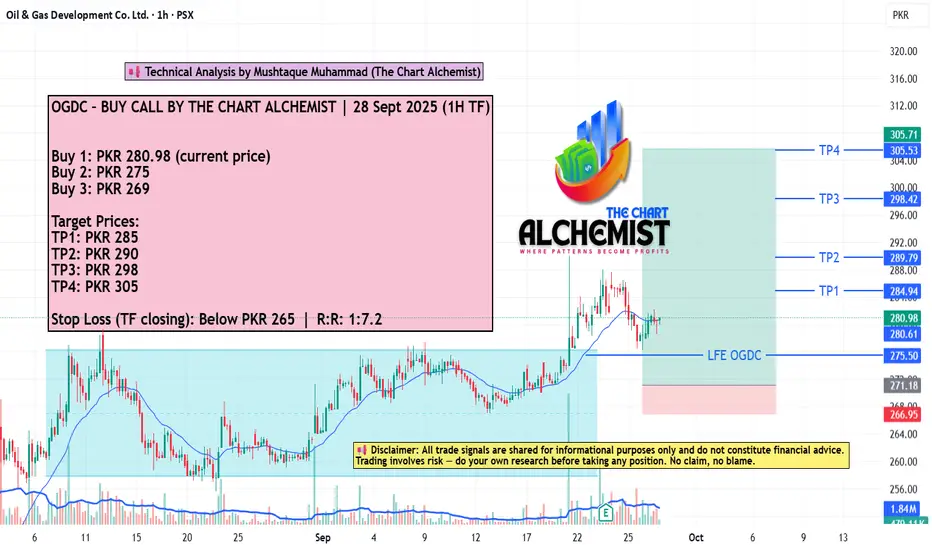
OGDC – BUY CALL BY THE CHART ALCHEMIST | 28 Sept 2025 (1H TF) OGDC – BUY CALL BY THE CHART ALCHEMIST | 28 Sept 2025 (1H TF)
The stock recently went through a reaccumulation phase (marked in light blue) and broke out, achieving a high of PKR 290. After attending a recent high, the stock entered a pullback, which now seems to be retesting the breakout levels. Th
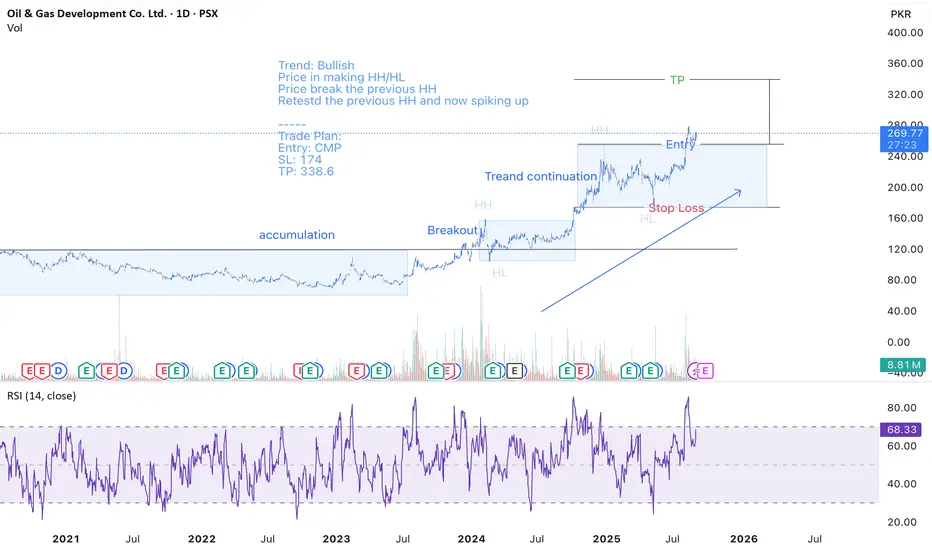
PSX - OGDC - Long Position Trend: Bullish
Price in making HH/HL
Price break the previous HH
Retestd the previous HH and now spiking up
-----
Trade Plan:
Entry: CMP
SL: 174
TP: 338.6
OGDCAbove 249–250 = bullish continuation.
Below 234 = trend reversal risk.
Watch volume confirmation near 272–278 breakout zone.

OGDC PROBABLY IN WAVE ' 5 ' - LONGThis is in continuation to our ongoing tracking of OGDC wave structure.
If our wave count is correct then prices will take support from the 257-250 levels and will target the upside level of 279 - 290. Our wave count suggest that prices might even go above 300+ but that depends on how strong the bu

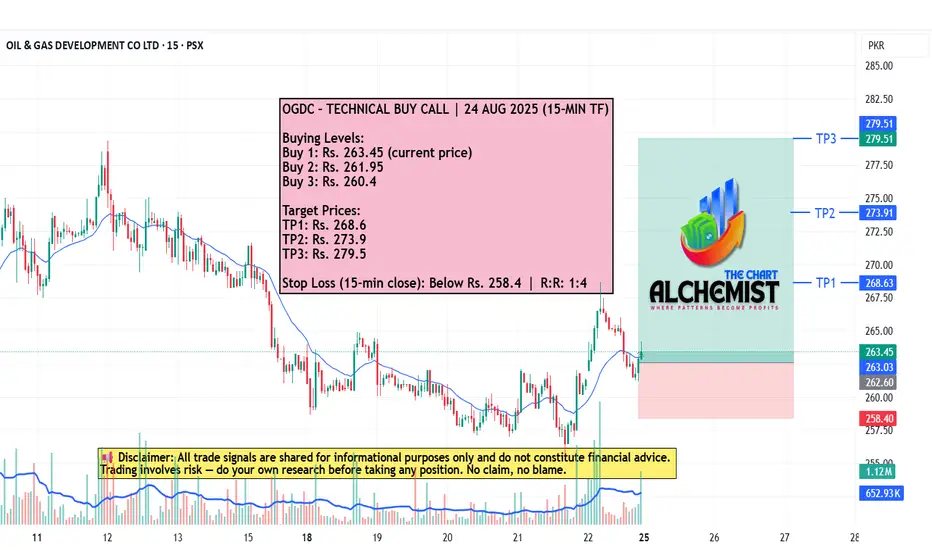
OGDC – TECHNICAL BUY CALL | 24 AUG 2025 (15-MIN TF) OGDC – TECHNICAL BUY CALL | 24 AUG 2025 (15-MIN TF)
The stock pulled back from a high of Rs. 279.4, and the pullback now seems to have completed within a bullish structure. Price action indicates readiness for an upward move.
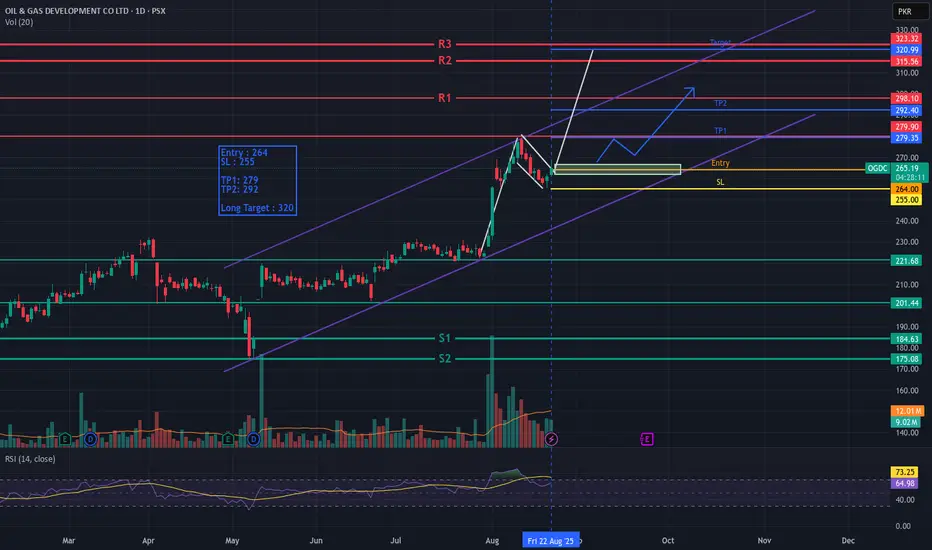
OGDC – Bullish Flag Breakout SetupOGDC has formed a Bullish Flag pattern, indicating potential continuation of the uptrend. The stock is showing strength and is likely to resume its upward momentum.
📌 Trade Setup:
Entry: 264
Stop Loss: 255
Target 1: 279
Target 2: 292
Long-term Target: 320
Risk management is key – position sizin
See all ideas
Summarizing what the indicators are suggesting.
Neutral
SellBuy
Strong sellStrong buy
Strong sellSellNeutralBuyStrong buy
Neutral
SellBuy
Strong sellStrong buy
Strong sellSellNeutralBuyStrong buy
Neutral
SellBuy
Strong sellStrong buy
Strong sellSellNeutralBuyStrong buy
An aggregate view of professional's ratings.
Neutral
SellBuy
Strong sellStrong buy
Strong sellSellNeutralBuyStrong buy
Neutral
SellBuy
Strong sellStrong buy
Strong sellSellNeutralBuyStrong buy
Neutral
SellBuy
Strong sellStrong buy
Strong sellSellNeutralBuyStrong buy
Displays a symbol's price movements over previous years to identify recurring trends.