Will Reliance go further down?? As per Harmonic XABCD pattern, if Reliance will sustain below 1340 in this week, it may go further down to 1166
Reliance Industries Ltd Sponsored GDR 144A
No trades
What traders are saying

Reliance : 15%+ Upside StartsNSE:RELIANCE
Reliance to gear up for up move above 1402. Targets are 15%+ (~ 1650)
Reasons:
1. Double bottom at RSI.
2. US tariff deal will supportive
3. Prices tapped the support zone.
# If Reliance will move, expect the market (NIFTY) to move significantly.

RELIANCE INDUSTRIESAfter recent results, Reliance has came down to it important support near 1420.
It has already fallen more than 10% in last 2 weeks
one can keep an eye for the targets of 1600


RELIANCE Looks good here Wait for hourly MSS with displacement then entry on FVG
here offering decent risk rewards
this is only for educational purpose

Reliance Industries Ltd (Weekly Chart) – Cup & Handle Formation Reliance Industries Ltd (Weekly Chart) – Cup & Handle Formation
Long-Term Bullish
Short-Term (Swing / Trading View):
Price is consolidating near ₹1,450–1,500, forming the handle portion of a larger Cup & Handle pattern.
Immediate support: ₹1,430–1,460 (handle base / channel support).
Immediate resistance: ₹1,495–1,520 (cup rim / breakout level).
Short-term outlook:
Sustained move and weekly close above ₹1,520 can trigger a quick upside toward ₹1,600–1,650.
Breakdown below ₹1,430 may lead to consolidation toward ₹1,300, without damaging the long-term structure.
Long-Term (Positional / Investment View):
Clear Cup & Handle pattern visible on the weekly timeframe, supported by a rising channel.
Pattern confirmation:
Sustained breakout above ₹1,520 with volume.
Measured targets (long term):
₹1,900–1,950 (medium-term)
₹2,250+ (pattern projection)
₹2,700+ (upper channel / extended cycle target)
Major long-term support: ₹1,300–1,350 (trend remains intact above this zone).
Conclusion:
Reliance Industries displays a textbook Cup & Handle structure, indicating long-term bullish continuation. Short-term consolidation is constructive, and any breakout above the rim strengthens the case for multi-year upside. Long-term investors may continue to hold or accumulate on dips, while traders should watch for confirmation above ₹1,520.

Reliance long with monthly demandReliance – Trade Snapshot
Trend & Support:
Overall Trend: Strong UP (Yearly → Daily → ITF)
Support Zone: 1,422 – 1,432
Upside Potential: 1,932 → 1,933 → 2,116
Trade Plan:
Entry SL Qty 1st Target Positional Target RR
1,432 1,310 1,000 1,932 1,933 4.02
Capital & Profit:
Total Buy Value: 1,432,000
Capital Committed: 358,000
Net Profit if Trade Favors: 518,331
Net Loss if Stop Hit: 129,019
Brokerage / Taxes: 0.49% (~7,019)
Key Technicals:
Last High Supply / MTF High: 1,615 / 1,616
Last High Demand: 1,115
Variance (Supply – Demand): 500
Gann Points: High 1,592 / Low 1,572
ROI: 138% in 4 months / 9.7% annualized
✅ Insight:
Strong multi-timeframe uptrend
Support is solid at 1,422–1,432
High RR (4.02) with substantial upside potential

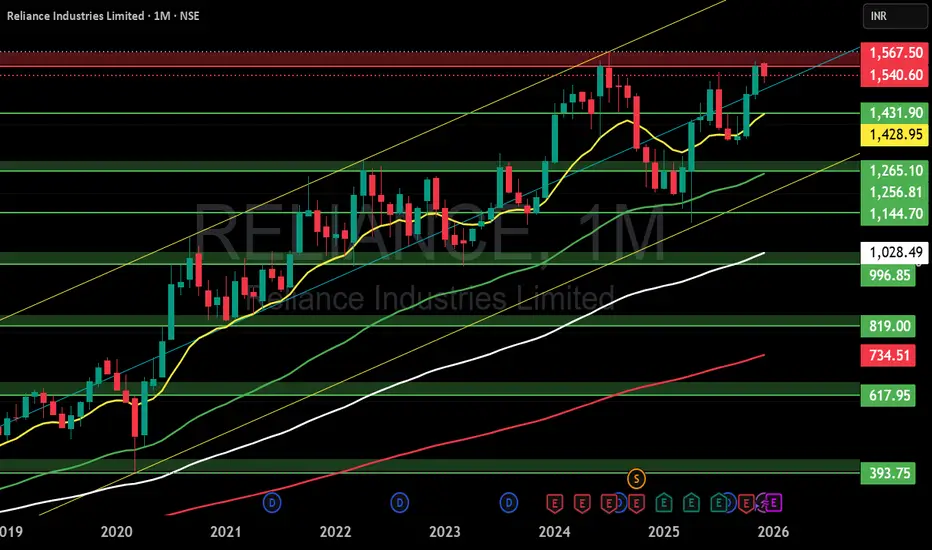
RELIANCE | Monthly | Structural ViewPrice continues to trade within a long-term rising channel originating from the 2016 secular breakout.
The broader trend remains up, but current behavior reflects maturity and consolidation , not early-stage expansion.
🔹 Primary Demand: 1270–1300
🔹 Secondary Demand: 1050–1100
🔹 Structural Risk: Sustained monthly close below 1050
🔹 Context: Upper-channel region → favors time correction over momentum expansion
RSI remains neutral-positive, confirming trend digestion.
No targets. No forecasts.
Structure guides — price decides.
Disclaimer: Educational & structural analysis only. Not investment or trading advice. Markets involve risk.
#Reliance
#IndianStocks
#LongTermInvesting
#MarketStructure
#PriceAction
#DemandSupply
#TrendAnalysis
#InvestorView
#NoTargets
#RiskManagement

View on RelianceLook like reliance is completed 5 wave and now in correction mode. Depth of correction is at 989 but its look like flat correction(5-3-5).
Note:- This is only for education purpose.

RELIANCE Weekly Bullish Flag Breakout | Multiple Targets to 1758RELIANCE Weekly Bullish Flag Breakout | Multiple Targets to 1,758.40 | Weekly Analysis
━━━━━━━━━━━━━━━━━━━━━━━━━━━━━━━━━━━━━━━━━━━
📊 TECHNICAL SETUP
Current Price: 1,586.70 (+0.70% | +11.00)
Timeframe: Weekly (1W)
Symbol: RELIANCE (Reliance Industries Limited)
Exchange: NSE
Category: Stock / Energy Sector
━━━━━━━━━━━━━━━━━━━━━━━━━━━━━━━━━━━━━━━━━━━
🎯 PATTERN ANALYSIS
RELIANCE demonstrates a STRONG WEEKLY BULLISH FLAG BREAKOUT pattern:
✅ Flag Structure: Clear flagpole followed by tight consolidation
✅ Breakout Confirmation: Price decisively breaking above upper flag boundary on weekly close
✅ Support Levels: Multiple support zones identified with strong holding
✅ Volume Profile: Healthy accumulation visible in weekly volume patterns
✅ Momentum: Sustained bullish momentum with consistent weekly closures above key levels
The stock shows textbook uptrend characteristics with proper support/resistance relationships, confirming the bullish structural bias.
━━━━━━━━━━━━━━━━━━━━━━━━━━━━━━━━━━━━━━━━━━━
📈 PRICE TARGETS (Progressive Levels)
1st Target: 1,609.80 (+1.5% from current)
2nd Target: 1,639.60 (+3.3% from current)
3rd Target: 1,669.40 (+5.2% from current)
4th Target: 1,699.20 (+7.1% from current)
5th Target: 1,729.00 (+9.0% from current)
6th Target: 1,758.40 (+10.8% from current)
These progressive targets represent key resistance zones and profit-taking levels along the uptrend path. Each level provides strategic exit points for partial position management.
━━━━━━━━━━━━━━━━━━━━━━━━━━━━━━━━━━━━━━━━━━━
🛡️ RISK MANAGEMENT
Entry Zone: 1,580.00 (Breakout confirmation point - wait for weekly close above 1,585)
Stoploss: 1,520.00 (Weekly support - critical level)
Risk/Reward Ratio:
- Risk (1,580 to 1,520) = 60 points
- Reward (1,580 to 1,758) = 178 points
- R:R Ratio = 1:2.97 (Excellent)
Position Sizing: Risk only 1-2% of capital per trade
Stoploss is placed BELOW major weekly support level.
Consider scaling in on dips toward intermediate support.
━━━━━━━━━━━━━━━━━━━━━━━━━━━━━━━━━━━━━━━━━━━
📍 KEY SUPPORT & RESISTANCE
Immediate Support: 1,580.00 (Recent breakout level)
Secondary Support: 1,520.00 (Stoploss / Major support)
Resistance 1: 1,609.80 (1st Target)
Resistance 2: 1,699.20 (Mid-term resistance)
Major Resistance: 1,758.40 (6th Target / Final Target)
Intermediate Levels: Multiple targets provide stepping stones for profit realization at each resistance zone.
━━━━━━━━━━━━━━━━━━━━━━━━━━━━━━━━━━━━━━━━━━━
🔍 FUNDAMENTAL CATALYST
RELIANCE benefits from strong macro and sector tailwinds:
✅ Energy sector showing strength on geopolitical factors
✅ Oil price trajectory supporting energy stocks
✅ Refining margins remain healthy and supportive
✅ Strong cash flow generation and dividend support
✅ Large-cap stability with continued dividend yield support
This macro backdrop combined with strong technical structure reinforces bullish conviction for trend continuation.
━━━━━━━━━━━━━━━━━━━━━━━━━━━━━━━━━━━━━━━━━━━
🎉 TECHNICAL OBSERVATIONS
• Weekly uptrend remains intact with clear higher highs and higher lows
• Flag breakout on volume confirms institutional participation
• Stock consolidating at higher levels - sign of strength
• Volume profile shows healthy accumulation pattern
• Multiple targets suggest strong resistance zones ahead
• Proper risk/reward of 1:2.97 offers excellent entry/exit structure
• Support at 1,520 provides good risk management anchor
• Stock positions itself well for continued upside exploration
━━━━━━━━━━━━━━━━━━━━━━━━━━━━━━━━━━━━━━━━━━━
💡 TRADING STRATEGY NOTES
✓ Wait for weekly close above 1,585 before committing to positions
✓ Consider scaling entries - don't go all-in at once
✓ Trail stoploss after each target level is achieved
✓ Take partial profits at each resistance level
✓ Preserve capital: Use strict position sizing
✓ Monitor weekly closes carefully
✓ Watch for gaps and opening levels
✓ RELIANCE is a defensive large-cap with strong dividend yield
━━━━━━━━━━━━━━━━━━━━━━━━━━━━━━━━━━━━━━━━━━━
⚠️ CRITICAL DISCLAIMER
🔴 THIS IS TECHNICAL ANALYSIS FOR EDUCATIONAL PURPOSES ONLY
🔴 THIS IS NOT FINANCIAL ADVICE OR AN INVESTMENT RECOMMENDATION
This analysis:
- Is based on historical price patterns and technical indicators
- Does NOT constitute investment advice or a buy/sell recommendation
- Is my personal observation and technical analysis
- Should NOT be the sole basis for any investment decision
- Stock performance depends on multiple macroeconomic factors
━━━━━━━━━━━━━━━━━━━━━━━━━━━━━━━━━━━━━━━━━━━
⚠️ IMPORTANT RISKS TO UNDERSTAND
✓ Past performance does NOT guarantee future results
✓ Technical patterns can FAIL and trends can reverse
✓ Market conditions can change rapidly without warning
✓ This analysis is based on historical data only
✓ Stock investments carry significant risk of loss
✓ You may lose your ENTIRE investment amount
✓ This is a technical observation, NOT a guaranteed strategy
✓ Consult a qualified financial advisor before trading
✓ Do your own independent research (DYOR)
✓ Use strict position sizing and risk management
✓ Oil price volatility can significantly impact RELIANCE
✓ Geopolitical events affect energy sector performance
✓ Market liquidity and volatility can impact execution
✓ Economic indicators and earnings can invalidate patterns
━━━━━━━━━━━━━━━━━━━━━━━━━━━━━━━━━━━━━━━━━━━
🔴 FINAL RISK ACKNOWLEDGMENT
TRADING AND INVESTING IN STOCKS INVOLVES SUBSTANTIAL RISK OF LOSS.
I am NOT a financial advisor, fund manager, or investment professional. This analysis is provided for educational purposes only.
BEFORE MAKING ANY INVESTMENT DECISION:
✓ Conduct your own thorough research
✓ Understand macroeconomic factors affecting energy sector
✓ Check oil price trends and geopolitical developments
✓ Verify your risk appetite and capital availability
✓ Consult with a qualified financial advisor
✓ Only invest capital you can afford to lose
✓ Never follow this as a guaranteed strategy
✓ Understand leverage implications if using derivatives
Your investment decisions are YOUR responsibility. Use proper risk management, stop losses, and position sizing.
━━━━━━━━━━━━━━━━━━━━━━━━━━━━━━━━━━━━━━━━━━━
Trade responsibly. Risk management is paramount.

RELIANCE | Daily - Almost there !RELIANCE | Daily - Almost there ! what is next ?
Getting closer to extensions !!! wait and watch - Popcorn mode !

Reliance might reach 1800 and then reverseReliance might reach 1800 and then reverse. It breaks the upper trend line and retrace back to line to support then only it is pure bullish. Till then short term is better in reliance.

RELIANCE Unleashed | Bulls Roaring StrongThis is the daily timeframe chart of Reliance.
Reliance is moving in a strong momentum phase and is consistently respecting the Supertrend indicator.
Based on Supertrend, the key support level is at 1518.
Currently, the stock is trading above multi-timeframe pivot levels, indicating short-term momentum strength.
Buying opportunities may be considered near the 1530–1540 range.
The stock has a strong support zone around 1515–1520.
Potential upside target is near 1620.
If the support zone sustains, we may see higher prices in Reliance in the coming sessions.
Thank you.

Why We Should Plan Logical Stop-LossThis video explains why using a logical stop-loss is important in trading and how stop-loss placement should be based on market structure rather than emotions. The discussion focuses on understanding where price invalidates an idea, how illogical stop placement increases risk, and why logical stop-loss levels help

Reliance - One more leg down is due in shorter TFCMP: 1543
TF: 15 minutes
The fall from the recent swing high appears to be a 5 wave decline. the bounce from the lows at 1517.6 seem to be a 3 wave rise. And this rise should possibly break the high at 1551 and terminate between 1555-1560.
The price action at the range of 1550-1560 will give us an indication.
The next leg down (C leg) will be sharp and faster and I am expecting it to test 1480-1500 levels depends on where this B wave gets terminated at.
Don't be surprised if the B wave goes past 1580+ in an expanded flat correction
Finally, Reliance is in uptrend and hence, shorting isn't a good idea.
Wait for the correction to end and decide the next course based on the price action at 1500 odd levels.
Disclaimer: I am not a SEBI registered Analyst and this is not a trading advise. Views are personal and for educational purpose only. Please consult your Financial Advisor for any investment decisions. Please consider my views only to get a different perspective (FOR or AGAINST your views). Please don't trade FNO based on my views. If you like my analysis and learnt something from it, please give a BOOST. Feel free to express your thoughts and questions in the comments section.

Inverted Head and Shoulder neckline breakout candidate RELIANCE RELIANCE WEEKLY CHART
Inverse Head & Shoulders spotted — classic bullish reversal in play
🔹 After months of sideways drift, Reliance has carved out a clean inverse H&S pattern on the weekly timeframe. 🔹 The neckline sits around ₹1,553, and price is now testing this zone. 🔹 A breakout above this level could trigger a multi-week upside, with potential targets near ₹1,650–₹1,700.
Reliance Industries Ltd., incorporated in the year 1973, is a Large Cap company (having a market cap of Rs 21,06,329.37 Crore) operating in Diversified sector.
Reliance Industries Ltd. key Products/Revenue Segments include Petrochemicals, Oil & Gas, Other Services, Others and Income from Retailing for the year ending 31-Mar-2025.
For the quarter ended 30-09-2025, the company has reported a Consolidated Total Income of Rs 259,105.00 Crore, up .14 % from last quarter Total Income of Rs 258,751.00 Crore and up 9.60 % from last year same quarter Total Income of Rs 236,411.00 Crore. Company has reported net profit after tax of Rs 22,146.00 Crore in latest quarter.
The company’s top management includes Mr.Mukesh D Ambani, Mr.Anant M Ambani, Mr.Hital R Meswani, Mr.Nikhil R Meswani, Mr.P M S Prasad, Mr.Akash M Ambani, Mrs.Arundhati Bhattacharya, Mr.Dinesh Kanabar, Mr.Haigreve Khaitan, Ms.Isha M Ambani, Mr.K V Chowdary, Mr.K V Kamath, Dr.Shumeet Banerji, Mr.Yasir Othman H Al Rumayyan, Mr.Srikanth Venkatachari, Ms.Savithri Parekh. Company has Chaturvedi & Shah LLP as its auditors. As on 30-09-2025, the company has a total of 1,353.25 Crore shares outstanding.

Reliance Industries Limited for 10th Dec #RELIANCE Reliance Industries Limited for 10th Dec #RELIANCE
Resistance 1540 Watching above 1543 for upside momentum.
Support area 1515-1520 Below 1520 gnoring upside momentum for intraday
Watching below 1513 for downside movement...
Above 1540 ignoring downside move for intraday
Charts for Educational purposes only.
Please follow strict stop loss and risk reward if you follow the level.
Thanks,
V Trade Point

Reliance - Resistance and Support - 30minsThe chart shows Reliance currently trading inside a clear descending channel, indicated by the two blue parallel trendlines. After forming a short-term swing high around the end of November, the stock has been making lower highs and lower lows, confirming a downward trend.
The upper blue trendline is acting as a dynamic resistance, rejecting price each time it attempts to move higher.
The lower blue trendline is acting as dynamic support, where buyers are stepping in temporarily before the price continues downward.
A key horizontal level is marked around ₹1549–1550 (green line). This level previously acted as support but has now turned into a major resistance zone. Reliance has repeatedly failed to sustain above this zone, showing weakness.
On the downside, the ₹1522–1524 support zone (red line) is an important level where price has bounced multiple times. A sustained break below this zone could open the way for deeper downside inside the channel.
Overall, the structure suggests the stock is still in a short-term downtrend unless it breaks out of the descending channel convincingly and reclaims the ₹1549 level.

RIL S/Rsanthosh
Support and Resistance Levels:
Support Levels: These are price points (green line/shade) where a downward trend may be halted due to a concentration of buying interest. Imagine them as a safety net where buyers step in, preventing further decline.
Resistance Levels: Conversely, resistance levels (red line/shade) are where upward trends might stall due to increased selling interest. They act like a ceiling where sellers come in to push prices down.
Breakouts:
Bullish Breakout: When the price moves above resistance, it often indicates strong buying interest and the potential for a continued uptrend. Traders may view this as a signal to buy or hold.
Bearish Breakout: When the price falls below support, it can signal strong selling interest and the potential for a continued downtrend. Traders might see this as a cue to sell or avoid buying.
MA Ribbon (EMA 20, EMA 50, EMA 100, EMA 200) :
Above EMA: If the stock price is above the EMA, it suggests a potential uptrend or bullish momentum.
Below EMA: If the stock price is below the EMA, it indicates a potential downtrend or bearish momentum.
Trendline: A trendline is a straight line drawn on a chart to represent the general direction of a data point set.
Uptrend Line: Drawn by connecting the lows in an upward trend. Indicates that the price is moving higher over time. Acts as a support level, where prices tend to bounce upward.
Downtrend Line: Drawn by connecting the highs in a downward trend. Indicates that the price is moving lower over time. It acts as a resistance level, where prices tend to drop.
Disclaimer:
I am not SEBI registered. The information provided here is for learning purposes only and should not be interpreted as financial advice. Consider the broader market context and consult with a qualified financial advisor before making investment decisions.
1290-1220 : if come then Investment is good to startReliance : 1290-1220 ideal buy levels.
Till then wait n watch only from my side.
Target : 1700-2000
SL : 1165
Manage Your Risk

Reliance Intra day shortReliance as it is likely to test around 1500 levels.
Intraday short opportunity can be seen from the marked levels for 1:2
Entry to be done if 15 mins candle closes below the previous candle or when it leaves the zone.
Maintain proper position size.

Reliance Industries – Key Weekly Chart Setup | Strong SupportReliance Industries – Key Weekly Chart Setup | Strong Support Zone & Rebound Potential 🚀
Ticker: RELIANCE (NSE)
Timeframe: Weekly
Current Price: ₹1,299.50
Technical Indicators: 200W MA, Fibonacci Retracement, MACD Divergence
🔍 Technical Analysis Insight:
Reliance Industries is currently hovering around its 200-week moving average (MA) (~₹1,220–₹1,225 zone), which has historically acted as a strong long-term support. This confluence with the 61.8% Fibonacci retracement from the previous rally (₹1,608.55 to ₹1,121.55) makes this zone crucial.
Support Zone: ₹1,220–₹1,225
Immediate Resistance: ₹1,362–₹1,380 (near 38.2% retracement & 50W MA)
MACD: Showing bullish crossover on the weekly, along with a positive divergence — signaling potential trend reversal.
📌 If broader markets continue in a rebound phase, Reliance could rally up to 20% in a relatively short span. Targets could be ₹1,460 (23.6% retracement) and ₹1,600 (previous swing high).
🛑 Risk Management Note:
Keep an eye on volume confirmation. A weekly close below ₹1,200 could invalidate the bullish setup and warrant re-evaluation.

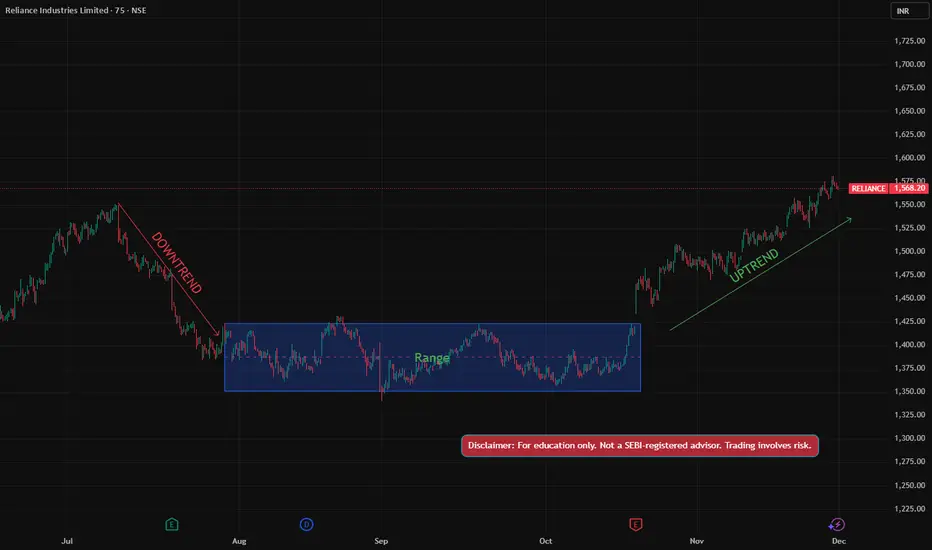
Understanding Market Structure – The Foundation of Price Action📌 Description
Market Structure defines the direction and strength of price.
• Uptrend → Higher Highs & Higher Lows
• Downtrend → Lower Highs & Lower Lows
• Range → Balanced market between support & resistance
Key concepts:
• BOS (Break of Structure) → Trend continuation or reversal confirmation
• CHoCH (Change of Character) → Early warning of trend shift
✅ Mark structure first
✅ Align entries with volume & levels
✅ Trade with the trend, not predictions
Structure controls everything. Indicators only support it.
Disclaimer:
This content is for educational purposes only.
I am not a SEBI registered investment advisor or research analyst.
Views expressed are personal and based on technical analysis.
Trading involves risk. Please consult a SEBI registered advisor before trading.
I am not responsible for any financial losses.